
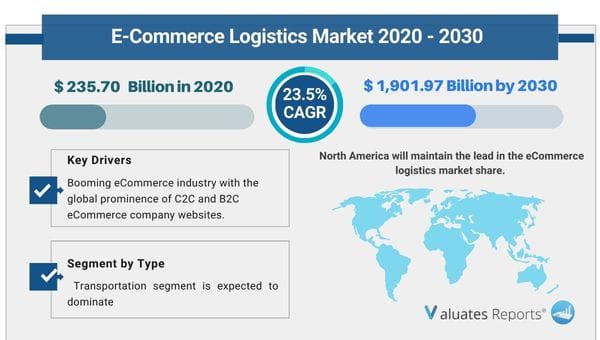
The global e-commerce logistics market was valued at USD 235.70 billion in 2020, and is projected to reach USD 1,901.97 billion by 2030, growing at a CAGR of 23.5% from 2021 to 2030.
Key drivers of the eCommerce logistics market include the booming eCommerce industry with the global prominence of C2C and B2C eCommerce company websites.
The rapid adoption of digital technology and transportation automation will fuel the growth of the eCommerce logistics market during the forecast period.
The expansion of cross-border activities and widespread penetration of the internet will drive the growth of the market in the coming years.
Growing prevalence of the eCommerce industry
The global shopping trends have changed completely with people expecting faster goods delivery just at the click of a button. eCommerce C2C and B2C brands have proliferated giving a wide range of products to end-user customers. Consumers want lower shipping costs, faster fulfillment rates, and seamless return policies. This requires the need for lowering the cost of cargo stored in warehouses. E- fulfillment centers have sprung up that stock up on all essential merchandise and quickly pick and pack products based on individual order levels. Next, the parcel and sorting centers sort all the goods through country and zip code using automated solutions. They are then sent to last-mile distribution centers which are located nearby the delivery locations for reducing operational time and fuel costs. This ultimately decreases the shipping delivery charges. Drones have emerged in supply chain processes for inventory tracking and storage management. Autonomous ships provide automated product picking and quality inspections much faster. These factors will boost the growth of the eCommerce logistics market during the forecast period.
Transportation automation
The main modes of transportation for logistics include air, rail, truck, and maritime ships. The advent of software solutions and automation has accelerated the entire industry. Transport management systems are helping eCommerce companies move freight from origin to final destination more effectively. TMS solutions let you compare two carriers based on time of transit, shipping costs, and insurance limits. The advanced analytics tools provide detailed data on which carrier ships the product efficiently without wasting valuable time and money. It helps in reducing data entry solutions and shifts the focus of scarce resources to more core areas. Together with the warehouse management system, it provides greater visibility in the entire supply chain operation. Moreover, the software allows one to integrate all distribution points related to different locations into a single platform that can be managed by one person. With accurate forecasting inventory stock can be managed properly without the need for wastage or overallocation. Such factors will drive the growth of the eCommerce logistics market in the coming years.
Due to an increase in disposable income and rising standards of living people are shopping for products even outside their borders. The sale of foreign goods is on the rise. Internet penetration is spreading rapidly across the globe. Better logistics and availability of various payment options have made it easier for customers to shop for goods outside their country's borders. Moreover, reduced errors in delivery lead times and processing orders are leading to improved service quality. Higher productivity and efficiency mean better customer satisfaction and an increase in brand trust. Supplier and customer relationships are strengthened through these processes. This will fuel the growth of the eCommerce logistics market during the forecast period.
Complex regulatory issues
Restrictive legal problems are causing bottlenecks in the eCommerce logistics industry. Shipping errors like typing the wrong address, losing track of the package numbers, and miscalculation of weight and size of the product are recurring headaches faced by supply chain managers. Moreover, overestimation of merchandise storage in warehouses can take up additional space and shore up costs and under storing can delay the entire logistics operations. Free shipping entails looking into several factors like the actual value of products, total weight of items to be shipped, the destination, and average order amount. Such complicated operating frameworks are likely to deter the growth of the eCommerce logistics market in the forthcoming period.
Based on service type, the transportation segment is expected to dominate in the eCommerce logistics market share due to innovative transport solutions being adopted by brands like TMS that helps in planning deliveries in the supply chain and improving the efficiency of goods and parcel shipment. However, the warehouse segment will grow the fastest due to technological advancements and automation in managing inventory, and the need for tracking a huge number of goods in the industry.
Based on the operational area, the international segment will maintain the lead in the eCommerce logistics market share while the domestic segment will grow the fastest due to the huge opportunities the domestic supply chain provides to SMEs. They get to conduct trade online and ship products to a huge consumer base thereby driving increased sales.
Based on region, North America will maintain the lead in the eCommerce logistics market share. However, Asia-pacific will grow the fastest due to the increasing eCommerce industry and rapid digital transformation. The cloud deployment and modernization in workforce management will also contribute to its growth.
| Report Metric | Details |
| Report Name | E-Commerce Logistics Market |
| The market size in 2020 | USD 235.70 Billion |
| The revenue forecast in 2030 | USD 1,901.97 Billion |
| Growth Rate | Compound Annual Growth Rate (CAGR) of 23.5% from 2021 to 2030 |
| Market size available for years | 2021-2030 |
| Forecast units | Value (USD) |
| Segments covered | Service, Industry, Traveler, Regions |
| Report coverage | Revenue & volume forecast, company share, competitive landscape, growth factors, and trends |
| Geographic regions covered | North America, Europe, Asia Pacific, Latin America, Middle East & Africa |
Ans. The global e-commerce logistics market was valued at $235.70 billion in 2020, and is projected to reach $1,901.97 billion by 2030.
Ans. Booming e-commerce industry is projected to have prominent impact on the market growth during the forecast period
Ans. The global e-commerce logistics market is estimated to grow with a Compound Annual Growth Rate (CAGR) of 13.2% during the forecast period.
Ans. By Service, Transportation service type dominates the e-commerce logistic market in 2020.
Ans. Asia-Pacific is projected as one of the most lucrative region.
Ans. The key players profiled in this report include ADHL International GmbH, Aramex International, FedEx Corporation, S.F. Express, Gati Limited, Amazon, Kenco Group, Inc., Ceva Holdings LLC, United Parcel Service, Inc., Clipper Logistics Plc.
CHAPTER 1:INTRODUCTION
1.1.Report description
1.2.Key market segments
1.3.Key benefits to the stakeholders
1.4.Research Methodology
1.4.1.Secondary research
1.4.2.Primary research
1.4.3.Analyst tools and models
CHAPTER 2:EXECUTIVE SUMMARY
2.1.Key findings of the study
2.2.CXO Perspective
CHAPTER 3:MARKET OVERVIEW
3.1.Market definition and scope
3.2.Key findings
3.2.1.Top investment pockets
3.3.Porter’s five forces analysis
3.4.Top player positioning
3.5.Market dynamics
3.5.1.Drivers
3.5.2.Restraints
3.5.3.Opportunities
3.6.COVID-19 Impact Analysis on the market
3.7.Key Regulation Analysis
3.8.Regulatory Guidelines
CHAPTER 4: E-COMMERCE LOGISTICS MARKET, BY SERVICE TYPE
4.1 Overview
4.1.1 Market size and forecast
4.2 Transportation
4.2.1 Key market trends, growth factors and opportunities
4.2.2 Market size and forecast, by region
4.2.3 Market analysis by country
4.3 Warehousing
4.3.1 Key market trends, growth factors and opportunities
4.3.2 Market size and forecast, by region
4.3.3 Market analysis by country
CHAPTER 5: E-COMMERCE LOGISTICS MARKET, BY OPERATIONAL AREA
5.1 Overview
5.1.1 Market size and forecast
5.2 International
5.2.1 Key market trends, growth factors and opportunities
5.2.2 Market size and forecast, by region
5.2.3 Market analysis by country
5.3 Domestic
5.3.1 Key market trends, growth factors and opportunities
5.3.2 Market size and forecast, by region
5.3.3 Market analysis by country
CHAPTER 6: E-COMMERCE LOGISTICS MARKET, BY REGION
6.1 Overview
6.1.1 Market size and forecast
6.2 North America
6.2.1 Key trends and opportunities
6.2.2 North America Market size and forecast, by Service Type
6.2.3 North America Market size and forecast, by Operational Area
6.2.4 North America Market size and forecast, by country
6.2.4.1 U.S.
6.2.4.1.1 Market size and forecast, by Service Type
6.2.4.1.2 Market size and forecast, by Operational Area
6.2.4.2 Canada
6.2.4.2.1 Market size and forecast, by Service Type
6.2.4.2.2 Market size and forecast, by Operational Area
6.3 Europe
6.3.1 Key trends and opportunities
6.3.2 Europe Market size and forecast, by Service Type
6.3.3 Europe Market size and forecast, by Operational Area
6.3.4 Europe Market size and forecast, by country
6.3.4.1 United Kingdom
6.3.4.1.1 Market size and forecast, by Service Type
6.3.4.1.2 Market size and forecast, by Operational Area
6.3.4.2 Germany
6.3.4.2.1 Market size and forecast, by Service Type
6.3.4.2.2 Market size and forecast, by Operational Area
6.3.4.3 France
6.3.4.3.1 Market size and forecast, by Service Type
6.3.4.3.2 Market size and forecast, by Operational Area
6.3.4.4 Russia
6.3.4.4.1 Market size and forecast, by Service Type
6.3.4.4.2 Market size and forecast, by Operational Area
6.3.4.5 Italy
6.3.4.5.1 Market size and forecast, by Service Type
6.3.4.5.2 Market size and forecast, by Operational Area
6.3.4.6 Rest of Europe
6.3.4.6.1 Market size and forecast, by Service Type
6.3.4.6.2 Market size and forecast, by Operational Area
6.4 Asia-Pacific
6.4.1 Key trends and opportunities
6.4.2 Asia-Pacific Market size and forecast, by Service Type
6.4.3 Asia-Pacific Market size and forecast, by Operational Area
6.4.4 Asia-Pacific Market size and forecast, by country
6.4.4.1 China
6.4.4.1.1 Market size and forecast, by Service Type
6.4.4.1.2 Market size and forecast, by Operational Area
6.4.4.2 India
6.4.4.2.1 Market size and forecast, by Service Type
6.4.4.2.2 Market size and forecast, by Operational Area
6.4.4.3 Japan
6.4.4.3.1 Market size and forecast, by Service Type
6.4.4.3.2 Market size and forecast, by Operational Area
6.4.4.4 South Korea
6.4.4.4.1 Market size and forecast, by Service Type
6.4.4.4.2 Market size and forecast, by Operational Area
6.4.4.5 Australia
6.4.4.5.1 Market size and forecast, by Service Type
6.4.4.5.2 Market size and forecast, by Operational Area
6.4.4.6 Rest of Asia-Pacific
6.4.4.6.1 Market size and forecast, by Service Type
6.4.4.6.2 Market size and forecast, by Operational Area
6.5 LAMEA
6.5.1 Key trends and opportunities
6.5.2 LAMEA Market size and forecast, by Service Type
6.5.3 LAMEA Market size and forecast, by Operational Area
6.5.4 LAMEA Market size and forecast, by country
6.5.4.1 Latin America
6.5.4.1.1 Market size and forecast, by Service Type
6.5.4.1.2 Market size and forecast, by Operational Area
6.5.4.2 Middle East
6.5.4.2.1 Market size and forecast, by Service Type
6.5.4.2.2 Market size and forecast, by Operational Area
6.5.4.3 Africa
6.5.4.3.1 Market size and forecast, by Service Type
6.5.4.3.2 Market size and forecast, by Operational Area
CHAPTER 7: COMPANY LANDSCAPE
7.1. Introduction
7.2. Top winning strategies
7.3. Product Mapping of Top 10 Player
7.4. Competitive Dashboard
7.5. Competitive Heatmap
7.6. Key developments
CHAPTER 8: COMPANY PROFILES
8.1 DHL International GmbH
8.1.1 Company overview
8.1.2 Company snapshot
8.1.3 Operating business segments
8.1.4 Product portfolio
8.1.5 Business performance
8.1.6 Key strategic moves and developments
8.2 Aramex International
8.2.1 Company overview
8.2.2 Company snapshot
8.2.3 Operating business segments
8.2.4 Product portfolio
8.2.5 Business performance
8.2.6 Key strategic moves and developments
8.3 FedEx Corporation
8.3.1 Company overview
8.3.2 Company snapshot
8.3.3 Operating business segments
8.3.4 Product portfolio
8.3.5 Business performance
8.3.6 Key strategic moves and developments
8.4 S.F. Express
8.4.1 Company overview
8.4.2 Company snapshot
8.4.3 Operating business segments
8.4.4 Product portfolio
8.4.5 Business performance
8.4.6 Key strategic moves and developments
8.5 Gati Limited
8.5.1 Company overview
8.5.2 Company snapshot
8.5.3 Operating business segments
8.5.4 Product portfolio
8.5.5 Business performance
8.5.6 Key strategic moves and developments
8.6 Amazon
8.6.1 Company overview
8.6.2 Company snapshot
8.6.3 Operating business segments
8.6.4 Product portfolio
8.6.5 Business performance
8.6.6 Key strategic moves and developments
8.7 Kenco Group, Inc.
8.7.1 Company overview
8.7.2 Company snapshot
8.7.3 Operating business segments
8.7.4 Product portfolio
8.7.5 Business performance
8.7.6 Key strategic moves and developments
8.8 Ceva Holdings LLC
8.8.1 Company overview
8.8.2 Company snapshot
8.8.3 Operating business segments
8.8.4 Product portfolio
8.8.5 Business performance
8.8.6 Key strategic moves and developments
8.9 United Parcel Service, Inc.
8.9.1 Company overview
8.9.2 Company snapshot
8.9.3 Operating business segments
8.9.4 Product portfolio
8.9.5 Business performance
8.9.6 Key strategic moves and developments
8.10 Clipper Logistics Plc.
8.10.1 Company overview
8.10.2 Company snapshot
8.10.3 Operating business segments
8.10.4 Product portfolio
8.10.5 Business performance
8.10.6 Key strategic moves and developments
Note: Details on financial performance and strategic moves and developments may not be captured for unlisted companies.
LIST OF TABLES
TABLE 1. GLOBAL E-COMMERCE LOGISTICS MARKET, BY SERVICE TYPE, 2020-2030,($BILLION)
TABLE 2. E-COMMERCE LOGISTICS MARKET REVENUE, FOR TRANSPORTATION, BY REGION , 2020-2030,($BILLION)
TABLE 3. E-COMMERCE LOGISTICS MARKET TRANSPORTATION BY COUNTRY, 2020-2030,($BILLION)
TABLE 4. E-COMMERCE LOGISTICS MARKET REVENUE, FOR WAREHOUSING, BY REGION , 2020-2030,($BILLION)
TABLE 5. E-COMMERCE LOGISTICS MARKET WAREHOUSING BY COUNTRY, 2020-2030,($BILLION)
TABLE 6. GLOBAL E-COMMERCE LOGISTICS MARKET, BY OPERATIONAL AREA, 2020-2030,($BILLION)
TABLE 7. E-COMMERCE LOGISTICS MARKET REVENUE, FOR INTERNATIONAL, BY REGION , 2020-2030,($BILLION)
TABLE 8. E-COMMERCE LOGISTICS MARKET INTERNATIONAL BY COUNTRY, 2020-2030,($BILLION)
TABLE 9. E-COMMERCE LOGISTICS MARKET REVENUE, FOR DOMESTIC, BY REGION , 2020-2030,($BILLION)
TABLE 10. E-COMMERCE LOGISTICS MARKET DOMESTIC BY COUNTRY, 2020-2030,($BILLION)
TABLE 11. E-COMMERCE LOGISTICS MARKET, BY REGION, 2020-2030,($BILLION)
TABLE 12. NORTH AMERICA E-COMMERCE LOGISTICS MARKET, BY SERVICE TYPE, 2020-2030,($BILLION)
TABLE 13. NORTH AMERICA E-COMMERCE LOGISTICS MARKET, BY OPERATIONAL AREA, 2020-2030,($BILLION)
TABLE 14. NORTH AMERICA E-COMMERCE LOGISTICS MARKET, BY COUNTRY, 2020-2030,($BILLION)
TABLE 15. U.S. E-COMMERCE LOGISTICS MARKET BY SERVICE TYPE 2020-2030,($BILLION)
TABLE 16. U.S. E-COMMERCE LOGISTICS MARKET BY OPERATIONAL AREA 2020-2030,($BILLION)
TABLE 17. CANADA E-COMMERCE LOGISTICS MARKET BY SERVICE TYPE 2020-2030,($BILLION)
TABLE 18. CANADA E-COMMERCE LOGISTICS MARKET BY OPERATIONAL AREA 2020-2030,($BILLION)
TABLE 19. EUROPE E-COMMERCE LOGISTICS MARKET, BY SERVICE TYPE, 2020-2030,($BILLION)
TABLE 20. EUROPE E-COMMERCE LOGISTICS MARKET, BY OPERATIONAL AREA, 2020-2030,($BILLION)
TABLE 21. EUROPE E-COMMERCE LOGISTICS MARKET, BY COUNTRY, 2020-2030,($BILLION)
TABLE 22. UNITED KINGDOM E-COMMERCE LOGISTICS MARKET BY SERVICE TYPE 2020-2030,($BILLION)
TABLE 23. UNITED KINGDOM E-COMMERCE LOGISTICS MARKET BY OPERATIONAL AREA 2020-2030,($BILLION)
TABLE 24. GERMANY E-COMMERCE LOGISTICS MARKET BY SERVICE TYPE 2020-2030,($BILLION)
TABLE 25. GERMANY E-COMMERCE LOGISTICS MARKET BY OPERATIONAL AREA 2020-2030,($BILLION)
TABLE 26. FRANCE E-COMMERCE LOGISTICS MARKET BY SERVICE TYPE 2020-2030,($BILLION)
TABLE 27. FRANCE E-COMMERCE LOGISTICS MARKET BY OPERATIONAL AREA 2020-2030,($BILLION)
TABLE 28. RUSSIA E-COMMERCE LOGISTICS MARKET BY SERVICE TYPE 2020-2030,($BILLION)
TABLE 29. RUSSIA E-COMMERCE LOGISTICS MARKET BY OPERATIONAL AREA 2020-2030,($BILLION)
TABLE 30. ITALY E-COMMERCE LOGISTICS MARKET BY SERVICE TYPE 2020-2030,($BILLION)
TABLE 31. ITALY E-COMMERCE LOGISTICS MARKET BY OPERATIONAL AREA 2020-2030,($BILLION)
TABLE 32. REST OF EUROPE E-COMMERCE LOGISTICS MARKET BY SERVICE TYPE 2020-2030,($BILLION)
TABLE 33. REST OF EUROPE E-COMMERCE LOGISTICS MARKET BY OPERATIONAL AREA 2020-2030,($BILLION)
TABLE 34. ASIA-PACIFIC E-COMMERCE LOGISTICS MARKET, BY SERVICE TYPE, 2020-2030,($BILLION)
TABLE 35. ASIA-PACIFIC E-COMMERCE LOGISTICS MARKET, BY OPERATIONAL AREA, 2020-2030,($BILLION)
TABLE 36. ASIA-PACIFIC E-COMMERCE LOGISTICS MARKET, BY COUNTRY, 2020-2030,($BILLION)
TABLE 37. CHINA E-COMMERCE LOGISTICS MARKET BY SERVICE TYPE 2020-2030,($BILLION)
TABLE 38. CHINA E-COMMERCE LOGISTICS MARKET BY OPERATIONAL AREA 2020-2030,($BILLION)
TABLE 39. INDIA E-COMMERCE LOGISTICS MARKET BY SERVICE TYPE 2020-2030,($BILLION)
TABLE 40. INDIA E-COMMERCE LOGISTICS MARKET BY OPERATIONAL AREA 2020-2030,($BILLION)
TABLE 41. JAPAN E-COMMERCE LOGISTICS MARKET BY SERVICE TYPE 2020-2030,($BILLION)
TABLE 42. JAPAN E-COMMERCE LOGISTICS MARKET BY OPERATIONAL AREA 2020-2030,($BILLION)
TABLE 43. SOUTH KOREA E-COMMERCE LOGISTICS MARKET BY SERVICE TYPE 2020-2030,($BILLION)
TABLE 44. SOUTH KOREA E-COMMERCE LOGISTICS MARKET BY OPERATIONAL AREA 2020-2030,($BILLION)
TABLE 45. AUSTRALIA E-COMMERCE LOGISTICS MARKET BY SERVICE TYPE 2020-2030,($BILLION)
TABLE 46. AUSTRALIA E-COMMERCE LOGISTICS MARKET BY OPERATIONAL AREA 2020-2030,($BILLION)
TABLE 47. REST OF ASIA-PACIFIC E-COMMERCE LOGISTICS MARKET BY SERVICE TYPE 2020-2030,($BILLION)
TABLE 48. REST OF ASIA-PACIFIC E-COMMERCE LOGISTICS MARKET BY OPERATIONAL AREA 2020-2030,($BILLION)
TABLE 49. LAMEA E-COMMERCE LOGISTICS MARKET, BY SERVICE TYPE, 2020-2030,($BILLION)
TABLE 50. LAMEA E-COMMERCE LOGISTICS MARKET, BY OPERATIONAL AREA, 2020-2030,($BILLION)
TABLE 51. LAMEA E-COMMERCE LOGISTICS MARKET, BY COUNTRY, 2020-2030,($BILLION)
TABLE 52. LATIN AMERICA E-COMMERCE LOGISTICS MARKET BY SERVICE TYPE 2020-2030,($BILLION)
TABLE 53. LATIN AMERICA E-COMMERCE LOGISTICS MARKET BY OPERATIONAL AREA 2020-2030,($BILLION)
TABLE 54. MIDDLE EAST E-COMMERCE LOGISTICS MARKET BY SERVICE TYPE 2020-2030,($BILLION)
TABLE 55. MIDDLE EAST E-COMMERCE LOGISTICS MARKET BY OPERATIONAL AREA 2020-2030,($BILLION)
TABLE 56. AFRICA E-COMMERCE LOGISTICS MARKET BY SERVICE TYPE 2020-2030,($BILLION)
TABLE 57. AFRICA E-COMMERCE LOGISTICS MARKET BY OPERATIONAL AREA 2020-2030,($BILLION)
TABLE 58.DHL INTERNATIONAL GMBH: COMPANY SNAPSHOT
TABLE 59.DHL INTERNATIONAL GMBH: OPERATING SEGMENTS
TABLE 60.DHL INTERNATIONAL GMBH: PRODUCT PORTFOLIO
TABLE 61.DHL INTERNATIONAL GMBH: NET SALES,
TABLE 62.DHL INTERNATIONAL GMBH: KEY STRATERGIES
TABLE 63.ARAMEX INTERNATIONAL: COMPANY SNAPSHOT
TABLE 64.ARAMEX INTERNATIONAL: OPERATING SEGMENTS
TABLE 65.ARAMEX INTERNATIONAL: PRODUCT PORTFOLIO
TABLE 66.ARAMEX INTERNATIONAL: NET SALES,
TABLE 67.ARAMEX INTERNATIONAL: KEY STRATERGIES
TABLE 68.FEDEX CORPORATION: COMPANY SNAPSHOT
TABLE 69.FEDEX CORPORATION: OPERATING SEGMENTS
TABLE 70.FEDEX CORPORATION: PRODUCT PORTFOLIO
TABLE 71.FEDEX CORPORATION: NET SALES,
TABLE 72.FEDEX CORPORATION: KEY STRATERGIES
TABLE 73.S.F. EXPRESS: COMPANY SNAPSHOT
TABLE 74.S.F. EXPRESS: OPERATING SEGMENTS
TABLE 75.S.F. EXPRESS: PRODUCT PORTFOLIO
TABLE 76.S.F. EXPRESS: NET SALES,
TABLE 77.S.F. EXPRESS: KEY STRATERGIES
TABLE 78.GATI LIMITED: COMPANY SNAPSHOT
TABLE 79.GATI LIMITED: OPERATING SEGMENTS
TABLE 80.GATI LIMITED: PRODUCT PORTFOLIO
TABLE 81.GATI LIMITED: NET SALES,
TABLE 82.GATI LIMITED: KEY STRATERGIES
TABLE 83.AMAZON: COMPANY SNAPSHOT
TABLE 84.AMAZON: OPERATING SEGMENTS
TABLE 85.AMAZON: PRODUCT PORTFOLIO
TABLE 86.AMAZON: NET SALES,
TABLE 87.AMAZON: KEY STRATERGIES
TABLE 88.KENCO GROUP, INC.: COMPANY SNAPSHOT
TABLE 89.KENCO GROUP, INC.: OPERATING SEGMENTS
TABLE 90.KENCO GROUP, INC.: PRODUCT PORTFOLIO
TABLE 91.KENCO GROUP, INC.: NET SALES,
TABLE 92.KENCO GROUP, INC.: KEY STRATERGIES
TABLE 93.CEVA HOLDINGS LLC: COMPANY SNAPSHOT
TABLE 94.CEVA HOLDINGS LLC: OPERATING SEGMENTS
TABLE 95.CEVA HOLDINGS LLC: PRODUCT PORTFOLIO
TABLE 96.CEVA HOLDINGS LLC: NET SALES,
TABLE 97.CEVA HOLDINGS LLC: KEY STRATERGIES
TABLE 98.UNITED PARCEL SERVICE, INC.: COMPANY SNAPSHOT
TABLE 99.UNITED PARCEL SERVICE, INC.: OPERATING SEGMENTS
TABLE 100.UNITED PARCEL SERVICE, INC.: PRODUCT PORTFOLIO
TABLE 101.UNITED PARCEL SERVICE, INC.: NET SALES,
TABLE 102.UNITED PARCEL SERVICE, INC.: KEY STRATERGIES
TABLE 103.CLIPPER LOGISTICS PLC.: COMPANY SNAPSHOT
TABLE 104.CLIPPER LOGISTICS PLC.: OPERATING SEGMENTS
TABLE 105.CLIPPER LOGISTICS PLC.: PRODUCT PORTFOLIO
TABLE 106.CLIPPER LOGISTICS PLC.: NET SALES,
TABLE 107.CLIPPER LOGISTICS PLC.: KEY STRATERGIES
LIST OF FIGURES
FIGURE 1.E-COMMERCE LOGISTICS MARKET SEGMENTATION
FIGURE 2.E-COMMERCE LOGISTICS MARKET,2020-2030
FIGURE 3.E-COMMERCE LOGISTICS MARKET,2020-2030
FIGURE 4. TOP INVESTMENT POCKETS, BY REGION
FIGURE 5.PORTER FIVE-1
FIGURE 6.PORTER FIVE-2
FIGURE 7.PORTER FIVE-3
FIGURE 8.PORTER FIVE-4
FIGURE 9.PORTER FIVE-5
FIGURE 10.TOP PLAYER POSITIONING
FIGURE 11.E-COMMERCE LOGISTICS MARKET:DRIVERS, RESTRAINTS AND OPPORTUNITIES
FIGURE 12.KEY REGULATION ANALYSIS
FIGURE 13.REGULATORY GUIDELINES
FIGURE 14.E-COMMERCE LOGISTICS MARKET,BY SERVICE TYPE,2020(%)
FIGURE 15.COMPARATIVE SHARE ANALYSIS OF TRANSPORTATION E-COMMERCE LOGISTICS MARKET,2020-2030(%)
FIGURE 16.COMPARATIVE SHARE ANALYSIS OF WAREHOUSING E-COMMERCE LOGISTICS MARKET,2020-2030(%)
FIGURE 17.E-COMMERCE LOGISTICS MARKET,BY OPERATIONAL AREA,2020(%)
FIGURE 18.COMPARATIVE SHARE ANALYSIS OF INTERNATIONAL E-COMMERCE LOGISTICS MARKET,2020-2030(%)
FIGURE 19.COMPARATIVE SHARE ANALYSIS OF DOMESTIC E-COMMERCE LOGISTICS MARKET,2020-2030(%)
FIGURE 20.E-COMMERCE LOGISTICS MARKET BY REGION,2020
FIGURE 21.U.S. E-COMMERCE LOGISTICS MARKET,2020-2030($BILLION)
FIGURE 22.CANADA E-COMMERCE LOGISTICS MARKET,2020-2030($BILLION)
FIGURE 23.UNITED KINGDOM E-COMMERCE LOGISTICS MARKET,2020-2030($BILLION)
FIGURE 24.GERMANY E-COMMERCE LOGISTICS MARKET,2020-2030($BILLION)
FIGURE 25.FRANCE E-COMMERCE LOGISTICS MARKET,2020-2030($BILLION)
FIGURE 26.RUSSIA E-COMMERCE LOGISTICS MARKET,2020-2030($BILLION)
FIGURE 27.ITALY E-COMMERCE LOGISTICS MARKET,2020-2030($BILLION)
FIGURE 28.REST OF EUROPE E-COMMERCE LOGISTICS MARKET,2020-2030($BILLION)
FIGURE 29.CHINA E-COMMERCE LOGISTICS MARKET,2020-2030($BILLION)
FIGURE 30.INDIA E-COMMERCE LOGISTICS MARKET,2020-2030($BILLION)
FIGURE 31.JAPAN E-COMMERCE LOGISTICS MARKET,2020-2030($BILLION)
FIGURE 32.SOUTH KOREA E-COMMERCE LOGISTICS MARKET,2020-2030($BILLION)
FIGURE 33.AUSTRALIA E-COMMERCE LOGISTICS MARKET,2020-2030($BILLION)
FIGURE 34.REST OF ASIA-PACIFIC E-COMMERCE LOGISTICS MARKET,2020-2030($BILLION)
FIGURE 35.LATIN AMERICA E-COMMERCE LOGISTICS MARKET,2020-2030($BILLION)
FIGURE 36.MIDDLE EAST E-COMMERCE LOGISTICS MARKET,2020-2030($BILLION)
FIGURE 37.AFRICA E-COMMERCE LOGISTICS MARKET,2020-2030($BILLION)
FIGURE 38. TOP WINNING STRATEGIES, BY YEAR
FIGURE 39. TOP WINNING STRATEGIES, BY DEVELOPMENT
FIGURE 40. TOP WINNING STRATEGIES, BY COMPANY
FIGURE 41.PRODUCT MAPPING OF TOP 10 PLAYERS
FIGURE 42.COMPETITIVE DASHBOARD
FIGURE 43.COMPETITIVE HEATMAP OF TOP 10 KEY PLAYERS
FIGURE 44.DHL INTERNATIONAL GMBH.: NET SALES ,($BILLION)
FIGURE 45.ARAMEX INTERNATIONAL.: NET SALES ,($BILLION)
FIGURE 46.FEDEX CORPORATION.: NET SALES ,($BILLION)
FIGURE 47.S.F. EXPRESS.: NET SALES ,($BILLION)
FIGURE 48.GATI LIMITED.: NET SALES ,($BILLION)
FIGURE 49.AMAZON.: NET SALES ,($BILLION)
FIGURE 50.KENCO GROUP, INC..: NET SALES ,($BILLION)
FIGURE 51.CEVA HOLDINGS LLC.: NET SALES ,($BILLION)
FIGURE 52.UNITED PARCEL SERVICE, INC..: NET SALES ,($BILLION)
FIGURE 53.CLIPPER LOGISTICS PLC..: NET SALES ,($BILLION)
$5398
$6004
$9373
HAVE A QUERY?
OUR CUSTOMER

SIMILAR REPORTS