0
U.S. (TOLL FREE)
+1 (315) 215-3225
Automative

0
U.S. (TOLL FREE)
+1 (315) 215-3225
High Power Liquid Cooled DC Charging Pile- Global Market Share and Ranking, Overall Sales and Demand Forecast 2026-2032
Published Date: 2026-01-13
|
Report Code: QYRE-Auto-30B14063
Home | Market Reports | Business & Industrial| Automotive Industry
Global High Power Liquid Cooled DC Charging Pile Market Research Report 2023
BUY CHAPTERS

High Power Liquid Cooled DC Charging Pile- Global Market Share and Ranking, Overall Sales and Demand Forecast 2026-2032

Code: QYRE-Auto-30B14063
Report
2026-01-13
Pages:130
QYResearch
Buy Now with 15% Discount
DESCRIPTION
TABLE OF CONTENT
TABLES & FIGURES

High Power Liquid Cooled DC Charging Pile- Market Size

The global market for High Power Liquid Cooled DC Charging Pile was estimated to be worth US$ 3017 million in 2025 and is projected to reach US$ 25710 million, growing at a CAGR of 35.6% from 2026 to 2032.

High Power Liquid Cooled DC Charging Pile- Market

High Power Liquid Cooled DC Charging Pile- Market

The potential shifts in the 2025 U.S. tariff framework pose substantial volatility risks to global markets. This report provides a comprehensive assessment of recent tariff adjustments and international strategic countermeasures on High Power Liquid Cooled DC Charging Pile cross-border industrial footprints, capital allocation patterns, regional economic interdependencies, and supply chain reconfigurations.
A High Power Liquid Cooled DC Charging Pile is a DC EV supply equipment (EVSE) designed for high-power, high-current fast charging (typically hundreds of kW and above), where liquid cooling is used—most commonly inside the charging connector and cable—to keep temperatures within safe limits while delivering sustained high current.
Upstream, the core bill of materials is split between power electronics and thermal management. The power stage includes AC/DC and DC/DC conversion (power modules), magnetics, capacitors, contactors, metering, insulation monitoring, and control/HMI; the cooling side includes pumps, heat exchangers, hoses/quick couplings, sensors, coolant, and (often) dedicated HPC cooling units.
Downstream, these chargers are deployed in high-utilization scenarios such as highway hubs, urban ultra-fast sites, and fleet depots, where throughput and uptime justify higher capex and grid capacity.
In 2025, global sales of High Power Liquid Cooled DC Charging Pile reached approximately 18 K units, with an average global market price of around US$ 165 K/unit. Production capacity varies significantly among manufacturers, with gross profit margins ranging from approximately 30% to 45%.
High power liquid cooled DC charging piles are gaining share because they solve three problems at once: sustained high-current delivery, thermal safety, and real-world usability. As vehicle platforms move toward higher-voltage architectures and faster charging acceptance, charging operators need equipment that can deliver more energy in a short dwell time without derating. Liquid-cooled connectors and cables address the heat and handling challenges that come with high current, enabling slimmer, lighter assemblies and more stable performance, which in turn improves uptime and customer experience.
Demand typically concentrates in high-utilization locations such as corridor hubs, urban ultra-fast sites, and fleet depots where time and throughput matter most. On the supply side, product roadmaps are converging on modular power electronics, split architectures with centralized power cabinets and dispensers, and deeper integration with energy management for load control and operational efficiency. Interoperability and compliance are becoming decisive differentiators: vehicle-to-charger communication, charger-to-backend protocols, metering, safety certification, and remote diagnostics determine whether a product can be widely deployed across operator networks.
Even as equipment costs trend downward with scaling and supply-chain learning, project rollout is still constrained by grid capacity, connection lead times, and site permitting. This naturally drives a phased deployment pattern: operators prioritize sites with favorable grid access and strong utilization economics, validate reliability and service workflows, and then replicate standardized designs across broader networks.
This report provides a comprehensive view of the global market for High Power Liquid Cooled DC Charging Pile, covering total sales volume, sales revenue, pricing, the market share and ranking of key companies, along with analyses by region & country, by Type, and by Application.
The High Power Liquid Cooled DC Charging Pile market size, estimations, and forecasts are presented in terms of sales volume (Units) and revenue ($ millions), with 2025 as the base year and historical and forecast data from 2021 to 2032. The report combines quantitative and qualitative analysis to help readers develop growth strategies, assess the competitive landscape, evaluate their position in the current marketplace, and make informed business decisions regarding High Power Liquid Cooled DC Charging Pile.
Market Segmentation

Scope of High Power Liquid Cooled DC Charging Pile- Market Report

Report Metric Details
Report Name High Power Liquid Cooled DC Charging Pile- Market
CAGR 35.6%
Segment by Type
  • <360kW
  • ≥360kW
Segment by Maximum DC Output Voltage
  • <800V
  • ≥800V
Segment by Charger Architecture
  • All-in-one Integrated Charger
  • Split Charger
Segment by Application
  • Expressway Service Area
  • Shopping Center
  • Parking Lot
  • Other
By Region
  • North America (United States, Canada)
  • Europe (Germany, France, UK, Italy, Russia) Rest of Europe
  • Nordic Countries
  • Asia-Pacific (China, Japan, South Korea)
  • Southeast Asia (India, Australia)
  • Rest of Asia
  • Latin America (Mexico, Brazil)
  • Rest of Latin America
  • Middle East & Africa (Turkey, Saudi Arabia, UAE, Rest of MEA)
Consumption by Region
  • North America (United States, Canada)
  • Europe (Germany, France, UK, Italy, Russia)
  • Asia-Pacific (China, Japan, South Korea, Taiwan)
  • Southeast Asia (India)
  • Latin America (Mexico, Brazil)
By Company Tesla, ABB, Siemens, Kempower, Alpitronic, Chargepoint, BorgWarner, Huawei, VREMT, GAC Energy, StarCharge, Infypower, Xuji Group
Forecast units USD million in value
Report coverage Revenue and volume forecast, company share, competitive landscape, growth factors and trends

Chapter Outline

  • Chapter 1: Introduces the scope of the report and the global market size (value, volume, and price). It also summarizes market dynamics and Recent Developments; identifies key drivers and restraints; outlines challenges and risks for manufacturers; reviews relevant industry policies and U.S. tariff implications.
  • Chapter 2: Provides a detailed analysis of the High Power Liquid Cooled DC Charging Pile manufacturers' competitive landscape—including pricing, sales and revenue shares, Recent Developments plans, and mergers and acquisitions (M&A).
  • Chapter 3: Analyzes market segmentation by Type, presenting the size and growth potential of each segment to help readers identify blue-ocean opportunities.
  • Chapter 4: Analyzes market segmentation by Application, presenting the size and growth potential of each downstream segment to help readers identify blue-ocean opportunities.
  • Chapter 5: Presents High Power Liquid Cooled DC Charging Pile sales and revenue at the regional level. It offers a quantitative assessment of market size and growth potential by region and summarizes market development, future prospects, addressable space, and country-level market size worldwide.
  • Chapter 6: Presents High Power Liquid Cooled DC Charging Pile sales and revenue at the country level. It provides segmented data by Type and by Application for each country/region.
  • Chapter 7: Profiles key players, detailing the main companies' product sales, revenue, pricing, gross margin, product portfolios, Recent Developments, etc.
  • Chapter 8: Analyzes the industry value chain, including upstream suppliers and downstream applications/customers.
  • Chapter 9: Conclusion.

FAQ for this report

Who are the main players in the High Power Liquid Cooled DC Charging Pile- Market report?

Ans: The main players in the High Power Liquid Cooled DC Charging Pile- Market are Tesla, ABB, Siemens, Kempower, Alpitronic, Chargepoint, BorgWarner, Huawei, VREMT, GAC Energy, StarCharge, Infypower, Xuji Group

What are the Application segmentation covered in the High Power Liquid Cooled DC Charging Pile- Market report?

Ans: The Applications covered in the High Power Liquid Cooled DC Charging Pile- Market report are Expressway Service Area, Shopping Center, Parking Lot, Other

What are the Type segmentation covered in the High Power Liquid Cooled DC Charging Pile- Market report?

Ans: The Types covered in the High Power Liquid Cooled DC Charging Pile- Market report are <360kW, ≥360kW

1 Market Overview
1.1 High Power Liquid Cooled DC Charging Pile Product Introduction
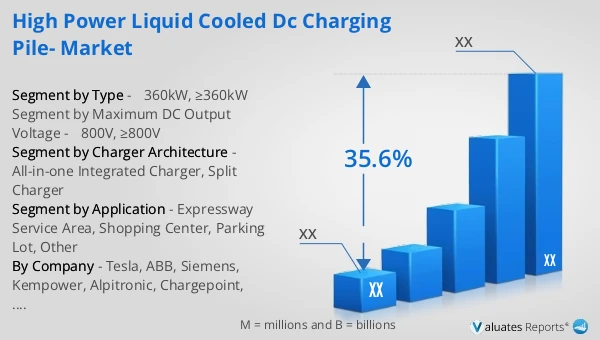
1.2 Global High Power Liquid Cooled DC Charging Pile Market Size Forecast
1.2.1 Global High Power Liquid Cooled DC Charging Pile Sales Value (2021–2032)
1.2.2 Global High Power Liquid Cooled DC Charging Pile Sales Volume (2021–2032)
1.2.3 Global High Power Liquid Cooled DC Charging Pile Sales Price (2021–2032)
1.3 High Power Liquid Cooled DC Charging Pile Market Trends & Drivers
1.3.1 High Power Liquid Cooled DC Charging Pile Industry Trends
1.3.2 High Power Liquid Cooled DC Charging Pile Market Drivers & Opportunities
1.3.3 High Power Liquid Cooled DC Charging Pile Market Challenges
1.3.4 High Power Liquid Cooled DC Charging Pile Market Restraints
1.3.5 Impact of U.S. Tariffs
1.4 Assumptions and Limitations
1.5 Study Objectives
1.6 Years Considered
2 Competitive Analysis by Company
2.1 Global High Power Liquid Cooled DC Charging Pile Players Revenue Ranking (2025)
2.2 Global High Power Liquid Cooled DC Charging Pile Revenue by Company (2021–2026)
2.3 Global High Power Liquid Cooled DC Charging Pile Sales Volume Ranking of Players (2025)
2.4 Global High Power Liquid Cooled DC Charging Pile Sales Volume by Company (2021–2026)
2.5 Global High Power Liquid Cooled DC Charging Pile Average Price by Company (2021–2026)
2.6 Key Manufacturers High Power Liquid Cooled DC Charging Pile Manufacturing Base and Headquarters
2.7 Key Manufacturers High Power Liquid Cooled DC Charging Pile Product Offerings
2.8 Key Manufacturers Start of Mass Production of High Power Liquid Cooled DC Charging Pile
2.9 High Power Liquid Cooled DC Charging Pile Market Competitive Analysis
2.9.1 High Power Liquid Cooled DC Charging Pile Market Concentration Rate (2021–2026)
2.9.2 Global 5 and 10 Largest Manufacturers by High Power Liquid Cooled DC Charging Pile Revenue in 2025
2.9.3 Global Companies by Tier (Tier 1, Tier 2, Tier 3), based on High Power Liquid Cooled DC Charging Pile revenue, 2025
2.10 Mergers & Acquisitions and Expansion
3 Segmentation High Power Liquid Cooled DC Charging Pile Market Classification
3.1 Introduction by Type
3.1.1 <360kW
3.1.2 ≥360kW
3.1.3 Global High Power Liquid Cooled DC Charging Pile Sales Value by Type
3.1.3.1 Global High Power Liquid Cooled DC Charging Pile Sales Value by Type (2021 vs 2025 vs 2032)
3.1.3.2 Global High Power Liquid Cooled DC Charging Pile Sales Value, by Type (2021–2032)
3.1.3.3 Global High Power Liquid Cooled DC Charging Pile Sales Value, by Type (%), 2021–2032
3.1.4 Global High Power Liquid Cooled DC Charging Pile Sales Volume by Type
3.1.4.1 Global High Power Liquid Cooled DC Charging Pile Sales Volume by Type (2021 vs 2025 vs 2032)
3.1.4.2 Global High Power Liquid Cooled DC Charging Pile Sales Volume, by Type (2021–2032)
3.1.4.3 Global High Power Liquid Cooled DC Charging Pile Sales Volume, by Type (%), 2021–2032
3.1.5 Global High Power Liquid Cooled DC Charging Pile Average Price by Type (2021–2032)
3.2 Introduction by Maximum DC Output Voltage
3.2.1 <800V
3.2.2 ≥800V
3.2.3 Global High Power Liquid Cooled DC Charging Pile Sales Value by Maximum DC Output Voltage
3.2.3.1 Global High Power Liquid Cooled DC Charging Pile Sales Value by Maximum DC Output Voltage (2021 vs 2025 vs 2032)
3.2.3.2 Global High Power Liquid Cooled DC Charging Pile Sales Value, by Maximum DC Output Voltage (2021–2032)
3.2.3.3 Global High Power Liquid Cooled DC Charging Pile Sales Value, by Maximum DC Output Voltage (%), 2021–2032
3.2.4 Global High Power Liquid Cooled DC Charging Pile Sales Volume by Maximum DC Output Voltage
3.2.4.1 Global High Power Liquid Cooled DC Charging Pile Sales Volume by Maximum DC Output Voltage (2021 vs 2025 vs 2032)
3.2.4.2 Global High Power Liquid Cooled DC Charging Pile Sales Volume, by Maximum DC Output Voltage (2021–2032)
3.2.4.3 Global High Power Liquid Cooled DC Charging Pile Sales Volume, by Maximum DC Output Voltage (%), 2021–2032
3.2.5 Global High Power Liquid Cooled DC Charging Pile Average Price by Maximum DC Output Voltage (2021–2032)
3.3 Introduction by Charger Architecture
3.3.1 All-in-one Integrated Charger
3.3.2 Split Charger
3.3.3 Global High Power Liquid Cooled DC Charging Pile Sales Value by Charger Architecture
3.3.3.1 Global High Power Liquid Cooled DC Charging Pile Sales Value by Charger Architecture (2021 vs 2025 vs 2032)
3.3.3.2 Global High Power Liquid Cooled DC Charging Pile Sales Value, by Charger Architecture (2021–2032)
3.3.3.3 Global High Power Liquid Cooled DC Charging Pile Sales Value, by Charger Architecture (%), 2021–2032
3.3.4 Global High Power Liquid Cooled DC Charging Pile Sales Volume by Charger Architecture
3.3.4.1 Global High Power Liquid Cooled DC Charging Pile Sales Volume by Charger Architecture (2021 vs 2025 vs 2032)
3.3.4.2 Global High Power Liquid Cooled DC Charging Pile Sales Volume, by Charger Architecture (2021–2032)
3.3.4.3 Global High Power Liquid Cooled DC Charging Pile Sales Volume, by Charger Architecture (%), 2021–2032
3.3.5 Global High Power Liquid Cooled DC Charging Pile Average Price by Charger Architecture (2021–2032)
4 Segmentation by Application
4.1 Introduction by Application
4.1.1 Expressway Service Area
4.1.2 Shopping Center
4.1.3 Parking Lot
4.1.4 Other
4.2 Global High Power Liquid Cooled DC Charging Pile Sales Value by Application
4.2.1 Global High Power Liquid Cooled DC Charging Pile Sales Value by Application (2021 vs 2025 vs 2032)
4.2.2 Global High Power Liquid Cooled DC Charging Pile Sales Value, by Application (2021–2032)
4.2.3 Global High Power Liquid Cooled DC Charging Pile Sales Value, by Application (%), 2021–2032
4.3 Global High Power Liquid Cooled DC Charging Pile Sales Volume by Application
4.3.1 Global High Power Liquid Cooled DC Charging Pile Sales Volume by Application (2021 vs 2025 vs 2032)
4.3.2 Global High Power Liquid Cooled DC Charging Pile Sales Volume, by Application (2021–2032)
4.3.3 Global High Power Liquid Cooled DC Charging Pile Sales Volume, by Application (%), 2021–2032
4.4 Global High Power Liquid Cooled DC Charging Pile Average Price by Application (2021–2032)
5 Segmentation by Region
5.1 Global High Power Liquid Cooled DC Charging Pile Sales Value by Region
5.1.1 Global High Power Liquid Cooled DC Charging Pile Sales Value by Region: 2021 vs 2025 vs 2032
5.1.2 Global High Power Liquid Cooled DC Charging Pile Sales Value by Region (2021–2026)
5.1.3 Global High Power Liquid Cooled DC Charging Pile Sales Value by Region (2027–2032)
5.1.4 Global High Power Liquid Cooled DC Charging Pile Sales Value by Region (%), 2021–2032
5.2 Global High Power Liquid Cooled DC Charging Pile Sales Volume by Region
5.2.1 Global High Power Liquid Cooled DC Charging Pile Sales Volume by Region: 2021 vs 2025 vs 2032
5.2.2 Global High Power Liquid Cooled DC Charging Pile Sales Volume by Region (2021–2026)
5.2.3 Global High Power Liquid Cooled DC Charging Pile Sales Volume by Region (2027–2032)
5.2.4 Global High Power Liquid Cooled DC Charging Pile Sales Volume by Region (%), 2021–2032
5.3 Global High Power Liquid Cooled DC Charging Pile Average Price by Region (2021–2032)
5.4 North America
5.4.1 North America High Power Liquid Cooled DC Charging Pile Sales Value, 2021–2032
5.4.2 North America High Power Liquid Cooled DC Charging Pile Sales Value by Country (%), 2025 vs 2032
5.5 Europe
5.5.1 Europe High Power Liquid Cooled DC Charging Pile Sales Value, 2021–2032
5.5.2 Europe High Power Liquid Cooled DC Charging Pile Sales Value by Country (%), 2025 vs 2032
5.6 Asia Pacific
5.6.1 Asia Pacific High Power Liquid Cooled DC Charging Pile Sales Value, 2021–2032
5.6.2 Asia Pacific High Power Liquid Cooled DC Charging Pile Sales Value by Region (%), 2025 vs 2032
5.7 South America
5.7.1 South America High Power Liquid Cooled DC Charging Pile Sales Value, 2021–2032
5.7.2 South America High Power Liquid Cooled DC Charging Pile Sales Value by Country (%), 2025 vs 2032
5.8 Middle East & Africa
5.8.1 Middle East & Africa High Power Liquid Cooled DC Charging Pile Sales Value, 2021–2032
5.8.2 Middle East & Africa High Power Liquid Cooled DC Charging Pile Sales Value by Country (%), 2025 vs 2032
6 Segmentation by Key Countries/Regions
6.1 Key Countries/Regions High Power Liquid Cooled DC Charging Pile Sales Value Growth Trends, 2021 vs 2025 vs 2032
6.2 Key Countries/Regions High Power Liquid Cooled DC Charging Pile Sales Value and Sales Volume
6.2.1 Key Countries/Regions High Power Liquid Cooled DC Charging Pile Sales Value, 2021–2032
6.2.2 Key Countries/Regions High Power Liquid Cooled DC Charging Pile Sales Volume, 2021–2032
6.3 United States
6.3.1 United States High Power Liquid Cooled DC Charging Pile Sales Value, 2021–2032
6.3.2 United States High Power Liquid Cooled DC Charging Pile Sales Value by Type (%), 2025 vs 2032
6.3.3 United States High Power Liquid Cooled DC Charging Pile Sales Value by Application, 2025 vs 2032
6.4 Europe
6.4.1 Europe High Power Liquid Cooled DC Charging Pile Sales Value, 2021–2032
6.4.2 Europe High Power Liquid Cooled DC Charging Pile Sales Value by Type (%), 2025 vs 2032
6.4.3 Europe High Power Liquid Cooled DC Charging Pile Sales Value by Application, 2025 vs 2032
6.5 China
6.5.1 China High Power Liquid Cooled DC Charging Pile Sales Value, 2021–2032
6.5.2 China High Power Liquid Cooled DC Charging Pile Sales Value by Type (%), 2025 vs 2032
6.5.3 China High Power Liquid Cooled DC Charging Pile Sales Value by Application, 2025 vs 2032
6.6 Japan
6.6.1 Japan High Power Liquid Cooled DC Charging Pile Sales Value, 2021–2032
6.6.2 Japan High Power Liquid Cooled DC Charging Pile Sales Value by Type (%), 2025 vs 2032
6.6.3 Japan High Power Liquid Cooled DC Charging Pile Sales Value by Application, 2025 vs 2032
6.7 South Korea
6.7.1 South Korea High Power Liquid Cooled DC Charging Pile Sales Value, 2021–2032
6.7.2 South Korea High Power Liquid Cooled DC Charging Pile Sales Value by Type (%), 2025 vs 2032
6.7.3 South Korea High Power Liquid Cooled DC Charging Pile Sales Value by Application, 2025 vs 2032
6.8 Southeast Asia
6.8.1 Southeast Asia High Power Liquid Cooled DC Charging Pile Sales Value, 2021–2032
6.8.2 Southeast Asia High Power Liquid Cooled DC Charging Pile Sales Value by Type (%), 2025 vs 2032
6.8.3 Southeast Asia High Power Liquid Cooled DC Charging Pile Sales Value by Application, 2025 vs 2032
6.9 India
6.9.1 India High Power Liquid Cooled DC Charging Pile Sales Value, 2021–2032
6.9.2 India High Power Liquid Cooled DC Charging Pile Sales Value by Type (%), 2025 vs 2032
6.9.3 India High Power Liquid Cooled DC Charging Pile Sales Value by Application, 2025 vs 2032
7 Company Profiles
7.1 Tesla
7.1.1 Tesla Company Information
7.1.2 Tesla Introduction and Business Overview
7.1.3 Tesla High Power Liquid Cooled DC Charging Pile Sales, Revenue, Price and Gross Margin (2021–2026)
7.1.4 Tesla High Power Liquid Cooled DC Charging Pile Product Offerings
7.1.5 Tesla Recent Developments
7.2 ABB
7.2.1 ABB Company Information
7.2.2 ABB Introduction and Business Overview
7.2.3 ABB High Power Liquid Cooled DC Charging Pile Sales, Revenue, Price and Gross Margin (2021–2026)
7.2.4 ABB High Power Liquid Cooled DC Charging Pile Product Offerings
7.2.5 ABB Recent Developments
7.3 Siemens
7.3.1 Siemens Company Information
7.3.2 Siemens Introduction and Business Overview
7.3.3 Siemens High Power Liquid Cooled DC Charging Pile Sales, Revenue, Price and Gross Margin (2021–2026)
7.3.4 Siemens High Power Liquid Cooled DC Charging Pile Product Offerings
7.3.5 Siemens Recent Developments
7.4 Kempower
7.4.1 Kempower Company Information
7.4.2 Kempower Introduction and Business Overview
7.4.3 Kempower High Power Liquid Cooled DC Charging Pile Sales, Revenue, Price and Gross Margin (2021–2026)
7.4.4 Kempower High Power Liquid Cooled DC Charging Pile Product Offerings
7.4.5 Kempower Recent Developments
7.5 Alpitronic
7.5.1 Alpitronic Company Information
7.5.2 Alpitronic Introduction and Business Overview
7.5.3 Alpitronic High Power Liquid Cooled DC Charging Pile Sales, Revenue, Price and Gross Margin (2021–2026)
7.5.4 Alpitronic High Power Liquid Cooled DC Charging Pile Product Offerings
7.5.5 Alpitronic Recent Developments
7.6 Chargepoint
7.6.1 Chargepoint Company Information
7.6.2 Chargepoint Introduction and Business Overview
7.6.3 Chargepoint High Power Liquid Cooled DC Charging Pile Sales, Revenue, Price and Gross Margin (2021–2026)
7.6.4 Chargepoint High Power Liquid Cooled DC Charging Pile Product Offerings
7.6.5 Chargepoint Recent Developments
7.7 BorgWarner
7.7.1 BorgWarner Company Information
7.7.2 BorgWarner Introduction and Business Overview
7.7.3 BorgWarner High Power Liquid Cooled DC Charging Pile Sales, Revenue, Price and Gross Margin (2021–2026)
7.7.4 BorgWarner High Power Liquid Cooled DC Charging Pile Product Offerings
7.7.5 BorgWarner Recent Developments
7.8 Huawei
7.8.1 Huawei Company Information
7.8.2 Huawei Introduction and Business Overview
7.8.3 Huawei High Power Liquid Cooled DC Charging Pile Sales, Revenue, Price and Gross Margin (2021–2026)
7.8.4 Huawei High Power Liquid Cooled DC Charging Pile Product Offerings
7.8.5 Huawei Recent Developments
7.9 VREMT
7.9.1 VREMT Company Information
7.9.2 VREMT Introduction and Business Overview
7.9.3 VREMT High Power Liquid Cooled DC Charging Pile Sales, Revenue, Price and Gross Margin (2021–2026)
7.9.4 VREMT High Power Liquid Cooled DC Charging Pile Product Offerings
7.9.5 VREMT Recent Developments
7.10 GAC Energy
7.10.1 GAC Energy Company Information
7.10.2 GAC Energy Introduction and Business Overview
7.10.3 GAC Energy High Power Liquid Cooled DC Charging Pile Sales, Revenue, Price and Gross Margin (2021–2026)
7.10.4 GAC Energy High Power Liquid Cooled DC Charging Pile Product Offerings
7.10.5 GAC Energy Recent Developments
7.11 StarCharge
7.11.1 StarCharge Company Information
7.11.2 StarCharge Introduction and Business Overview
7.11.3 StarCharge High Power Liquid Cooled DC Charging Pile Sales, Revenue, Price and Gross Margin (2021–2026)
7.11.4 StarCharge High Power Liquid Cooled DC Charging Pile Product Offerings
7.11.5 StarCharge Recent Developments
7.12 Infypower
7.12.1 Infypower Company Information
7.12.2 Infypower Introduction and Business Overview
7.12.3 Infypower High Power Liquid Cooled DC Charging Pile Sales, Revenue, Price and Gross Margin (2021–2026)
7.12.4 Infypower High Power Liquid Cooled DC Charging Pile Product Offerings
7.12.5 Infypower Recent Developments
7.13 Xuji Group
7.13.1 Xuji Group Company Information
7.13.2 Xuji Group Introduction and Business Overview
7.13.3 Xuji Group High Power Liquid Cooled DC Charging Pile Sales, Revenue, Price and Gross Margin (2021–2026)
7.13.4 Xuji Group High Power Liquid Cooled DC Charging Pile Product Offerings
7.13.5 Xuji Group Recent Developments
8 Industry Chain Analysis
8.1 High Power Liquid Cooled DC Charging Pile Industrial Chain
8.2 High Power Liquid Cooled DC Charging Pile Upstream Analysis
8.2.1 Key Raw Materials
8.2.2 Key Suppliers of Raw Materials
8.2.3 Manufacturing Cost Structure
8.3 Midstream Analysis
8.4 Downstream Analysis (Customer Analysis)
8.5 Sales Model and Sales Channelss
8.5.1 High Power Liquid Cooled DC Charging Pile Sales Model
8.5.2 Sales Channels
8.5.3 High Power Liquid Cooled DC Charging Pile Distributors
9 Research Findings and Conclusion
10 Appendix
10.1 Research Methodology
10.1.1 Methodology/Research Approach
10.1.1.1 Research Programs/Design
10.1.1.2 Market Size Estimation
10.1.1.3 Market Breakdown and Data Triangulation
10.1.2 Data Source
10.1.2.1 Secondary Sources
10.1.2.2 Primary Sources
10.2 Author Details
10.3 Disclaimer
List of Tables
 Table 1. High Power Liquid Cooled DC Charging Pile Market Trends
 Table 2. High Power Liquid Cooled DC Charging Pile Market Drivers & Opportunities
 Table 3. High Power Liquid Cooled DC Charging Pile Market Challenges
 Table 4. High Power Liquid Cooled DC Charging Pile Market Restraints


List of Figures
 Figure 1. High Power Liquid Cooled DC Charging Pile Product Picture
 Figure 2. Global High Power Liquid Cooled DC Charging Pile Sales Value, 2021 vs 2025 vs 2032 (US$ Million)
 Figure 3. Global High Power Liquid Cooled DC Charging Pile Sales Value (US$ Million), 2021–2032
 Figure 4. Global High Power Liquid Cooled DC Charging Pile Sales Volume (Units), 2021–2032
 Figure 5. Global High Power Liquid Cooled DC Charging Pile Sales Price (US$/K Unit), 2021–2032
 Figure 6. High Power Liquid Cooled DC Charging Pile Report Years Considered
 Figure 7. Global High Power Liquid Cooled DC Charging Pile Players Revenue Ranking (US$ Million), 2025
 Figure 8. Global High Power Liquid Cooled DC Charging Pile Sales Volume Ranking of Players (Units), 2025
 Figure 9. The 5 and 10 Largest Manufacturers in the World: Market Share by High Power Liquid Cooled DC Charging Pile Revenue in 2025
 Figure 10. High Power Liquid Cooled DC Charging Pile Market Share by Company Type (Tier 1, Tier 2, and Tier 3): 2021 vs 2025
 Figure 11. <360kW Picture
 Figure 12. ≥360kW Picture
 Figure 13. Global High Power Liquid Cooled DC Charging Pile Sales Value by Type (US$ Million), 2021 vs 2025 vs 2032
 Figure 14. Global High Power Liquid Cooled DC Charging Pile Sales Value Market Share by Type, 2025 & 2032
 Figure 15. Global High Power Liquid Cooled DC Charging Pile Sales Volume by Type (Units), 2021 vs 2025 vs 2032
 Figure 16. Global High Power Liquid Cooled DC Charging Pile Sales Volume Market Share by Type, 2025 & 2032
 Figure 17. Global High Power Liquid Cooled DC Charging Pile Price by Type (US$/K Unit), 2021–2032
 Figure 18. <800V Picture
 Figure 19. ≥800V Picture
 Figure 20. Global High Power Liquid Cooled DC Charging Pile Sales Value by Maximum DC Output Voltage (US$ Million), 2021 vs 2025 vs 2032
 Figure 21. Global High Power Liquid Cooled DC Charging Pile Sales Value Market Share by Maximum DC Output Voltage, 2025 & 2032
 Figure 22. Global High Power Liquid Cooled DC Charging Pile Sales Volume by Maximum DC Output Voltage (Units), 2021 vs 2025 vs 2032
 Figure 23. Global High Power Liquid Cooled DC Charging Pile Sales Volume Market Share by Maximum DC Output Voltage, 2025 & 2032
 Figure 24. Global High Power Liquid Cooled DC Charging Pile Price by Maximum DC Output Voltage (US$/K Unit), 2021–2032
 Figure 25. All-in-one Integrated Charger Picture
 Figure 26. Split Charger Picture
 Figure 27. Global High Power Liquid Cooled DC Charging Pile Sales Value by Charger Architecture (US$ Million), 2021 vs 2025 vs 2032
 Figure 28. Global High Power Liquid Cooled DC Charging Pile Sales Value Market Share by Charger Architecture, 2025 & 2032
 Figure 29. Global High Power Liquid Cooled DC Charging Pile Sales Volume by Charger Architecture (Units), 2021 vs 2025 vs 2032
 Figure 30. Global High Power Liquid Cooled DC Charging Pile Sales Volume Market Share by Charger Architecture, 2025 & 2032
 Figure 31. Global High Power Liquid Cooled DC Charging Pile Price by Charger Architecture (US$/K Unit), 2021–2032
 Figure 32. Product Picture of Expressway Service Area
 Figure 33. Product Picture of Shopping Center
 Figure 34. Product Picture of Parking Lot
 Figure 35. Product Picture of Other
 Figure 36. Global High Power Liquid Cooled DC Charging Pile Sales Value by Application (US$ Million), 2021 vs 2025 vs 2032
 Figure 37. Global High Power Liquid Cooled DC Charging Pile Sales Value Market Share by Application, 2025 & 2032
 Figure 38. Global High Power Liquid Cooled DC Charging Pile Sales Volume by Application (Units), 2021 vs 2025 vs 2032
 Figure 39. Global High Power Liquid Cooled DC Charging Pile Sales Volume Market Share by Application, 2025 & 2032
 Figure 40. Global High Power Liquid Cooled DC Charging Pile Price by Application (US$/K Unit), 2021–2032
 Figure 41. North America High Power Liquid Cooled DC Charging Pile Sales Value (US$ Million), 2021–2032
 Figure 42. North America High Power Liquid Cooled DC Charging Pile Sales Value by Country (%), 2025 vs 2032
 Figure 43. Europe High Power Liquid Cooled DC Charging Pile Sales Value (US$ Million), 2021–2032
 Figure 44. Europe High Power Liquid Cooled DC Charging Pile Sales Value by Country (%), 2025 vs 2032
 Figure 45. Asia Pacific High Power Liquid Cooled DC Charging Pile Sales Value (US$ Million), 2021–2032
 Figure 46. Asia Pacific High Power Liquid Cooled DC Charging Pile Sales Value by Region (%), 2025 vs 2032
 Figure 47. South America High Power Liquid Cooled DC Charging Pile Sales Value (US$ Million), 2021–2032
 Figure 48. South America High Power Liquid Cooled DC Charging Pile Sales Value by Country (%), 2025 vs 2032
 Figure 49. Middle East & Africa High Power Liquid Cooled DC Charging Pile Sales Value (US$ Million), 2021–2032
 Figure 50. Middle East & Africa High Power Liquid Cooled DC Charging Pile Sales Value by Country (%), 2025 vs 2032
 Figure 51. Key Countries/Regions High Power Liquid Cooled DC Charging Pile Sales Value (%), 2021–2032
 Figure 52. Key Countries/Regions High Power Liquid Cooled DC Charging Pile Sales Volume (%), 2021–2032
 Figure 53. United States High Power Liquid Cooled DC Charging Pile Sales Value (US$ Million), 2021–2032
 Figure 54. United States High Power Liquid Cooled DC Charging Pile Sales Value by Type (%), 2025 vs 2032
 Figure 55. United States High Power Liquid Cooled DC Charging Pile Sales Value by Application (%), 2025 vs 2032
 Figure 56. Europe High Power Liquid Cooled DC Charging Pile Sales Value (US$ Million), 2021–2032
 Figure 57. Europe High Power Liquid Cooled DC Charging Pile Sales Value by Type (%), 2025 vs 2032
 Figure 58. Europe High Power Liquid Cooled DC Charging Pile Sales Value by Application (%), 2025 vs 2032
 Figure 59. China High Power Liquid Cooled DC Charging Pile Sales Value (US$ Million), 2021–2032
 Figure 60. China High Power Liquid Cooled DC Charging Pile Sales Value by Type (%), 2025 vs 2032
 Figure 61. China High Power Liquid Cooled DC Charging Pile Sales Value by Application (%), 2025 vs 2032
 Figure 62. Japan High Power Liquid Cooled DC Charging Pile Sales Value (US$ Million), 2021–2032
 Figure 63. Japan High Power Liquid Cooled DC Charging Pile Sales Value by Type (%), 2025 vs 2032
 Figure 64. Japan High Power Liquid Cooled DC Charging Pile Sales Value by Application (%), 2025 vs 2032
 Figure 65. South Korea High Power Liquid Cooled DC Charging Pile Sales Value (US$ Million), 2021–2032
 Figure 66. South Korea High Power Liquid Cooled DC Charging Pile Sales Value by Type (%), 2025 vs 2032
 Figure 67. South Korea High Power Liquid Cooled DC Charging Pile Sales Value by Application (%), 2025 vs 2032
 Figure 68. Southeast Asia High Power Liquid Cooled DC Charging Pile Sales Value (US$ Million), 2021–2032
 Figure 69. Southeast Asia High Power Liquid Cooled DC Charging Pile Sales Value by Type (%), 2025 vs 2032
 Figure 70. Southeast Asia High Power Liquid Cooled DC Charging Pile Sales Value by Application (%), 2025 vs 2032
 Figure 71. India High Power Liquid Cooled DC Charging Pile Sales Value (US$ Million), 2021–2032
 Figure 72. India High Power Liquid Cooled DC Charging Pile Sales Value by Type (%), 2025 vs 2032
 Figure 73. India High Power Liquid Cooled DC Charging Pile Sales Value by Application (%), 2025 vs 2032
 Figure 74. High Power Liquid Cooled DC Charging Pile Industrial Chain
 Figure 75. High Power Liquid Cooled DC Charging Pile Manufacturing Cost Structure
 Figure 76. Channels of Distribution (Direct Sales, and Distribution)
 Figure 77. Bottom-up and Top-down Approaches for This Report
 Figure 78. Data Triangulation
 Figure 79. Key Executives Interviewed
SELECT A FORMAT
Added to Cart
Electronic

$3950

Single User License
Electronic

$5925

Multi User License
Electronic

$7900

Enterprise License
Add to Cart
Buy Now (15% Discount)

OUR CUSTOMER

SIS Group of Schools