0
U.S. (TOLL FREE)
+1 (315) 215-3225
Automative

0
U.S. (TOLL FREE)
+1 (315) 215-3225
Global Through Glass Via (TGV) Technology Market Research Report 2025
Published Date: April 2025
|
Report Code: QYRE-Auto-31E8985
Home | Market Reports | Business & Industrial| Chemicals Industry
Global Through Glass Via TGV Technology Market Size Status and Forecast 2022
BUY CHAPTERS

Global Through Glass Via (TGV) Technology Market Research Report 2025

Code: QYRE-Auto-31E8985
Report
April 2025
Pages:72
QYResearch
Buy Now with 15% Discount
DESCRIPTION
TABLE OF CONTENT
TABLES & FIGURES

Through Glass Via (TGV) Technology Market Size

The global market for Through Glass Via (TGV) Technology was valued at US$ 129 million in the year 2024 and is projected to reach a revised size of US$ 508 million by 2031, growing at a CAGR of 22.0% during the forecast period.

Through Glass Via (TGV) Technology Market

Through Glass Via (TGV) Technology Market

Glass Through-Via (TGV, short for Through-Glass Via) is a miniaturization packaging technology used in semiconductor encapsulation and microelectronic devices. The TGV process enables the creation of precise through-holes (i.e., vias) in glass substrates, which are subsequently filled with conductive materials (such as metals) in subsequent processes. TGV features numerous through-holes in glass with diameters measured in micrometers, positioning it as a promising material for the next-generation semiconductor packaging substrates. High-quality TGV achieved through glass materials and hole processing technologies facilitates the miniaturization of devices in various markets, including data centers, 5G communication networks, and IoT devices, enabling high-density packaging and GHz-speed data processing.
Through-Glass Vias (TGV) represent an advanced three-dimensional integrated circuit technology, enabling device miniaturization across various sectors such as data centers, 5G communication networks, and IoT devices, in addition to facilitating high-density packaging and GHz-speed data processing. Glass emerges as a potential alternative to silicon interposers, with TGV offering advantages over Silicon Through-Vias (TSVs), including lower costs, ready availability of large-sized ultrathin glass substrates, and superior high-frequency electrical performance. Core to TGV technology lies in the deep hole formation process, with techniques like plasma etching and laser ablation having been developed for glass hole-making. Nonetheless, the fragility, smooth surface, and chemical inertness of glass materials currently hinder the mass production and widespread application of TGVs.
From a regional perspective, the Chinese market has witnessed rapid changes in recent years. In 2023, its market size stood at USD 17.86 million, constituting approximately 17.76% of the global total. By 2030, it is anticipated to reach USD 110.12 million, accounting for 25.97% of the global market. As the leading country in 5G network construction and a major producer of downstream 5G terminal equipment, China's TGV market growth surpasses the global average. Prospects for the TGV market are vast, poised for expansion with technological advancements and cost reductions.
The TGV substrate market landscape is highly concentrated, with foreign manufacturers dominating testing products and technologies. Key players include Corning, LPKF, Samtec, KISO WAVE Co., Ltd., and Tecnisco. Corning leads the global TGV substrate industry with a 24.67% market share in 2023, followed by LPKF at 22.37%, and Samtec at 9.67%. Chinese enterprises such as Xiamen Sky Semiconductor have made progress, with the former already supplying substantial quantities. However, this does not signify a clear path for Chinese companies in the TGV realm. Their future development remains to be tested by the market.
This report aims to provide a comprehensive presentation of the global market for Through Glass Via (TGV) Technology, with both quantitative and qualitative analysis, to help readers develop business/growth strategies, assess the market competitive situation, analyze their position in the current marketplace, and make informed business decisions regarding Through Glass Via (TGV) Technology.
The Through Glass Via (TGV) Technology market size, estimations, and forecasts are provided in terms of and revenue ($ millions), considering 2024 as the base year, with history and forecast data for the period from 2020 to 2031. This report segments the global Through Glass Via (TGV) Technology market comprehensively. Regional market sizes, concerning products by Type, by Application, and by players, are also provided.
For a more in-depth understanding of the market, the report provides profiles of the competitive landscape, key competitors, and their respective market ranks. The report also discusses technological trends and new product developments.
The report will help the Through Glass Via (TGV) Technology companies, new entrants, and industry chain related companies in this market with information on the revenues for the overall market and the sub-segments across the different segments, by company, by Type, by Application, and by regions.
Market Segmentation

Scope of Through Glass Via (TGV) Technology Market Report

Report Metric Details
Report Name Through Glass Via (TGV) Technology Market
Accounted market size in year US$ 129 million
Forecasted market size in 2031 US$ 508 million
CAGR 22.0%
Base Year year
Forecasted years 2025 - 2031
Segment by Type
  • 300 mm
  • 200 mm
  • Less Than 150 mm
Segment by Application
  • Consumer Electronics
  • Automobile Industry
  • Others
By Region
  • North America (United States, Canada)
  • Europe (Germany, France, UK, Italy, Russia) Rest of Europe
  • Nordic Countries
  • Asia-Pacific (China, Japan, South Korea)
  • Southeast Asia (India, Australia)
  • Rest of Asia
  • Latin America (Mexico, Brazil)
  • Rest of Latin America
  • Middle East & Africa (Turkey, Saudi Arabia, UAE, Rest of MEA)
By Company Corning, LPKF, Samtec, KISO WAVE Co., Ltd., Xiamen Sky Semiconductor, Tecnisco, Microplex, Plan Optik, NSG Group, Allvia
Forecast units USD million in value
Report coverage Revenue and volume forecast, company share, competitive landscape, growth factors and trends

Chapter Outline

  • Chapter 1: Introduces the report scope of the report, executive summary of different market segments (by Type, by Application, etc), including the market size of each market segment, future development potential, and so on. It offers a high-level view of the current state of the market and its likely evolution in the short to mid-term, and long term.
  • Chapter 2: Introduces executive summary of global market size, regional market size, this section also introduces the market dynamics, latest developments of the market, the driving factors and restrictive factors of the market, the challenges and risks faced by companies in the industry, and the analysis of relevant policies in the industry.
  • Chapter 3: Detailed analysis of Through Glass Via (TGV) Technology company competitive landscape, revenue market share, latest development plan, merger, and acquisition information, etc.
  • Chapter 4: Provides the analysis of various market segments by Type, covering the market size and development potential of each market segment, to help readers find the blue ocean market in different market segments.
  • Chapter 5: Provides the analysis of various market segments by Application, covering the market size and development potential of each market segment, to help readers find the blue ocean market in different downstream markets.
  • Chapter 6, 7, 8, 9, 10: North America, Europe, Asia Pacific, Latin America, Middle East and Africa segment by country. It provides a quantitative analysis of the market size and development potential of each region and its main countries and introduces the market development, future development prospects, market space, and capacity of each country in the world.
  • Chapter 11: Provides profiles of key players, introducing the basic situation of the main companies in the market in detail, including product sales, revenue, price, gross margin, product introduction, recent development, etc.
  • Chapter 12: The main points and conclusions of the report.

FAQ for this report

How fast is Through Glass Via (TGV) Technology Market growing?

Ans: The Through Glass Via (TGV) Technology Market witnessing a CAGR of 22.0% during the forecast period 2025-2031.

What is the Through Glass Via (TGV) Technology Market size in 2031?

Ans: The Through Glass Via (TGV) Technology Market size in 2031 will be US$ 508 million.

What is the Corning share in Through Glass Via (TGV) Technology Market?

Ans: Corning leads the global TGV substrate industry with a 24.67% market share in 2023, followed by LPKF at 22.37%, and Samtec at 9.67%.

Who are the main players in the Through Glass Via (TGV) Technology Market report?

Ans: The main players in the Through Glass Via (TGV) Technology Market are Corning, LPKF, Samtec, KISO WAVE Co., Ltd., Xiamen Sky Semiconductor, Tecnisco, Microplex, Plan Optik, NSG Group, Allvia

What are the Application segmentation covered in the Through Glass Via (TGV) Technology Market report?

Ans: The Applications covered in the Through Glass Via (TGV) Technology Market report are Consumer Electronics, Automobile Industry, Others

What are the Type segmentation covered in the Through Glass Via (TGV) Technology Market report?

Ans: The Types covered in the Through Glass Via (TGV) Technology Market report are 300 mm, 200 mm, Less Than 150 mm

Recommended Reports

TGV Equipment & Process

Glass Via Technology

TSV and 3D IC

1 Report Overview
1.1 Study Scope
1.2 Market Analysis by Type
1.2.1 Global Through Glass Via (TGV) Technology Market Size Growth Rate by Type: 2020 VS 2024 VS 2031
1.2.2 300 mm
1.2.3 200 mm
1.2.4 Less Than 150 mm
1.3 Market by Application
1.3.1 Global Through Glass Via (TGV) Technology Market Growth by Application: 2020 VS 2024 VS 2031
1.3.2 Consumer Electronics
1.3.3 Automobile Industry
1.3.4 Others
1.4 Assumptions and Limitations
1.5 Study Objectives
1.6 Years Considered
2 Global Growth Trends
2.1 Global Through Glass Via (TGV) Technology Market Perspective (2020-2031)
2.2 Global Through Glass Via (TGV) Technology Growth Trends by Region
2.2.1 Global Through Glass Via (TGV) Technology Market Size by Region: 2020 VS 2024 VS 2031
2.2.2 Through Glass Via (TGV) Technology Historic Market Size by Region (2020-2025)
2.2.3 Through Glass Via (TGV) Technology Forecasted Market Size by Region (2026-2031)
2.3 Through Glass Via (TGV) Technology Market Dynamics
2.3.1 Through Glass Via (TGV) Technology Industry Trends
2.3.2 Through Glass Via (TGV) Technology Market Drivers
2.3.3 Through Glass Via (TGV) Technology Market Challenges
2.3.4 Through Glass Via (TGV) Technology Market Restraints
3 Competition Landscape by Key Players
3.1 Global Top Through Glass Via (TGV) Technology Players by Revenue
3.1.1 Global Top Through Glass Via (TGV) Technology Players by Revenue (2020-2025)
3.1.2 Global Through Glass Via (TGV) Technology Revenue Market Share by Players (2020-2025)
3.2 Global Through Glass Via (TGV) Technology Market Share by Company Type (Tier 1, Tier 2, and Tier 3)
3.3 Global Key Players Ranking by Through Glass Via (TGV) Technology Revenue
3.4 Global Through Glass Via (TGV) Technology Market Concentration Ratio
3.4.1 Global Through Glass Via (TGV) Technology Market Concentration Ratio (CR5 and HHI)
3.4.2 Global Top 10 and Top 5 Companies by Through Glass Via (TGV) Technology Revenue in 2024
3.5 Global Key Players of Through Glass Via (TGV) Technology Head office and Area Served
3.6 Global Key Players of Through Glass Via (TGV) Technology, Product and Application
3.7 Global Key Players of Through Glass Via (TGV) Technology, Date of Enter into This Industry
3.8 Mergers & Acquisitions, Expansion Plans
4 Through Glass Via (TGV) Technology Breakdown Data by Type
4.1 Global Through Glass Via (TGV) Technology Historic Market Size by Type (2020-2025)
4.2 Global Through Glass Via (TGV) Technology Forecasted Market Size by Type (2026-2031)
5 Through Glass Via (TGV) Technology Breakdown Data by Application
5.1 Global Through Glass Via (TGV) Technology Historic Market Size by Application (2020-2025)
5.2 Global Through Glass Via (TGV) Technology Forecasted Market Size by Application (2026-2031)
6 North America
6.1 North America Through Glass Via (TGV) Technology Market Size (2020-2031)
6.2 North America Through Glass Via (TGV) Technology Market Growth Rate by Country: 2020 VS 2024 VS 2031
6.3 North America Through Glass Via (TGV) Technology Market Size by Country (2020-2025)
6.4 North America Through Glass Via (TGV) Technology Market Size by Country (2026-2031)
6.5 United States
6.6 Canada
7 Europe
7.1 Europe Through Glass Via (TGV) Technology Market Size (2020-2031)
7.2 Europe Through Glass Via (TGV) Technology Market Growth Rate by Country: 2020 VS 2024 VS 2031
7.3 Europe Through Glass Via (TGV) Technology Market Size by Country (2020-2025)
7.4 Europe Through Glass Via (TGV) Technology Market Size by Country (2026-2031)
7.5 Germany
7.6 France
7.7 U.K.
7.8 Italy
7.9 Russia
7.10 Nordic Countries
8 Asia-Pacific
8.1 Asia-Pacific Through Glass Via (TGV) Technology Market Size (2020-2031)
8.2 Asia-Pacific Through Glass Via (TGV) Technology Market Growth Rate by Region: 2020 VS 2024 VS 2031
8.3 Asia-Pacific Through Glass Via (TGV) Technology Market Size by Region (2020-2025)
8.4 Asia-Pacific Through Glass Via (TGV) Technology Market Size by Region (2026-2031)
8.5 China
8.6 Japan
8.7 South Korea
8.8 Southeast Asia
8.9 India
8.10 Australia
9 Latin America
9.1 Latin America Through Glass Via (TGV) Technology Market Size (2020-2031)
9.2 Latin America Through Glass Via (TGV) Technology Market Growth Rate by Country: 2020 VS 2024 VS 2031
9.3 Latin America Through Glass Via (TGV) Technology Market Size by Country (2020-2025)
9.4 Latin America Through Glass Via (TGV) Technology Market Size by Country (2026-2031)
9.5 Mexico
9.6 Brazil
10 Middle East & Africa
10.1 Middle East & Africa Through Glass Via (TGV) Technology Market Size (2020-2031)
10.2 Middle East & Africa Through Glass Via (TGV) Technology Market Growth Rate by Country: 2020 VS 2024 VS 2031
10.3 Middle East & Africa Through Glass Via (TGV) Technology Market Size by Country (2020-2025)
10.4 Middle East & Africa Through Glass Via (TGV) Technology Market Size by Country (2026-2031)
10.5 Turkey
10.6 Saudi Arabia
10.7 UAE
11 Key Players Profiles
11.1 Corning
11.1.1 Corning Company Details
11.1.2 Corning Business Overview
11.1.3 Corning Through Glass Via (TGV) Technology Introduction
11.1.4 Corning Revenue in Through Glass Via (TGV) Technology Business (2020-2025)
11.1.5 Corning Recent Development
11.2 LPKF
11.2.1 LPKF Company Details
11.2.2 LPKF Business Overview
11.2.3 LPKF Through Glass Via (TGV) Technology Introduction
11.2.4 LPKF Revenue in Through Glass Via (TGV) Technology Business (2020-2025)
11.2.5 LPKF Recent Development
11.3 Samtec
11.3.1 Samtec Company Details
11.3.2 Samtec Business Overview
11.3.3 Samtec Through Glass Via (TGV) Technology Introduction
11.3.4 Samtec Revenue in Through Glass Via (TGV) Technology Business (2020-2025)
11.3.5 Samtec Recent Development
11.4 KISO WAVE Co., Ltd.
11.4.1 KISO WAVE Co., Ltd. Company Details
11.4.2 KISO WAVE Co., Ltd. Business Overview
11.4.3 KISO WAVE Co., Ltd. Through Glass Via (TGV) Technology Introduction
11.4.4 KISO WAVE Co., Ltd. Revenue in Through Glass Via (TGV) Technology Business (2020-2025)
11.4.5 KISO WAVE Co., Ltd. Recent Development
11.5 Xiamen Sky Semiconductor
11.5.1 Xiamen Sky Semiconductor Company Details
11.5.2 Xiamen Sky Semiconductor Business Overview
11.5.3 Xiamen Sky Semiconductor Through Glass Via (TGV) Technology Introduction
11.5.4 Xiamen Sky Semiconductor Revenue in Through Glass Via (TGV) Technology Business (2020-2025)
11.5.5 Xiamen Sky Semiconductor Recent Development
11.6 Tecnisco
11.6.1 Tecnisco Company Details
11.6.2 Tecnisco Business Overview
11.6.3 Tecnisco Through Glass Via (TGV) Technology Introduction
11.6.4 Tecnisco Revenue in Through Glass Via (TGV) Technology Business (2020-2025)
11.6.5 Tecnisco Recent Development
11.7 Microplex
11.7.1 Microplex Company Details
11.7.2 Microplex Business Overview
11.7.3 Microplex Through Glass Via (TGV) Technology Introduction
11.7.4 Microplex Revenue in Through Glass Via (TGV) Technology Business (2020-2025)
11.7.5 Microplex Recent Development
11.8 Plan Optik
11.8.1 Plan Optik Company Details
11.8.2 Plan Optik Business Overview
11.8.3 Plan Optik Through Glass Via (TGV) Technology Introduction
11.8.4 Plan Optik Revenue in Through Glass Via (TGV) Technology Business (2020-2025)
11.8.5 Plan Optik Recent Development
11.9 NSG Group
11.9.1 NSG Group Company Details
11.9.2 NSG Group Business Overview
11.9.3 NSG Group Through Glass Via (TGV) Technology Introduction
11.9.4 NSG Group Revenue in Through Glass Via (TGV) Technology Business (2020-2025)
11.9.5 NSG Group Recent Development
11.10 Allvia
11.10.1 Allvia Company Details
11.10.2 Allvia Business Overview
11.10.3 Allvia Through Glass Via (TGV) Technology Introduction
11.10.4 Allvia Revenue in Through Glass Via (TGV) Technology Business (2020-2025)
11.10.5 Allvia Recent Development
12 Analyst's Viewpoints/Conclusions
13 Appendix
13.1 Research Methodology
13.1.1 Methodology/Research Approach
13.1.1.1 Research Programs/Design
13.1.1.2 Market Size Estimation
13.1.1.3 Market Breakdown and Data Triangulation
13.1.2 Data Source
13.1.2.1 Secondary Sources
13.1.2.2 Primary Sources
13.2 Author Details
13.3 Disclaimer
List of Tables
 Table 1. Global Through Glass Via (TGV) Technology Market Size Growth Rate by Type (US$ Million): 2020 VS 2024 VS 2031
 Table 2. Key Players of 300 mm
 Table 3. Key Players of 200 mm
 Table 4. Key Players of Less Than 150 mm
 Table 5. Global Through Glass Via (TGV) Technology Market Size Growth by Application (US$ Million): 2020 VS 2024 VS 2031
 Table 6. Global Through Glass Via (TGV) Technology Market Size by Region (US$ Million): 2020 VS 2024 VS 2031
 Table 7. Global Through Glass Via (TGV) Technology Market Size by Region (2020-2025) & (US$ Million)
 Table 8. Global Through Glass Via (TGV) Technology Market Share by Region (2020-2025)
 Table 9. Global Through Glass Via (TGV) Technology Forecasted Market Size by Region (2026-2031) & (US$ Million)
 Table 10. Global Through Glass Via (TGV) Technology Market Share by Region (2026-2031)
 Table 11. Through Glass Via (TGV) Technology Market Trends
 Table 12. Through Glass Via (TGV) Technology Market Drivers
 Table 13. Through Glass Via (TGV) Technology Market Challenges
 Table 14. Through Glass Via (TGV) Technology Market Restraints
 Table 15. Global Through Glass Via (TGV) Technology Revenue by Players (2020-2025) & (US$ Million)
 Table 16. Global Through Glass Via (TGV) Technology Market Share by Players (2020-2025)
 Table 17. Global Top Through Glass Via (TGV) Technology Players by Company Type (Tier 1, Tier 2, and Tier 3) & (based on the Revenue in Through Glass Via (TGV) Technology as of 2024)
 Table 18. Ranking of Global Top Through Glass Via (TGV) Technology Companies by Revenue (US$ Million) in 2024
 Table 19. Global 5 Largest Players Market Share by Through Glass Via (TGV) Technology Revenue (CR5 and HHI) & (2020-2025)
 Table 20. Global Key Players of Through Glass Via (TGV) Technology, Headquarters and Area Served
 Table 21. Global Key Players of Through Glass Via (TGV) Technology, Product and Application
 Table 22. Global Key Players of Through Glass Via (TGV) Technology, Date of Enter into This Industry
 Table 23. Mergers & Acquisitions, Expansion Plans
 Table 24. Global Through Glass Via (TGV) Technology Market Size by Type (2020-2025) & (US$ Million)
 Table 25. Global Through Glass Via (TGV) Technology Revenue Market Share by Type (2020-2025)
 Table 26. Global Through Glass Via (TGV) Technology Forecasted Market Size by Type (2026-2031) & (US$ Million)
 Table 27. Global Through Glass Via (TGV) Technology Revenue Market Share by Type (2026-2031)
 Table 28. Global Through Glass Via (TGV) Technology Market Size by Application (2020-2025) & (US$ Million)
 Table 29. Global Through Glass Via (TGV) Technology Revenue Market Share by Application (2020-2025)
 Table 30. Global Through Glass Via (TGV) Technology Forecasted Market Size by Application (2026-2031) & (US$ Million)
 Table 31. Global Through Glass Via (TGV) Technology Revenue Market Share by Application (2026-2031)
 Table 32. North America Through Glass Via (TGV) Technology Market Size Growth Rate by Country (US$ Million): 2020 VS 2024 VS 2031
 Table 33. North America Through Glass Via (TGV) Technology Market Size by Country (2020-2025) & (US$ Million)
 Table 34. North America Through Glass Via (TGV) Technology Market Size by Country (2026-2031) & (US$ Million)
 Table 35. Europe Through Glass Via (TGV) Technology Market Size Growth Rate by Country (US$ Million): 2020 VS 2024 VS 2031
 Table 36. Europe Through Glass Via (TGV) Technology Market Size by Country (2020-2025) & (US$ Million)
 Table 37. Europe Through Glass Via (TGV) Technology Market Size by Country (2026-2031) & (US$ Million)
 Table 38. Asia-Pacific Through Glass Via (TGV) Technology Market Size Growth Rate by Region (US$ Million): 2020 VS 2024 VS 2031
 Table 39. Asia-Pacific Through Glass Via (TGV) Technology Market Size by Region (2020-2025) & (US$ Million)
 Table 40. Asia-Pacific Through Glass Via (TGV) Technology Market Size by Region (2026-2031) & (US$ Million)
 Table 41. Latin America Through Glass Via (TGV) Technology Market Size Growth Rate by Country (US$ Million): 2020 VS 2024 VS 2031
 Table 42. Latin America Through Glass Via (TGV) Technology Market Size by Country (2020-2025) & (US$ Million)
 Table 43. Latin America Through Glass Via (TGV) Technology Market Size by Country (2026-2031) & (US$ Million)
 Table 44. Middle East & Africa Through Glass Via (TGV) Technology Market Size Growth Rate by Country (US$ Million): 2020 VS 2024 VS 2031
 Table 45. Middle East & Africa Through Glass Via (TGV) Technology Market Size by Country (2020-2025) & (US$ Million)
 Table 46. Middle East & Africa Through Glass Via (TGV) Technology Market Size by Country (2026-2031) & (US$ Million)
 Table 47. Corning Company Details
 Table 48. Corning Business Overview
 Table 49. Corning Through Glass Via (TGV) Technology Product
 Table 50. Corning Revenue in Through Glass Via (TGV) Technology Business (2020-2025) & (US$ Million)
 Table 51. Corning Recent Development
 Table 52. LPKF Company Details
 Table 53. LPKF Business Overview
 Table 54. LPKF Through Glass Via (TGV) Technology Product
 Table 55. LPKF Revenue in Through Glass Via (TGV) Technology Business (2020-2025) & (US$ Million)
 Table 56. LPKF Recent Development
 Table 57. Samtec Company Details
 Table 58. Samtec Business Overview
 Table 59. Samtec Through Glass Via (TGV) Technology Product
 Table 60. Samtec Revenue in Through Glass Via (TGV) Technology Business (2020-2025) & (US$ Million)
 Table 61. Samtec Recent Development
 Table 62. KISO WAVE Co., Ltd. Company Details
 Table 63. KISO WAVE Co., Ltd. Business Overview
 Table 64. KISO WAVE Co., Ltd. Through Glass Via (TGV) Technology Product
 Table 65. KISO WAVE Co., Ltd. Revenue in Through Glass Via (TGV) Technology Business (2020-2025) & (US$ Million)
 Table 66. KISO WAVE Co., Ltd. Recent Development
 Table 67. Xiamen Sky Semiconductor Company Details
 Table 68. Xiamen Sky Semiconductor Business Overview
 Table 69. Xiamen Sky Semiconductor Through Glass Via (TGV) Technology Product
 Table 70. Xiamen Sky Semiconductor Revenue in Through Glass Via (TGV) Technology Business (2020-2025) & (US$ Million)
 Table 71. Xiamen Sky Semiconductor Recent Development
 Table 72. Tecnisco Company Details
 Table 73. Tecnisco Business Overview
 Table 74. Tecnisco Through Glass Via (TGV) Technology Product
 Table 75. Tecnisco Revenue in Through Glass Via (TGV) Technology Business (2020-2025) & (US$ Million)
 Table 76. Tecnisco Recent Development
 Table 77. Microplex Company Details
 Table 78. Microplex Business Overview
 Table 79. Microplex Through Glass Via (TGV) Technology Product
 Table 80. Microplex Revenue in Through Glass Via (TGV) Technology Business (2020-2025) & (US$ Million)
 Table 81. Microplex Recent Development
 Table 82. Plan Optik Company Details
 Table 83. Plan Optik Business Overview
 Table 84. Plan Optik Through Glass Via (TGV) Technology Product
 Table 85. Plan Optik Revenue in Through Glass Via (TGV) Technology Business (2020-2025) & (US$ Million)
 Table 86. Plan Optik Recent Development
 Table 87. NSG Group Company Details
 Table 88. NSG Group Business Overview
 Table 89. NSG Group Through Glass Via (TGV) Technology Product
 Table 90. NSG Group Revenue in Through Glass Via (TGV) Technology Business (2020-2025) & (US$ Million)
 Table 91. NSG Group Recent Development
 Table 92. Allvia Company Details
 Table 93. Allvia Business Overview
 Table 94. Allvia Through Glass Via (TGV) Technology Product
 Table 95. Allvia Revenue in Through Glass Via (TGV) Technology Business (2020-2025) & (US$ Million)
 Table 96. Allvia Recent Development
 Table 97. Research Programs/Design for This Report
 Table 98. Key Data Information from Secondary Sources
 Table 99. Key Data Information from Primary Sources
 Table 100. Authors List of This Report


List of Figures
 Figure 1. Through Glass Via (TGV) Technology Picture
 Figure 2. Global Through Glass Via (TGV) Technology Market Size Comparison by Type (2020-2031) & (US$ Million)
 Figure 3. Global Through Glass Via (TGV) Technology Market Share by Type: 2024 VS 2031
 Figure 4. 300 mm Features
 Figure 5. 200 mm Features
 Figure 6. Less Than 150 mm Features
 Figure 7. Global Through Glass Via (TGV) Technology Market Size by Application (2020-2031) & (US$ Million)
 Figure 8. Global Through Glass Via (TGV) Technology Market Share by Application: 2024 VS 2031
 Figure 9. Consumer Electronics Case Studies
 Figure 10. Automobile Industry Case Studies
 Figure 11. Others Case Studies
 Figure 12. Through Glass Via (TGV) Technology Report Years Considered
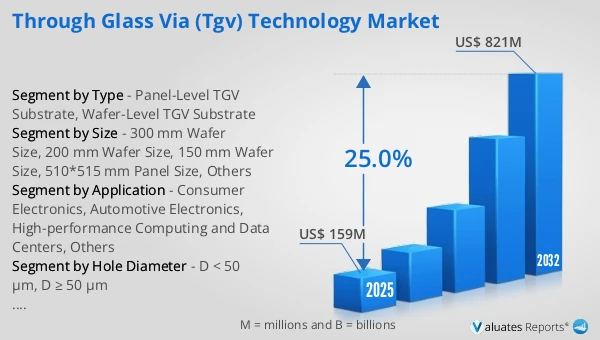
 Figure 13. Global Through Glass Via (TGV) Technology Market Size (US$ Million), Year-over-Year: 2020-2031
 Figure 14. Global Through Glass Via (TGV) Technology Market Size, (US$ Million), 2020 VS 2024 VS 2031
 Figure 15. Global Through Glass Via (TGV) Technology Market Share by Region: 2024 VS 2031
 Figure 16. Global Through Glass Via (TGV) Technology Market Share by Players in 2024
 Figure 17. Global Top Through Glass Via (TGV) Technology Players by Company Type (Tier 1, Tier 2, and Tier 3) & (based on the Revenue in Through Glass Via (TGV) Technology as of 2024)
 Figure 18. The Top 10 and 5 Players Market Share by Through Glass Via (TGV) Technology Revenue in 2024
 Figure 19. North America Through Glass Via (TGV) Technology Market Size YoY Growth (2020-2031) & (US$ Million)
 Figure 20. North America Through Glass Via (TGV) Technology Market Share by Country (2020-2031)
 Figure 21. United States Through Glass Via (TGV) Technology Market Size YoY Growth (2020-2031) & (US$ Million)
 Figure 22. Canada Through Glass Via (TGV) Technology Market Size YoY Growth (2020-2031) & (US$ Million)
 Figure 23. Europe Through Glass Via (TGV) Technology Market Size YoY Growth (2020-2031) & (US$ Million)
 Figure 24. Europe Through Glass Via (TGV) Technology Market Share by Country (2020-2031)
 Figure 25. Germany Through Glass Via (TGV) Technology Market Size YoY Growth (2020-2031) & (US$ Million)
 Figure 26. France Through Glass Via (TGV) Technology Market Size YoY Growth (2020-2031) & (US$ Million)
 Figure 27. U.K. Through Glass Via (TGV) Technology Market Size YoY Growth (2020-2031) & (US$ Million)
 Figure 28. Italy Through Glass Via (TGV) Technology Market Size YoY Growth (2020-2031) & (US$ Million)
 Figure 29. Russia Through Glass Via (TGV) Technology Market Size YoY Growth (2020-2031) & (US$ Million)
 Figure 30. Nordic Countries Through Glass Via (TGV) Technology Market Size YoY Growth (2020-2031) & (US$ Million)
 Figure 31. Asia-Pacific Through Glass Via (TGV) Technology Market Size YoY Growth (2020-2031) & (US$ Million)
 Figure 32. Asia-Pacific Through Glass Via (TGV) Technology Market Share by Region (2020-2031)
 Figure 33. China Through Glass Via (TGV) Technology Market Size YoY Growth (2020-2031) & (US$ Million)
 Figure 34. Japan Through Glass Via (TGV) Technology Market Size YoY Growth (2020-2031) & (US$ Million)
 Figure 35. South Korea Through Glass Via (TGV) Technology Market Size YoY Growth (2020-2031) & (US$ Million)
 Figure 36. Southeast Asia Through Glass Via (TGV) Technology Market Size YoY Growth (2020-2031) & (US$ Million)
 Figure 37. India Through Glass Via (TGV) Technology Market Size YoY Growth (2020-2031) & (US$ Million)
 Figure 38. Australia Through Glass Via (TGV) Technology Market Size YoY Growth (2020-2031) & (US$ Million)
 Figure 39. Latin America Through Glass Via (TGV) Technology Market Size YoY Growth (2020-2031) & (US$ Million)
 Figure 40. Latin America Through Glass Via (TGV) Technology Market Share by Country (2020-2031)
 Figure 41. Mexico Through Glass Via (TGV) Technology Market Size YoY Growth (2020-2031) & (US$ Million)
 Figure 42. Brazil Through Glass Via (TGV) Technology Market Size YoY Growth (2020-2031) & (US$ Million)
 Figure 43. Middle East & Africa Through Glass Via (TGV) Technology Market Size YoY Growth (2020-2031) & (US$ Million)
 Figure 44. Middle East & Africa Through Glass Via (TGV) Technology Market Share by Country (2020-2031)
 Figure 45. Turkey Through Glass Via (TGV) Technology Market Size YoY Growth (2020-2031) & (US$ Million)
 Figure 46. Saudi Arabia Through Glass Via (TGV) Technology Market Size YoY Growth (2020-2031) & (US$ Million)
 Figure 47. UAE Through Glass Via (TGV) Technology Market Size YoY Growth (2020-2031) & (US$ Million)
 Figure 48. Corning Revenue Growth Rate in Through Glass Via (TGV) Technology Business (2020-2025)
 Figure 49. LPKF Revenue Growth Rate in Through Glass Via (TGV) Technology Business (2020-2025)
 Figure 50. Samtec Revenue Growth Rate in Through Glass Via (TGV) Technology Business (2020-2025)
 Figure 51. KISO WAVE Co., Ltd. Revenue Growth Rate in Through Glass Via (TGV) Technology Business (2020-2025)
 Figure 52. Xiamen Sky Semiconductor Revenue Growth Rate in Through Glass Via (TGV) Technology Business (2020-2025)
 Figure 53. Tecnisco Revenue Growth Rate in Through Glass Via (TGV) Technology Business (2020-2025)
 Figure 54. Microplex Revenue Growth Rate in Through Glass Via (TGV) Technology Business (2020-2025)
 Figure 55. Plan Optik Revenue Growth Rate in Through Glass Via (TGV) Technology Business (2020-2025)
 Figure 56. NSG Group Revenue Growth Rate in Through Glass Via (TGV) Technology Business (2020-2025)
 Figure 57. Allvia Revenue Growth Rate in Through Glass Via (TGV) Technology Business (2020-2025)
 Figure 58. Bottom-up and Top-down Approaches for This Report
 Figure 59. Data Triangulation
 Figure 60. Key Executives Interviewed
SELECT A FORMAT
Added to Cart
Electronic (PDF)

$2900

This license allows only one user to access the PDF.
Electronic (PDF)

$4350

This license allows 1 - 5 user to access the PDF, license is suitable for small groups of 5 users working together
Electronic (PDF)

$5800

This license allows users/teams in a same Enterprise to use this report, various departments within an enterpise can use this report
Add to Cart
Buy Now (15% Discount)

OUR CUSTOMER

Accenture

RELATED REPORTS

Global Nano Porous Silicon–carbon Anode Material Market Research Report 2025

120 Pages
Type: Report
Code: QYRE-Auto-0F17509
Fri Sep 12 00:00:00 UTC 2025

Add to Cart

Global Foam Board Market Research Report 2025

120 Pages
Type: Report
Code: QYRE-Auto-16F19834
Fri Sep 12 00:00:00 UTC 2025

Add to Cart

Global Copper Wires Market Research Report 2025

120 Pages
Type: Report
Code: QYRE-Auto-5U6954
Fri Sep 12 00:00:00 UTC 2025

Add to Cart

Global Quartz Fiber Cloth Market Research Report 2025

120 Pages
Type: Report
Code: QYRE-Auto-20G17359
Fri Sep 12 00:00:00 UTC 2025

Add to Cart