FEATURED COMPANIES
JB Hunt
XPO
Schneider
Hub Group
Knight-Swift
Chicago Intermodal Transportation
Ambrogio Trasporti
Nippon Express
Guangzhou Eversail Logistics
Shanghai Tieyang Multimodal Transportation
Intermodal Transportation Service Market Size
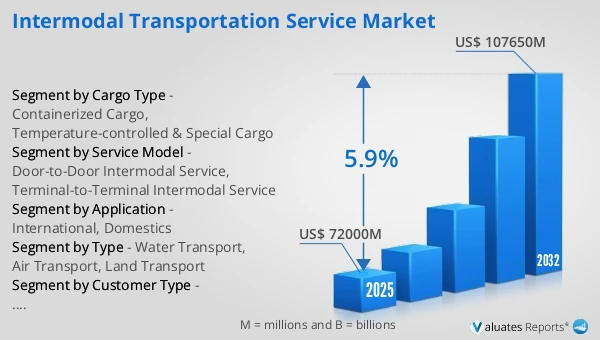
The global Intermodal Transportation Service market was valued at US$ 72000 million in 2025 and is anticipated to reach US$ 107650 million by 2032, at a CAGR of 5.9% from 2026 to 2032.
Intermodal Transportation Service Market
Intermodal transportation services refer to logistics services in which goods are transported using two or more modes of transport—such as truck, rail, and ocean—under a single contract or coordinated logistics arrangement, without handling the cargo itself when changing transport modes. By combining the efficiency and cost advantages of different transport modes, intermodal services enable efficient, reliable, and lower-carbon transportation for bulk and long-distance shipments, and are widely used in industrial, consumer goods, and cross-regional logistics.
From a global perspective, demand for intermodal transportation services continues to grow, driven by expanding cross-regional trade, the need for logistics cost optimization, and policies promoting carbon reduction and sustainable transport. North America and Europe are mature markets with well-established truck–rail intermodal networks and standardized, large-scale operations, while the Asia-Pacific region shows the fastest growth supported by manufacturing concentration, cross-border e-commerce, and improving port and hub capabilities. Overall, the market is evolving toward digitalized scheduling, network-based operations, and lower-carbon transportation models.
This report delivers a comprehensive overview of the global Intermodal Transportation Service market, with both quantitative and qualitative analyses, to help readers develop growth strategies, assess the competitive landscape, evaluate their position in the current market, and make informed business decisions regarding Intermodal Transportation Service. The Intermodal Transportation Service market size, estimates, and forecasts are provided in terms of revenue (US$ millions), with 2025 as the base year and historical and forecast data for 2021–2032.
The report segments the global Intermodal Transportation Service market comprehensively. Regional market sizes by Type, by Application, by Customer Type, and by player are also provided. For deeper insight, the report profiles the competitive landscape, key competitors, and their respective market rankings, and discusses technological trends and new product developments.
This report will assist Intermodal Transportation Service manufacturers, new entrants, and companies across the industry value chain with information on revenues, sales volume, and average prices for the overall market and its sub-segments, by company, by Type, by Application, and by region.
Market Segmentation
Scope of Intermodal Transportation Service Market Report
| Report Metric |
Details |
| Report Name |
Intermodal Transportation Service Market |
| Accounted market size in 2025 |
US$ 72000 million |
| Forecasted market size in 2032 |
US$ 107650 million |
| CAGR |
5.9% |
| Base Year |
2025 |
| Forecasted years |
2026 - 2032 |
| Segment by Type |
- Water Transport
- Air Transport
- Land Transport
|
| Segment by Customer Type |
- Industrial & Bulk Cargo Customers
- Retail & Consumer Goods Customers
|
| Segment by Cargo Type |
- Containerized Cargo
- Temperature-controlled & Special Cargo
|
| Segment by Service Model |
- Door-to-Door Intermodal Service
- Terminal-to-Terminal Intermodal Service
|
| Segment by Application |
|
| By Region |
- North America (United States, Canada)
- Europe (Germany, France, UK, Italy, Russia) Rest of Europe
- Nordic Countries
- Asia-Pacific (China, Japan, South Korea)
- Southeast Asia (India, Australia)
- Rest of Asia
- Latin America (Mexico, Brazil)
- Rest of Latin America
- Middle East & Africa (Turkey, Saudi Arabia, UAE, Rest of MEA)
|
| By Company |
JB Hunt, XPO, Schneider, Hub Group, Knight-Swift, Chicago Intermodal Transportation, Ambrogio Trasporti, Nippon Express, Guangzhou Eversail Logistics, Shanghai Tieyang Multimodal Transportation, Freight Right, Canadian National Railway Company, Hitachi Transport System, Ltd., CLX Logistics, LLC, Lotus Terminals Ltd |
| Forecast units |
USD million in value |
| Report coverage |
Revenue and volume forecast, company share, competitive landscape, growth factors and trends |
Chapter Outline
- Chapter 1: Defines the scope of the report and presents an executive summary of market segments (by Type, by Application, by Customer Type, etc.), including the size of each segment and its future growth potential. It offers a high-level view of the current market and its likely evolution in the short, medium, and long term.
- Chapter 2: Summarizes global and regional market size and outlines market dynamics and recent developments, including key drivers, restraints, challenges and risks for industry participants, and relevant policy analysis.
- Chapter 3: Provides a detailed view of the competitive landscape for Intermodal Transportation Service companies, covering revenue share, development plans, and mergers and acquisitions.
- Chapter 4: Analyzes segments by Type, detailing the size and growth potential of each segment to help readers identify blue-ocean opportunities.
- Chapter 5: Analyzes segments by Application, detailing the size and growth potential of each downstream segment to help readers identify blue-ocean opportunities.
- Chapter 6–10: Regional deep dives (North America, Europe, Asia Pacific, Latin America, Middle East & Africa) broken down by country. Each chapter quantifies market size and growth potential by region and key countries, and outlines market development, outlook, addressable space, and capacity.
- Chapter 11: Profiles key players, presenting essential information on leading companies, including product/ service offerings, revenue, gross margin, product introductions/portfolios, recent developments, etc.
- Chapter 12: Key findings and conclusions of the report.
FAQ for this report
How fast is Intermodal Transportation Service Market growing?
Ans: The Intermodal Transportation Service Market witnessing a CAGR of 5.9% during the forecast period 2026-2032.
What is the Intermodal Transportation Service Market size in 2032?
Ans: The Intermodal Transportation Service Market size in 2032 will be US$ 107650 million.
Who are the main players in the Intermodal Transportation Service Market report?
Ans: The main players in the Intermodal Transportation Service Market are JB Hunt, XPO, Schneider, Hub Group, Knight-Swift, Chicago Intermodal Transportation, Ambrogio Trasporti, Nippon Express, Guangzhou Eversail Logistics, Shanghai Tieyang Multimodal Transportation, Freight Right, Canadian National Railway Company, Hitachi Transport System, Ltd., CLX Logistics, LLC, Lotus Terminals Ltd
What are the Application segmentation covered in the Intermodal Transportation Service Market report?
Ans: The Applications covered in the Intermodal Transportation Service Market report are International, Domestics
What are the Type segmentation covered in the Intermodal Transportation Service Market report?
Ans: The Types covered in the Intermodal Transportation Service Market report are Containerized Cargo, Temperature-controlled & Special Cargo

