List of Tables
Table 1. Global AI Medical Imaging Product Market Size Growth Rate by Type (US$ Million): 2021 vs 2025 vs 2032
Table 2. Key Players of Standalone AI Imaging Software
Table 3. Key Players of AI Imaging Modules / SDKs
Table 4. Key Players of AI-enabled Imaging Systems (Software + Hardware)
Table 5. Key Players of Subscription-based AI Platforms (SaaS)
Table 6. Key Players of Per-scan / Usage-based AI Services
Table 7. Global AI Medical Imaging Product Market Size Growth Rate by Imaging Modality (US$ Million): 2021 vs 2025 vs 2032
Table 8. Key Players of AI for X-ray Imaging
Table 9. Key Players of AI for CT Imaging
Table 10. Key Players of AI for MRI Imaging
Table 11. Key Players of AI for Ultrasound Imaging
Table 12. Key Players of AI for Nuclear Medicine Imaging(PET / SPECT)
Table 13. Global AI Medical Imaging Product Market Size Growth Rate by Clinical Function (US$ Million): 2021 vs 2025 vs 2032
Table 14. Key Players of AI-assisted Detection (CADe)
Table 15. Key Players of AI-assisted Diagnosis (CADx)
Table 16. Key Players of Segmentation & Quantification AI
Table 17. Key Players of Workflow & Triage AI
Table 18. Key Players of Prognosis & Treatment Response Prediction
Table 19. Global AI Medical Imaging Product Market Size Growth by Application (US$ Million): 2021 vs 2025 vs 2032
Table 20. Global AI Medical Imaging Product Market Size by Region (US$ Million): 2021 vs 2025 vs 2032
Table 21. Global AI Medical Imaging Product Market Size by Region (US$ Million), 2021–2026
Table 22. Global AI Medical Imaging Product Market Share by Region (2021–2026)
Table 23. Global AI Medical Imaging Product Forecasted Market Size by Region (US$ Million), 2027–2032
Table 24. Global AI Medical Imaging Product Market Share by Region (2027–2032)
Table 25. AI Medical Imaging Product Market Trends
Table 26. AI Medical Imaging Product Market Drivers
Table 27. AI Medical Imaging Product Market Challenges
Table 28. AI Medical Imaging Product Market Restraints
Table 29. Global AI Medical Imaging Product Revenue by Players (US$ Million), 2021–2026
Table 30. Global AI Medical Imaging Product Market Share by Players (2021–2026)
Table 31. Global Top AI Medical Imaging Product Players by Tier (Tier 1, Tier 2, and Tier 3), based on AI Medical Imaging Product Revenue, 2025
Table 32. Ranking of Global Top AI Medical Imaging Product Companies by Revenue (US$ Million) in 2025
Table 33. Global 5 Largest Players Market Share by AI Medical Imaging Product Revenue (CR5 and HHI), 2021–2026
Table 34. Global Key Players of AI Medical Imaging Product, Headquarters and Area Served
Table 35. Global Key Players of AI Medical Imaging Product, Products and Applications
Table 36. Global Key Players of AI Medical Imaging Product, Date of General Availability (GA)
Table 37. Mergers and Acquisitions, Expansion Plans
Table 38. Global AI Medical Imaging Product Market Size by Type (US$ Million), 2021–2026
Table 39. Global AI Medical Imaging Product Revenue Market Share by Type (2021–2026)
Table 40. Global AI Medical Imaging Product Forecasted Market Size by Type (US$ Million), 2027–2032
Table 41. Global AI Medical Imaging Product Revenue Market Share by Type (2027–2032)
Table 42. Global AI Medical Imaging Product Market Size by Application (US$ Million), 2021–2026
Table 43. Global AI Medical Imaging Product Revenue Market Share by Application (2021–2026)
Table 44. Global AI Medical Imaging Product Forecasted Market Size by Application (US$ Million), 2027–2032
Table 45. Global AI Medical Imaging Product Revenue Market Share by Application (2027–2032)
Table 46. North America AI Medical Imaging Product Market Size Growth Rate by Country (US$ Million): 2021 vs 2025 vs 2032
Table 47. North America AI Medical Imaging Product Market Size by Country (US$ Million), 2021–2026
Table 48. North America AI Medical Imaging Product Market Size by Country (US$ Million), 2027–2032
Table 49. Europe AI Medical Imaging Product Market Size Growth Rate by Country (US$ Million): 2021 vs 2025 vs 2032
Table 50. Europe AI Medical Imaging Product Market Size by Country (US$ Million), 2021–2026
Table 51. Europe AI Medical Imaging Product Market Size by Country (US$ Million), 2027–2032
Table 52. Asia-Pacific AI Medical Imaging Product Market Size Growth Rate by Region (US$ Million): 2021 vs 2025 vs 2032
Table 53. Asia-Pacific AI Medical Imaging Product Market Size by Region (US$ Million), 2021–2026
Table 54. Asia-Pacific AI Medical Imaging Product Market Size by Region (US$ Million), 2027–2032
Table 55. Latin America AI Medical Imaging Product Market Size Growth Rate by Country (US$ Million): 2021 vs 2025 vs 2032
Table 56. Latin America AI Medical Imaging Product Market Size by Country (US$ Million), 2021–2026
Table 57. Latin America AI Medical Imaging Product Market Size by Country (US$ Million), 2027–2032
Table 58. Middle East & Africa AI Medical Imaging Product Market Size Growth Rate by Country (US$ Million): 2021 vs 2025 vs 2032
Table 59. Middle East & Africa AI Medical Imaging Product Market Size by Country (US$ Million), 2021–2026
Table 60. Middle East & Africa AI Medical Imaging Product Market Size by Country (US$ Million), 2027–2032
Table 61. Airdoc Technology Company Details
Table 62. Airdoc Technology Business Overview
Table 63. Airdoc Technology AI Medical Imaging Product Product
Table 64. Airdoc Technology Revenue in AI Medical Imaging Product Business (US$ Million), 2021–2026
Table 65. Airdoc Technology Recent Development
Table 66. Digital Diagnostics Company Details
Table 67. Digital Diagnostics Business Overview
Table 68. Digital Diagnostics AI Medical Imaging Product Product
Table 69. Digital Diagnostics Revenue in AI Medical Imaging Product Business (US$ Million), 2021–2026
Table 70. Digital Diagnostics Recent Development
Table 71. Eyenuk Company Details
Table 72. Eyenuk Business Overview
Table 73. Eyenuk AI Medical Imaging Product Product
Table 74. Eyenuk Revenue in AI Medical Imaging Product Business (US$ Million), 2021–2026
Table 75. Eyenuk Recent Development
Table 76. RetinaLyze System Company Details
Table 77. RetinaLyze System Business Overview
Table 78. RetinaLyze System AI Medical Imaging Product Product
Table 79. RetinaLyze System Revenue in AI Medical Imaging Product Business (US$ Million), 2021–2026
Table 80. RetinaLyze System Recent Development
Table 81. Optomed Company Details
Table 82. Optomed Business Overview
Table 83. Optomed AI Medical Imaging Product Product
Table 84. Optomed Revenue in AI Medical Imaging Product Business (US$ Million), 2021–2026
Table 85. Optomed Recent Development
Table 86. Sibionics Technology Company Details
Table 87. Sibionics Technology Business Overview
Table 88. Sibionics Technology AI Medical Imaging Product Product
Table 89. Sibionics Technology Revenue in AI Medical Imaging Product Business (US$ Million), 2021–2026
Table 90. Sibionics Technology Recent Development
Table 91. AEYE Health Company Details
Table 92. AEYE Health Business Overview
Table 93. AEYE Health AI Medical Imaging Product Product
Table 94. AEYE Health Revenue in AI Medical Imaging Product Business (US$ Million), 2021–2026
Table 95. AEYE Health Recent Development
Table 96. VUNO, Inc. Company Details
Table 97. VUNO, Inc. Business Overview
Table 98. VUNO, Inc. AI Medical Imaging Product Product
Table 99. VUNO, Inc. Revenue in AI Medical Imaging Product Business (US$ Million), 2021–2026
Table 100. VUNO, Inc. Recent Development
Table 101. ScreenPoint Medical Company Details
Table 102. ScreenPoint Medical Business Overview
Table 103. ScreenPoint Medical AI Medical Imaging Product Product
Table 104. ScreenPoint Medical Revenue in AI Medical Imaging Product Business (US$ Million), 2021–2026
Table 105. ScreenPoint Medical Recent Development
Table 106. Deepwise Company Details
Table 107. Deepwise Business Overview
Table 108. Deepwise AI Medical Imaging Product Product
Table 109. Deepwise Revenue in AI Medical Imaging Product Business (US$ Million), 2021–2026
Table 110. Deepwise Recent Development
Table 111. INFERVISION Company Details
Table 112. INFERVISION Business Overview
Table 113. INFERVISION AI Medical Imaging Product Product
Table 114. INFERVISION Revenue in AI Medical Imaging Product Business (US$ Million), 2021–2026
Table 115. INFERVISION Recent Development
Table 116. United Imaging Company Details
Table 117. United Imaging Business Overview
Table 118. United Imaging AI Medical Imaging Product Product
Table 119. United Imaging Revenue in AI Medical Imaging Product Business (US$ Million), 2021–2026
Table 120. United Imaging Recent Development
Table 121. Shukun Technology Company Details
Table 122. Shukun Technology Business Overview
Table 123. Shukun Technology AI Medical Imaging Product Product
Table 124. Shukun Technology Revenue in AI Medical Imaging Product Business (US$ Million), 2021–2026
Table 125. Shukun Technology Recent Development
Table 126. Keya Medical Company Details
Table 127. Keya Medical Business Overview
Table 128. Keya Medical AI Medical Imaging Product Product
Table 129. Keya Medical Revenue in AI Medical Imaging Product Business (US$ Million), 2021–2026
Table 130. Keya Medical Recent Development
Table 131. YITU Healthcare Company Details
Table 132. YITU Healthcare Business Overview
Table 133. YITU Healthcare AI Medical Imaging Product Product
Table 134. YITU Healthcare Revenue in AI Medical Imaging Product Business (US$ Million), 2021–2026
Table 135. YITU Healthcare Recent Development
Table 136. Beijing Huiyi Huiying Company Details
Table 137. Beijing Huiyi Huiying Business Overview
Table 138. Beijing Huiyi Huiying AI Medical Imaging Product Product
Table 139. Beijing Huiyi Huiying Revenue in AI Medical Imaging Product Business (US$ Million), 2021–2026
Table 140. Beijing Huiyi Huiying Recent Development
Table 141. BioMind Company Details
Table 142. BioMind Business Overview
Table 143. BioMind AI Medical Imaging Product Product
Table 144. BioMind Revenue in AI Medical Imaging Product Business (US$ Million), 2021–2026
Table 145. BioMind Recent Development
Table 146. Siemens Healthineers Company Details
Table 147. Siemens Healthineers Business Overview
Table 148. Siemens Healthineers AI Medical Imaging Product Product
Table 149. Siemens Healthineers Revenue in AI Medical Imaging Product Business (US$ Million), 2021–2026
Table 150. Siemens Healthineers Recent Development
Table 151. GE HealthCare Company Details
Table 152. GE HealthCare Business Overview
Table 153. GE HealthCare AI Medical Imaging Product Product
Table 154. GE HealthCare Revenue in AI Medical Imaging Product Business (US$ Million), 2021–2026
Table 155. GE HealthCare Recent Development
Table 156. Philips Company Details
Table 157. Philips Business Overview
Table 158. Philips AI Medical Imaging Product Product
Table 159. Philips Revenue in AI Medical Imaging Product Business (US$ Million), 2021–2026
Table 160. Philips Recent Development
Table 161. Aidoc Company Details
Table 162. Aidoc Business Overview
Table 163. Aidoc AI Medical Imaging Product Product
Table 164. Aidoc Revenue in AI Medical Imaging Product Business (US$ Million), 2021–2026
Table 165. Aidoc Recent Development
Table 166. Viz.ai Company Details
Table 167. Viz.ai Business Overview
Table 168. Viz.ai AI Medical Imaging Product Product
Table 169. Viz.ai Revenue in AI Medical Imaging Product Business (US$ Million), 2021–2026
Table 170. Viz.ai Recent Development
Table 171. RapidAI Company Details
Table 172. RapidAI Business Overview
Table 173. RapidAI AI Medical Imaging Product Product
Table 174. RapidAI Revenue in AI Medical Imaging Product Business (US$ Million), 2021–2026
Table 175. RapidAI Recent Development
Table 176. Subtle Medical Company Details
Table 177. Subtle Medical Business Overview
Table 178. Subtle Medical AI Medical Imaging Product Product
Table 179. Subtle Medical Revenue in AI Medical Imaging Product Business (US$ Million), 2021–2026
Table 180. Subtle Medical Recent Development
Table 181. Lunit Company Details
Table 182. Lunit Business Overview
Table 183. Lunit AI Medical Imaging Product Product
Table 184. Lunit Revenue in AI Medical Imaging Product Business (US$ Million), 2021–2026
Table 185. Lunit Recent Development
Table 186. Qure.ai Company Details
Table 187. Qure.ai Business Overview
Table 188. Qure.ai AI Medical Imaging Product Product
Table 189. Qure.ai Revenue in AI Medical Imaging Product Business (US$ Million), 2021–2026
Table 190. Qure.ai Recent Development
Table 191. Nanox AI Company Details
Table 192. Nanox AI Business Overview
Table 193. Nanox AI AI Medical Imaging Product Product
Table 194. Nanox AI Revenue in AI Medical Imaging Product Business (US$ Million), 2021–2026
Table 195. Nanox AI Recent Development
Table 196. Annalise.ai Company Details
Table 197. Annalise.ai Business Overview
Table 198. Annalise.ai AI Medical Imaging Product Product
Table 199. Annalise.ai Revenue in AI Medical Imaging Product Business (US$ Million), 2021–2026
Table 200. Annalise.ai Recent Development
Table 201. HeartFlow Company Details
Table 202. HeartFlow Business Overview
Table 203. HeartFlow AI Medical Imaging Product Product
Table 204. HeartFlow Revenue in AI Medical Imaging Product Business (US$ Million), 2021–2026
Table 205. HeartFlow Recent Development
Table 206. Cleerly Company Details
Table 207. Cleerly Business Overview
Table 208. Cleerly AI Medical Imaging Product Product
Table 209. Cleerly Revenue in AI Medical Imaging Product Business (US$ Million), 2021–2026
Table 210. Cleerly Recent Development
Table 211. Research Programs/Design for This Report
Table 212. Key Data Information from Secondary Sources
Table 213. Key Data Information from Primary Sources
Table 214. Authors List of This Report
List of Figures
Figure 1. AI Medical Imaging Product Picture
Figure 2. Global AI Medical Imaging Product Market Size Comparison by Type (US$ Million), 2021–2032
Figure 3. Global AI Medical Imaging Product Market Share by Type: 2025 vs 2032
Figure 4. Standalone AI Imaging Software Features
Figure 5. AI Imaging Modules / SDKs Features
Figure 6. AI-enabled Imaging Systems (Software + Hardware) Features
Figure 7. Subscription-based AI Platforms (SaaS) Features
Figure 8. Per-scan / Usage-based AI Services Features
Figure 9. Global AI Medical Imaging Product Market Size Comparison by Imaging Modality (US$ Million), 2021–2032
Figure 10. AI for X-ray Imaging Features
Figure 11. AI for CT Imaging Features
Figure 12. AI for MRI Imaging Features
Figure 13. AI for Ultrasound Imaging Features
Figure 14. AI for Nuclear Medicine Imaging(PET / SPECT) Features
Figure 15. Global AI Medical Imaging Product Market Size Comparison by Clinical Function (US$ Million), 2021–2032
Figure 16. AI-assisted Detection (CADe) Features
Figure 17. AI-assisted Diagnosis (CADx) Features
Figure 18. Segmentation & Quantification AI Features
Figure 19. Workflow & Triage AI Features
Figure 20. Prognosis & Treatment Response Prediction Features
Figure 21. Global AI Medical Imaging Product Market Size by Application (US$ Million), 2021–2032
Figure 22. Global AI Medical Imaging Product Market Share by Application: 2025 vs 2032
Figure 23. Medical Institutions Case Studies
Figure 24. Great Health Scene Case Studies
Figure 25. AI Medical Imaging Product Report Years Considered
Figure 26. Global AI Medical Imaging Product Market Size (US$ Million), Year-over-Year: 2021–2032
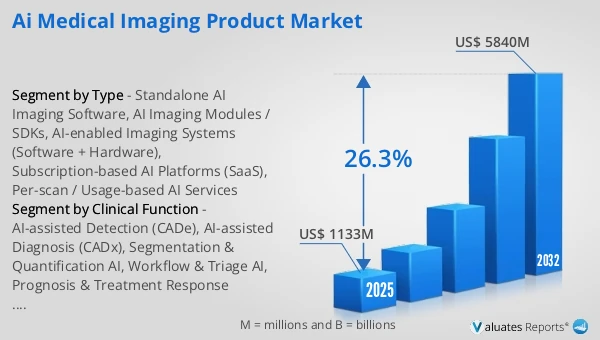
Figure 27. Global AI Medical Imaging Product Market Size, (US$ Million), 2021 vs 2025 vs 2032
Figure 28. Global AI Medical Imaging Product Market Share by Region: 2025 vs 2032
Figure 29. Global AI Medical Imaging Product Market Share by Players in 2025
Figure 30. Global AI Medical Imaging Product Market Share by Company Type (Tier 1, Tier 2, and Tier 3)
Figure 31. The Top 10 and 5 Players Market Share by AI Medical Imaging Product Revenue in 2025
Figure 32. North America AI Medical Imaging Product Market Size YoY Growth (US$ Million), 2021–2032
Figure 33. North America AI Medical Imaging Product Market Share by Country (2021–2032)
Figure 34. United States AI Medical Imaging Product Market Size YoY Growth (US$ Million), 2021–2032
Figure 35. Canada AI Medical Imaging Product Market Size YoY Growth (US$ Million), 2021–2032
Figure 36. Europe AI Medical Imaging Product Market Size YoY Growth (US$ Million), 2021–2032
Figure 37. Europe AI Medical Imaging Product Market Share by Country (2021–2032)
Figure 38. Germany AI Medical Imaging Product Market Size YoY Growth (US$ Million), 2021–2032
Figure 39. France AI Medical Imaging Product Market Size YoY Growth (US$ Million), 2021–2032
Figure 40. U.K. AI Medical Imaging Product Market Size YoY Growth (US$ Million), 2021–2032
Figure 41. Italy AI Medical Imaging Product Market Size YoY Growth (US$ Million), 2021–2032
Figure 42. Russia AI Medical Imaging Product Market Size YoY Growth (US$ Million), 2021–2032
Figure 43. Ireland AI Medical Imaging Product Market Size YoY Growth (US$ Million), 2021–2032
Figure 44. Asia-Pacific AI Medical Imaging Product Market Size YoY Growth (US$ Million), 2021–2032
Figure 45. Asia-Pacific AI Medical Imaging Product Market Share by Region (2021–2032)
Figure 46. China AI Medical Imaging Product Market Size YoY Growth (US$ Million), 2021–2032
Figure 47. Japan AI Medical Imaging Product Market Size YoY Growth (US$ Million), 2021–2032
Figure 48. South Korea AI Medical Imaging Product Market Size YoY Growth (US$ Million), 2021–2032
Figure 49. Southeast Asia AI Medical Imaging Product Market Size YoY Growth (US$ Million), 2021–2032
Figure 50. India AI Medical Imaging Product Market Size YoY Growth (US$ Million), 2021–2032
Figure 51. Australia & New Zealand AI Medical Imaging Product Market Size YoY Growth (US$ Million), 2021–2032
Figure 52. Latin America AI Medical Imaging Product Market Size YoY Growth (US$ Million), 2021–2032
Figure 53. Latin America AI Medical Imaging Product Market Share by Country (2021–2032)
Figure 54. Mexico AI Medical Imaging Product Market Size YoY Growth (US$ Million), 2021–2032
Figure 55. Brazil AI Medical Imaging Product Market Size YoY Growth (US$ Million), 2021–2032
Figure 56. Middle East & Africa AI Medical Imaging Product Market Size YoY Growth (US$ Million), 2021–2032
Figure 57. Middle East & Africa AI Medical Imaging Product Market Share by Country (2021–2032)
Figure 58. Israel AI Medical Imaging Product Market Size YoY Growth (US$ Million), 2021–2032
Figure 59. Saudi Arabia AI Medical Imaging Product Market Size YoY Growth (US$ Million), 2021–2032
Figure 60. UAE AI Medical Imaging Product Market Size YoY Growth (US$ Million), 2021–2032
Figure 61. Airdoc Technology Revenue Growth Rate in AI Medical Imaging Product Business (2021–2026)
Figure 62. Digital Diagnostics Revenue Growth Rate in AI Medical Imaging Product Business (2021–2026)
Figure 63. Eyenuk Revenue Growth Rate in AI Medical Imaging Product Business (2021–2026)
Figure 64. RetinaLyze System Revenue Growth Rate in AI Medical Imaging Product Business (2021–2026)
Figure 65. Optomed Revenue Growth Rate in AI Medical Imaging Product Business (2021–2026)
Figure 66. Sibionics Technology Revenue Growth Rate in AI Medical Imaging Product Business (2021–2026)
Figure 67. AEYE Health Revenue Growth Rate in AI Medical Imaging Product Business (2021–2026)
Figure 68. VUNO, Inc. Revenue Growth Rate in AI Medical Imaging Product Business (2021–2026)
Figure 69. ScreenPoint Medical Revenue Growth Rate in AI Medical Imaging Product Business (2021–2026)
Figure 70. Deepwise Revenue Growth Rate in AI Medical Imaging Product Business (2021–2026)
Figure 71. INFERVISION Revenue Growth Rate in AI Medical Imaging Product Business (2021–2026)
Figure 72. United Imaging Revenue Growth Rate in AI Medical Imaging Product Business (2021–2026)
Figure 73. Shukun Technology Revenue Growth Rate in AI Medical Imaging Product Business (2021–2026)
Figure 74. Keya Medical Revenue Growth Rate in AI Medical Imaging Product Business (2021–2026)
Figure 75. YITU Healthcare Revenue Growth Rate in AI Medical Imaging Product Business (2021–2026)
Figure 76. Beijing Huiyi Huiying Revenue Growth Rate in AI Medical Imaging Product Business (2021–2026)
Figure 77. BioMind Revenue Growth Rate in AI Medical Imaging Product Business (2021–2026)
Figure 78. Siemens Healthineers Revenue Growth Rate in AI Medical Imaging Product Business (2021–2026)
Figure 79. GE HealthCare Revenue Growth Rate in AI Medical Imaging Product Business (2021–2026)
Figure 80. Philips Revenue Growth Rate in AI Medical Imaging Product Business (2021–2026)
Figure 81. Aidoc Revenue Growth Rate in AI Medical Imaging Product Business (2021–2026)
Figure 82. Viz.ai Revenue Growth Rate in AI Medical Imaging Product Business (2021–2026)
Figure 83. RapidAI Revenue Growth Rate in AI Medical Imaging Product Business (2021–2026)
Figure 84. Subtle Medical Revenue Growth Rate in AI Medical Imaging Product Business (2021–2026)
Figure 85. Lunit Revenue Growth Rate in AI Medical Imaging Product Business (2021–2026)
Figure 86. Qure.ai Revenue Growth Rate in AI Medical Imaging Product Business (2021–2026)
Figure 87. Nanox AI Revenue Growth Rate in AI Medical Imaging Product Business (2021–2026)
Figure 88. Annalise.ai Revenue Growth Rate in AI Medical Imaging Product Business (2021–2026)
Figure 89. HeartFlow Revenue Growth Rate in AI Medical Imaging Product Business (2021–2026)
Figure 90. Cleerly Revenue Growth Rate in AI Medical Imaging Product Business (2021–2026)
Figure 91. Bottom-up and Top-down Approaches for This Report
Figure 92. Data Triangulation
Figure 93. Key Executives Interviewed