List of Tables
Table 1. AI Medical Imaging Market Trends
Table 2. AI Medical Imaging Market Drivers & Opportunities
Table 3. AI Medical Imaging Market Challenges
Table 4. AI Medical Imaging Market Restraints
Table 5. Global AI Medical Imaging Revenue by Company (US$ Million), 2021–2026
Table 6. Global AI Medical Imaging Revenue Market Share by Company (2021–2026)
Table 7. Key Companies’ R&D and Operations Footprint and Headquarters
Table 8. Key Companies AI Medical Imaging Product Type
Table 9. Key Companies General Availability (GA) Timeline for AI Medical Imaging
Table 10. Global AI Medical Imaging Companies Market Concentration Ratio (CR5 and HHI)
Table 11. Global Companies by Tier (Tier 1, Tier 2, Tier 3), based on AI Medical Imaging revenue, 2025
Table 12. Mergers & Acquisitions and Expansion Plans
Table 13. Global AI Medical Imaging Sales Value by Type: 2021 vs 2025 vs 2032 (US$ Million)
Table 14. Global AI Medical Imaging Sales Value by Type (US$ Million), 2021–2026
Table 15. Global AI Medical Imaging Sales Value by Type (US$ Million), 2027–2032
Table 16. Global AI Medical Imaging Sales Market Share in Value by Type (2021–2026)
Table 17. Global AI Medical Imaging Sales Market Share in Value by Type (2027–2032)
Table 18. Global AI Medical Imaging Sales Value by Imaging Modality: 2021 vs 2025 vs 2032 (US$ Million)
Table 19. Global AI Medical Imaging Sales Value by Imaging Modality (US$ Million), 2021–2026
Table 20. Global AI Medical Imaging Sales Value by Imaging Modality (US$ Million), 2027–2032
Table 21. Global AI Medical Imaging Sales Market Share in Value by Imaging Modality (2021–2026)
Table 22. Global AI Medical Imaging Sales Market Share in Value by Imaging Modality (2027–2032)
Table 23. Global AI Medical Imaging Sales Value by Regulatory & Commercial Type: 2021 vs 2025 vs 2032 (US$ Million)
Table 24. Global AI Medical Imaging Sales Value by Regulatory & Commercial Type (US$ Million), 2021–2026
Table 25. Global AI Medical Imaging Sales Value by Regulatory & Commercial Type (US$ Million), 2027–2032
Table 26. Global AI Medical Imaging Sales Market Share in Value by Regulatory & Commercial Type (2021–2026)
Table 27. Global AI Medical Imaging Sales Market Share in Value by Regulatory & Commercial Type (2027–2032)
Table 28. Global AI Medical Imaging Sales Value by Application: 2021 vs 2025 vs 2032 (US$ Million)
Table 29. Global AI Medical Imaging Sales Value by Application (US$ Million), 2021–2026
Table 30. Global AI Medical Imaging Sales Value by Application (US$ Million), 2027–2032
Table 31. Global AI Medical Imaging Sales Market Share in Value by Application (2021–2026)
Table 32. Global AI Medical Imaging Sales Market Share in Value by Application (2027–2032)
Table 33. Global AI Medical Imaging Sales Value by Region, (US$ Million), 2021 vs 2025 vs 2032
Table 34. Global AI Medical Imaging Sales Value by Region (US$ Million), 2021–2026
Table 35. Global AI Medical Imaging Sales Value by Region (US$ Million), 2027–2032
Table 36. Global AI Medical Imaging Sales Value by Region (%), 2021–2026
Table 37. Global AI Medical Imaging Sales Value by Region (%), 2027–2032
Table 38. Key Countries/Regions AI Medical Imaging Sales Value Growth Trends, (US$ Million): 2021 vs 2025 vs 2032
Table 39. Key Countries/Regions AI Medical Imaging Sales Value, (US$ Million), 2021–2026
Table 40. Key Countries/Regions AI Medical Imaging Sales Value, (US$ Million), 2027–2032
Table 41. Philips Basic Information List
Table 42. Philips Description and Business Overview
Table 43. Philips AI Medical Imaging Products, Services, and Solutions
Table 44. Revenue (US$ Million) in AI Medical Imaging Business of Philips (2021–2026)
Table 45. Philips Recent Developments
Table 46. Merative Basic Information List
Table 47. Merative Description and Business Overview
Table 48. Merative AI Medical Imaging Products, Services, and Solutions
Table 49. Revenue (US$ Million) in AI Medical Imaging Business of Merative (2021–2026)
Table 50. Merative Recent Developments
Table 51. Butterfly Network Basic Information List
Table 52. Butterfly Network Description and Business Overview
Table 53. Butterfly Network AI Medical Imaging Products, Services, and Solutions
Table 54. Revenue (US$ Million) in AI Medical Imaging Business of Butterfly Network (2021–2026)
Table 55. Butterfly Network Recent Developments
Table 56. Tempus Basic Information List
Table 57. Tempus Description and Business Overview
Table 58. Tempus AI Medical Imaging Products, Services, and Solutions
Table 59. Revenue (US$ Million) in AI Medical Imaging Business of Tempus (2021–2026)
Table 60. Tempus Recent Developments
Table 61. Nanox Basic Information List
Table 62. Nanox Description and Business Overview
Table 63. Nanox AI Medical Imaging Products, Services, and Solutions
Table 64. Revenue (US$ Million) in AI Medical Imaging Business of Nanox (2021–2026)
Table 65. Nanox Recent Developments
Table 66. Microsoft Basic Information List
Table 67. Microsoft Description and Business Overview
Table 68. Microsoft AI Medical Imaging Products, Services, and Solutions
Table 69. Revenue (US$ Million) in AI Medical Imaging Business of Microsoft (2021–2026)
Table 70. Microsoft Recent Developments
Table 71. Viz.ai Basic Information List
Table 72. Viz.ai Description and Business Overview
Table 73. Viz.ai AI Medical Imaging Products, Services, and Solutions
Table 74. Revenue (US$ Million) in AI Medical Imaging Business of Viz.ai (2021–2026)
Table 75. Viz.ai Recent Developments
Table 76. Lunit Basic Information List
Table 77. Lunit Description and Business Overview
Table 78. Lunit AI Medical Imaging Products, Services, and Solutions
Table 79. Revenue (US$ Million) in AI Medical Imaging Business of Lunit (2021–2026)
Table 80. Lunit Recent Developments
Table 81. DiA Imaging Basic Information List
Table 82. DiA Imaging Description and Business Overview
Table 83. DiA Imaging AI Medical Imaging Products, Services, and Solutions
Table 84. Revenue (US$ Million) in AI Medical Imaging Business of DiA Imaging (2021–2026)
Table 85. DiA Imaging Recent Developments
Table 86. RetinAi Basic Information List
Table 87. RetinAi Description and Business Overview
Table 88. RetinAi AI Medical Imaging Products, Services, and Solutions
Table 89. Revenue (US$ Million) in AI Medical Imaging Business of RetinAi (2021–2026)
Table 90. RetinAi Recent Developments
Table 91. RapidAI Basic Information List
Table 92. RapidAI Description and Business Overview
Table 93. RapidAI AI Medical Imaging Products, Services, and Solutions
Table 94. Revenue (US$ Million) in AI Medical Imaging Business of RapidAI (2021–2026)
Table 95. RapidAI Recent Developments
Table 96. Canon Medical Basic Information List
Table 97. Canon Medical Description and Business Overview
Table 98. Canon Medical AI Medical Imaging Products, Services, and Solutions
Table 99. Revenue (US$ Million) in AI Medical Imaging Business of Canon Medical (2021–2026)
Table 100. Canon Medical Recent Developments
Table 101. KONFOONG BIOTECH INTERNATIONAL CO., LTD(KFBIO) Basic Information List
Table 102. KONFOONG BIOTECH INTERNATIONAL CO., LTD(KFBIO) Description and Business Overview
Table 103. KONFOONG BIOTECH INTERNATIONAL CO., LTD(KFBIO) AI Medical Imaging Products, Services, and Solutions
Table 104. Revenue (US$ Million) in AI Medical Imaging Business of KONFOONG BIOTECH INTERNATIONAL CO., LTD(KFBIO) (2021–2026)
Table 105. KONFOONG BIOTECH INTERNATIONAL CO., LTD(KFBIO) Recent Developments
Table 106. GE Basic Information List
Table 107. GE Description and Business Overview
Table 108. GE AI Medical Imaging Products, Services, and Solutions
Table 109. Revenue (US$ Million) in AI Medical Imaging Business of GE (2021–2026)
Table 110. GE Recent Developments
Table 111. Aidoc Basic Information List
Table 112. Aidoc Description and Business Overview
Table 113. Aidoc AI Medical Imaging Products, Services, and Solutions
Table 114. Revenue (US$ Million) in AI Medical Imaging Business of Aidoc (2021–2026)
Table 115. Aidoc Recent Developments
Table 116. Siemens Basic Information List
Table 117. Siemens Description and Business Overview
Table 118. Siemens AI Medical Imaging Products, Services, and Solutions
Table 119. Revenue (US$ Million) in AI Medical Imaging Business of Siemens (2021–2026)
Table 120. Siemens Recent Developments
Table 121. Enlitic Basic Information List
Table 122. Enlitic Description and Business Overview
Table 123. Enlitic AI Medical Imaging Products, Services, and Solutions
Table 124. Revenue (US$ Million) in AI Medical Imaging Business of Enlitic (2021–2026)
Table 125. Enlitic Recent Developments
Table 126. BioMind Basic Information List
Table 127. BioMind Description and Business Overview
Table 128. BioMind AI Medical Imaging Products, Services, and Solutions
Table 129. Revenue (US$ Million) in AI Medical Imaging Business of BioMind (2021–2026)
Table 130. BioMind Recent Developments
Table 131. ANNALISE-AI PTY LTD Basic Information List
Table 132. ANNALISE-AI PTY LTD Description and Business Overview
Table 133. ANNALISE-AI PTY LTD AI Medical Imaging Products, Services, and Solutions
Table 134. Revenue (US$ Million) in AI Medical Imaging Business of ANNALISE-AI PTY LTD (2021–2026)
Table 135. ANNALISE-AI PTY LTD Recent Developments
Table 136. icometrix Basic Information List
Table 137. icometrix Description and Business Overview
Table 138. icometrix AI Medical Imaging Products, Services, and Solutions
Table 139. Revenue (US$ Million) in AI Medical Imaging Business of icometrix (2021–2026)
Table 140. icometrix Recent Developments
Table 141. Revenue (US$ Million) in AI Medical Imaging Business of Company 40 (2021–2026)
Table 142. Company 40 Recent Developments
Table 143. Key Raw Materials Lists
Table 144. Key Suppliers of Raw Materials Lists
Table 145. AI Medical Imaging Downstream Customers
Table 146. AI Medical Imaging Distributors List
Table 147. Research Programs/Design for This Report
Table 148. Key Data Information from Secondary Sources
Table 149. Key Data Information from Primary Sources
List of Figures
Figure 1. AI Medical Imaging Product Picture
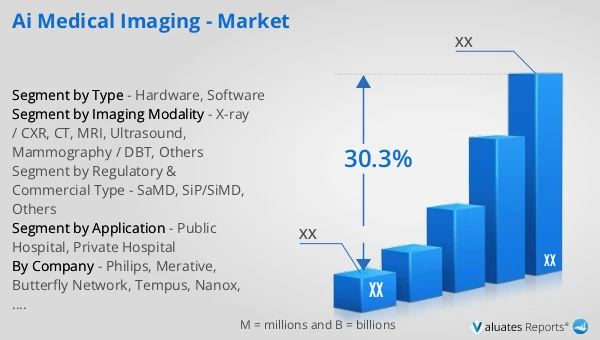
Figure 2. Global AI Medical Imaging Sales Value, 2021 vs 2025 vs 2032 (US$ Million)
Figure 3. Global AI Medical Imaging Sales Value (US$ Million), 2021–2032
Figure 4. AI Medical Imaging Report Years Considered
Figure 5. Global AI Medical Imaging Players Revenue Ranking (US$ Million), 2025
Figure 6. The 5 and 10 Largest Companies in the World: Market Share by AI Medical Imaging Revenue in 2025
Figure 7. AI Medical Imaging Market Share by Company Type (Tier 1, Tier 2, and Tier 3): 2021 vs 2025
Figure 8. Hardware Picture
Figure 9. Software Picture
Figure 10. Global AI Medical Imaging Sales Value by Type (US$ Million), 2021 vs 2025 vs 2032
Figure 11. Global AI Medical Imaging Sales Value Market Share by Type, 2025 & 2032
Figure 12. X-ray / CXR Picture
Figure 13. CT Picture
Figure 14. MRI Picture
Figure 15. Ultrasound Picture
Figure 16. Mammography / DBT Picture
Figure 17. Others Picture
Figure 18. Global AI Medical Imaging Sales Value by Imaging Modality (US$ Million), 2021 vs 2025 vs 2032
Figure 19. Global AI Medical Imaging Sales Value Market Share by Imaging Modality, 2025 & 2032
Figure 20. SaMD Picture
Figure 21. SiP/SiMD Picture
Figure 22. Others Picture
Figure 23. Global AI Medical Imaging Sales Value by Regulatory & Commercial Type (US$ Million), 2021 vs 2025 vs 2032
Figure 24. Global AI Medical Imaging Sales Value Market Share by Regulatory & Commercial Type, 2025 & 2032
Figure 25. Product Picture of Public Hospital
Figure 26. Product Picture of Private Hospital
Figure 27. Global AI Medical Imaging Sales Value by Application (US$ Million), 2021 vs 2025 vs 2032
Figure 28. Global AI Medical Imaging Sales Value Market Share by Application, 2025 & 2032
Figure 29. North America AI Medical Imaging Sales Value (US$ Million), 2021–2032
Figure 30. North America AI Medical Imaging Sales Value by Country (%), 2025 vs 2032
Figure 31. Europe AI Medical Imaging Sales Value (US$ Million), 2021–2032
Figure 32. Europe AI Medical Imaging Sales Value by Country (%), 2025 vs 2032
Figure 33. Asia Pacific AI Medical Imaging Sales Value (US$ Million), 2021–2032
Figure 34. Asia Pacific AI Medical Imaging Sales Value by Subregion (%), 2025 vs 2032
Figure 35. South America AI Medical Imaging Sales Value (US$ Million), 2021–2032
Figure 36. South America AI Medical Imaging Sales Value by Country (%), 2025 vs 2032
Figure 37. Middle East & Africa AI Medical Imaging Sales Value (US$ Million), 2021–2032
Figure 38. Middle East & Africa AI Medical Imaging Sales Value by Country (%), 2025 vs 2032
Figure 39. Key Countries/Regions AI Medical Imaging Sales Value (%), 2021–2032
Figure 40. United States AI Medical Imaging Sales Value (US$ Million), 2021–2032
Figure 41. United States AI Medical Imaging Sales Value by Type (%), 2025 vs 2032
Figure 42. United States AI Medical Imaging Sales Value by Application (%), 2025 vs 2032
Figure 43. Europe AI Medical Imaging Sales Value (US$ Million), 2021–2032
Figure 44. Europe AI Medical Imaging Sales Value by Type (%), 2025 vs 2032
Figure 45. Europe AI Medical Imaging Sales Value by Application (%), 2025 vs 2032
Figure 46. China AI Medical Imaging Sales Value (US$ Million), 2021–2032
Figure 47. China AI Medical Imaging Sales Value by Type (%), 2025 vs 2032
Figure 48. China AI Medical Imaging Sales Value by Application (%), 2025 vs 2032
Figure 49. Japan AI Medical Imaging Sales Value (US$ Million), 2021–2032
Figure 50. Japan AI Medical Imaging Sales Value by Type (%), 2025 vs 2032
Figure 51. Japan AI Medical Imaging Sales Value by Application (%), 2025 vs 2032
Figure 52. South Korea AI Medical Imaging Sales Value (US$ Million), 2021–2032
Figure 53. South Korea AI Medical Imaging Sales Value by Type (%), 2025 vs 2032
Figure 54. South Korea AI Medical Imaging Sales Value by Application (%), 2025 vs 2032
Figure 55. Southeast Asia AI Medical Imaging Sales Value (US$ Million), 2021–2032
Figure 56. Southeast Asia AI Medical Imaging Sales Value by Type (%), 2025 vs 2032
Figure 57. Southeast Asia AI Medical Imaging Sales Value by Application (%), 2025 vs 2032
Figure 58. India AI Medical Imaging Sales Value (US$ Million), 2021–2032
Figure 59. India AI Medical Imaging Sales Value by Type (%), 2025 vs 2032
Figure 60. India AI Medical Imaging Sales Value by Application (%), 2025 vs 2032
Figure 61. AI Medical Imaging Value Chain
Figure 62. AI Medical Imaging Cost Structure
Figure 63. Channels of Distribution (Direct Sales, and Distribution)
Figure 64. Bottom-up and Top-down Approaches for This Report
Figure 65. Data Triangulation
Figure 66. Key Executives Interviewed