List of Tables
Table 1. Global Complementary and Alternative Medicine Market Size Growth Rate by Type (US$ Million): 2020 VS 2024 VS 2031
Table 2. Key Players of Botanicals
Table 3. Key Players of Acupuncture
Table 4. Key Players of Mind, Body, and Yoga
Table 5. Key Players of Magnetic Intervention
Table 6. Global Complementary and Alternative Medicine Market Size Growth by Application (US$ Million): 2020 VS 2024 VS 2031
Table 7. Global Complementary and Alternative Medicine Market Size by Region (US$ Million): 2020 VS 2024 VS 2031
Table 8. Global Complementary and Alternative Medicine Market Size by Region (2020-2025) & (US$ Million)
Table 9. Global Complementary and Alternative Medicine Market Share by Region (2020-2025)
Table 10. Global Complementary and Alternative Medicine Forecasted Market Size by Region (2026-2031) & (US$ Million)
Table 11. Global Complementary and Alternative Medicine Market Share by Region (2026-2031)
Table 12. Complementary and Alternative Medicine Market Trends
Table 13. Complementary and Alternative Medicine Market Drivers
Table 14. Complementary and Alternative Medicine Market Challenges
Table 15. Complementary and Alternative Medicine Market Restraints
Table 16. Global Complementary and Alternative Medicine Revenue by Players (2020-2025) & (US$ Million)
Table 17. Global Complementary and Alternative Medicine Market Share by Players (2020-2025)
Table 18. Global Top Complementary and Alternative Medicine Players by Company Type (Tier 1, Tier 2, and Tier 3) & (based on the Revenue in Complementary and Alternative Medicine as of 2024)
Table 19. Ranking of Global Top Complementary and Alternative Medicine Companies by Revenue (US$ Million) in 2024
Table 20. Global 5 Largest Players Market Share by Complementary and Alternative Medicine Revenue (CR5 and HHI) & (2020-2025)
Table 21. Global Key Players of Complementary and Alternative Medicine, Headquarters and Area Served
Table 22. Global Key Players of Complementary and Alternative Medicine, Product and Application
Table 23. Global Key Players of Complementary and Alternative Medicine, Date of Enter into This Industry
Table 24. Mergers & Acquisitions, Expansion Plans
Table 25. Global Complementary and Alternative Medicine Market Size by Type (2020-2025) & (US$ Million)
Table 26. Global Complementary and Alternative Medicine Revenue Market Share by Type (2020-2025)
Table 27. Global Complementary and Alternative Medicine Forecasted Market Size by Type (2026-2031) & (US$ Million)
Table 28. Global Complementary and Alternative Medicine Revenue Market Share by Type (2026-2031)
Table 29. Global Complementary and Alternative Medicine Market Size by Application (2020-2025) & (US$ Million)
Table 30. Global Complementary and Alternative Medicine Revenue Market Share by Application (2020-2025)
Table 31. Global Complementary and Alternative Medicine Forecasted Market Size by Application (2026-2031) & (US$ Million)
Table 32. Global Complementary and Alternative Medicine Revenue Market Share by Application (2026-2031)
Table 33. North America Complementary and Alternative Medicine Market Size Growth Rate by Country (US$ Million): 2020 VS 2024 VS 2031
Table 34. North America Complementary and Alternative Medicine Market Size by Country (2020-2025) & (US$ Million)
Table 35. North America Complementary and Alternative Medicine Market Size by Country (2026-2031) & (US$ Million)
Table 36. Europe Complementary and Alternative Medicine Market Size Growth Rate by Country (US$ Million): 2020 VS 2024 VS 2031
Table 37. Europe Complementary and Alternative Medicine Market Size by Country (2020-2025) & (US$ Million)
Table 38. Europe Complementary and Alternative Medicine Market Size by Country (2026-2031) & (US$ Million)
Table 39. Asia-Pacific Complementary and Alternative Medicine Market Size Growth Rate by Region (US$ Million): 2020 VS 2024 VS 2031
Table 40. Asia-Pacific Complementary and Alternative Medicine Market Size by Region (2020-2025) & (US$ Million)
Table 41. Asia-Pacific Complementary and Alternative Medicine Market Size by Region (2026-2031) & (US$ Million)
Table 42. Latin America Complementary and Alternative Medicine Market Size Growth Rate by Country (US$ Million): 2020 VS 2024 VS 2031
Table 43. Latin America Complementary and Alternative Medicine Market Size by Country (2020-2025) & (US$ Million)
Table 44. Latin America Complementary and Alternative Medicine Market Size by Country (2026-2031) & (US$ Million)
Table 45. Middle East & Africa Complementary and Alternative Medicine Market Size Growth Rate by Country (US$ Million): 2020 VS 2024 VS 2031
Table 46. Middle East & Africa Complementary and Alternative Medicine Market Size by Country (2020-2025) & (US$ Million)
Table 47. Middle East & Africa Complementary and Alternative Medicine Market Size by Country (2026-2031) & (US$ Million)
Table 48. Columbia Nutritional Company Details
Table 49. Columbia Nutritional Business Overview
Table 50. Columbia Nutritional Complementary and Alternative Medicine Product
Table 51. Columbia Nutritional Revenue in Complementary and Alternative Medicine Business (2020-2025) & (US$ Million)
Table 52. Columbia Nutritional Recent Development
Table 53. Herb Pharm Company Details
Table 54. Herb Pharm Business Overview
Table 55. Herb Pharm Complementary and Alternative Medicine Product
Table 56. Herb Pharm Revenue in Complementary and Alternative Medicine Business (2020-2025) & (US$ Million)
Table 57. Herb Pharm Recent Development
Table 58. Herbal Hills Company Details
Table 59. Herbal Hills Business Overview
Table 60. Herbal Hills Complementary and Alternative Medicine Product
Table 61. Herbal Hills Revenue in Complementary and Alternative Medicine Business (2020-2025) & (US$ Million)
Table 62. Herbal Hills Recent Development
Table 63. Helio USA Company Details
Table 64. Helio USA Business Overview
Table 65. Helio USA Complementary and Alternative Medicine Product
Table 66. Helio USA Revenue in Complementary and Alternative Medicine Business (2020-2025) & (US$ Million)
Table 67. Helio USA Recent Development
Table 68. Deepure Plus Company Details
Table 69. Deepure Plus Business Overview
Table 70. Deepure Plus Complementary and Alternative Medicine Product
Table 71. Deepure Plus Revenue in Complementary and Alternative Medicine Business (2020-2025) & (US$ Million)
Table 72. Deepure Plus Recent Development
Table 73. Nordic Naturals Company Details
Table 74. Nordic Naturals Business Overview
Table 75. Nordic Naturals Complementary and Alternative Medicine Product
Table 76. Nordic Naturals Revenue in Complementary and Alternative Medicine Business (2020-2025) & (US$ Million)
Table 77. Nordic Naturals Recent Development
Table 78. Pure encapsulations Company Details
Table 79. Pure encapsulations Business Overview
Table 80. Pure encapsulations Complementary and Alternative Medicine Product
Table 81. Pure encapsulations Revenue in Complementary and Alternative Medicine Business (2020-2025) & (US$ Million)
Table 82. Pure encapsulations Recent Development
Table 83. Iyengar Yoga Institute Company Details
Table 84. Iyengar Yoga Institute Business Overview
Table 85. Iyengar Yoga Institute Complementary and Alternative Medicine Product
Table 86. Iyengar Yoga Institute Revenue in Complementary and Alternative Medicine Business (2020-2025) & (US$ Million)
Table 87. Iyengar Yoga Institute Recent Development
Table 88. John Schumacher’s Unity Woods Yoga Center Company Details
Table 89. John Schumacher’s Unity Woods Yoga Center Business Overview
Table 90. John Schumacher’s Unity Woods Yoga Center Complementary and Alternative Medicine Product
Table 91. John Schumacher’s Unity Woods Yoga Center Revenue in Complementary and Alternative Medicine Business (2020-2025) & (US$ Million)
Table 92. John Schumacher’s Unity Woods Yoga Center Recent Development
Table 93. Yoga Tree Company Details
Table 94. Yoga Tree Business Overview
Table 95. Yoga Tree Complementary and Alternative Medicine Product
Table 96. Yoga Tree Revenue in Complementary and Alternative Medicine Business (2020-2025) & (US$ Million)
Table 97. Yoga Tree Recent Development
Table 98. The Healing Company Company Details
Table 99. The Healing Company Business Overview
Table 100. The Healing Company Complementary and Alternative Medicine Product
Table 101. The Healing Company Revenue in Complementary and Alternative Medicine Business (2020-2025) & (US$ Million)
Table 102. The Healing Company Recent Development
Table 103. Quantum Touch Company Details
Table 104. Quantum Touch Business Overview
Table 105. Quantum Touch Complementary and Alternative Medicine Product
Table 106. Quantum Touch Revenue in Complementary and Alternative Medicine Business (2020-2025) & (US$ Million)
Table 107. Quantum Touch Recent Development
Table 108. Research Programs/Design for This Report
Table 109. Key Data Information from Secondary Sources
Table 110. Key Data Information from Primary Sources
Table 111. Authors List of This Report
List of Figures
Figure 1. Complementary and Alternative Medicine Picture
Figure 2. Global Complementary and Alternative Medicine Market Size Comparison by Type (2020-2031) & (US$ Million)
Figure 3. Global Complementary and Alternative Medicine Market Share by Type: 2024 VS 2031
Figure 4. Botanicals Features
Figure 5. Acupuncture Features
Figure 6. Mind, Body, and Yoga Features
Figure 7. Magnetic Intervention Features
Figure 8. Global Complementary and Alternative Medicine Market Size by Application (2020-2031) & (US$ Million)
Figure 9. Global Complementary and Alternative Medicine Market Share by Application: 2024 VS 2031
Figure 10. Direct Contact Case Studies
Figure 11. E-training Case Studies
Figure 12. Distance Correspondence Case Studies
Figure 13. Complementary and Alternative Medicine Report Years Considered
Figure 14. Global Complementary and Alternative Medicine Market Size (US$ Million), Year-over-Year: 2020-2031
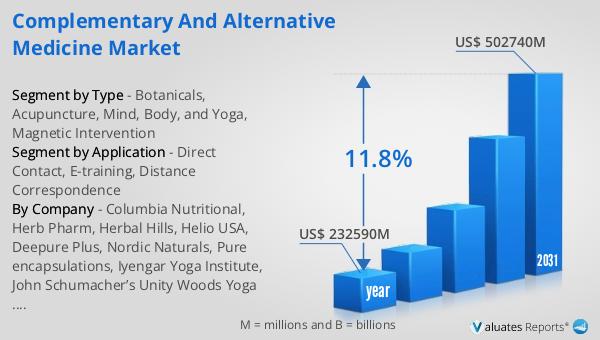
Figure 15. Global Complementary and Alternative Medicine Market Size, (US$ Million), 2020 VS 2024 VS 2031
Figure 16. Global Complementary and Alternative Medicine Market Share by Region: 2024 VS 2031
Figure 17. Global Complementary and Alternative Medicine Market Share by Players in 2024
Figure 18. Global Top Complementary and Alternative Medicine Players by Company Type (Tier 1, Tier 2, and Tier 3) & (based on the Revenue in Complementary and Alternative Medicine as of 2024)
Figure 19. The Top 10 and 5 Players Market Share by Complementary and Alternative Medicine Revenue in 2024
Figure 20. North America Complementary and Alternative Medicine Market Size YoY Growth (2020-2031) & (US$ Million)
Figure 21. North America Complementary and Alternative Medicine Market Share by Country (2020-2031)
Figure 22. United States Complementary and Alternative Medicine Market Size YoY Growth (2020-2031) & (US$ Million)
Figure 23. Canada Complementary and Alternative Medicine Market Size YoY Growth (2020-2031) & (US$ Million)
Figure 24. Europe Complementary and Alternative Medicine Market Size YoY Growth (2020-2031) & (US$ Million)
Figure 25. Europe Complementary and Alternative Medicine Market Share by Country (2020-2031)
Figure 26. Germany Complementary and Alternative Medicine Market Size YoY Growth (2020-2031) & (US$ Million)
Figure 27. France Complementary and Alternative Medicine Market Size YoY Growth (2020-2031) & (US$ Million)
Figure 28. U.K. Complementary and Alternative Medicine Market Size YoY Growth (2020-2031) & (US$ Million)
Figure 29. Italy Complementary and Alternative Medicine Market Size YoY Growth (2020-2031) & (US$ Million)
Figure 30. Russia Complementary and Alternative Medicine Market Size YoY Growth (2020-2031) & (US$ Million)
Figure 31. Nordic Countries Complementary and Alternative Medicine Market Size YoY Growth (2020-2031) & (US$ Million)
Figure 32. Asia-Pacific Complementary and Alternative Medicine Market Size YoY Growth (2020-2031) & (US$ Million)
Figure 33. Asia-Pacific Complementary and Alternative Medicine Market Share by Region (2020-2031)
Figure 34. China Complementary and Alternative Medicine Market Size YoY Growth (2020-2031) & (US$ Million)
Figure 35. Japan Complementary and Alternative Medicine Market Size YoY Growth (2020-2031) & (US$ Million)
Figure 36. South Korea Complementary and Alternative Medicine Market Size YoY Growth (2020-2031) & (US$ Million)
Figure 37. Southeast Asia Complementary and Alternative Medicine Market Size YoY Growth (2020-2031) & (US$ Million)
Figure 38. India Complementary and Alternative Medicine Market Size YoY Growth (2020-2031) & (US$ Million)
Figure 39. Australia Complementary and Alternative Medicine Market Size YoY Growth (2020-2031) & (US$ Million)
Figure 40. Latin America Complementary and Alternative Medicine Market Size YoY Growth (2020-2031) & (US$ Million)
Figure 41. Latin America Complementary and Alternative Medicine Market Share by Country (2020-2031)
Figure 42. Mexico Complementary and Alternative Medicine Market Size YoY Growth (2020-2031) & (US$ Million)
Figure 43. Brazil Complementary and Alternative Medicine Market Size YoY Growth (2020-2031) & (US$ Million)
Figure 44. Middle East & Africa Complementary and Alternative Medicine Market Size YoY Growth (2020-2031) & (US$ Million)
Figure 45. Middle East & Africa Complementary and Alternative Medicine Market Share by Country (2020-2031)
Figure 46. Turkey Complementary and Alternative Medicine Market Size YoY Growth (2020-2031) & (US$ Million)
Figure 47. Saudi Arabia Complementary and Alternative Medicine Market Size YoY Growth (2020-2031) & (US$ Million)
Figure 48. UAE Complementary and Alternative Medicine Market Size YoY Growth (2020-2031) & (US$ Million)
Figure 49. Columbia Nutritional Revenue Growth Rate in Complementary and Alternative Medicine Business (2020-2025)
Figure 50. Herb Pharm Revenue Growth Rate in Complementary and Alternative Medicine Business (2020-2025)
Figure 51. Herbal Hills Revenue Growth Rate in Complementary and Alternative Medicine Business (2020-2025)
Figure 52. Helio USA Revenue Growth Rate in Complementary and Alternative Medicine Business (2020-2025)
Figure 53. Deepure Plus Revenue Growth Rate in Complementary and Alternative Medicine Business (2020-2025)
Figure 54. Nordic Naturals Revenue Growth Rate in Complementary and Alternative Medicine Business (2020-2025)
Figure 55. Pure encapsulations Revenue Growth Rate in Complementary and Alternative Medicine Business (2020-2025)
Figure 56. Iyengar Yoga Institute Revenue Growth Rate in Complementary and Alternative Medicine Business (2020-2025)
Figure 57. John Schumacher’s Unity Woods Yoga Center Revenue Growth Rate in Complementary and Alternative Medicine Business (2020-2025)
Figure 58. Yoga Tree Revenue Growth Rate in Complementary and Alternative Medicine Business (2020-2025)
Figure 59. The Healing Company Revenue Growth Rate in Complementary and Alternative Medicine Business (2020-2025)
Figure 60. Quantum Touch Revenue Growth Rate in Complementary and Alternative Medicine Business (2020-2025)
Figure 61. Bottom-up and Top-down Approaches for This Report
Figure 62. Data Triangulation
Figure 63. Key Executives Interviewed