0
U.S. (TOLL FREE)
+1 (315) 215-3225
Automative

0
U.S. (TOLL FREE)
+1 (315) 215-3225
M-Commerce - Global Market Share and Ranking, Overall Sales and Demand Forecast 2024-2030
Published Date: September 2024
|
Report Code: QYRE-Auto-36L5978
Home | Market Reports | Computers & Electronics| Enterprise Technology
Global M Commerce Market Insights Forecast to 2028
BUY CHAPTERS

M-Commerce - Global Market Share and Ranking, Overall Sales and Demand Forecast 2024-2030

Code: QYRE-Auto-36L5978
Report
September 2024
Pages:157
QYResearch
Buy Now with 15% Discount
DESCRIPTION
TABLE OF CONTENT
TABLES & FIGURES

M-Commerce - Market Size

The global market for M-Commerce was estimated to be worth US$ 2319050 million in 2023 and is forecast to a readjusted size of US$ 7232480 million by 2030 with a CAGR of 17.3% during the forecast period 2024-2030

M-Commerce - Market

M-Commerce - Market

M Commerce is a type of e-commerce that is conducted on mobile devices with the help of telecommunications networks and other wired or wireless networking technologies.By adding functions such as information, entertainment and commerce, m-commerce provides end users with the ability to access the Internet from anywhere, anytime.
Technological innovation and launches in introducing new products is one of the driving factor

Report Scope

This report aims to provide a comprehensive presentation of the global market for M-Commerce, focusing on the total sales revenue, key companies market share and ranking, together with an analysis of M-Commerce by region & country, by Payment, and by Application.
The M-Commerce market size, estimations, and forecasts are provided in terms of sales revenue ($ millions), considering 2023 as the base year, with history and forecast data for the period from 2019 to 2030. With both quantitative and qualitative analysis, to help readers develop business/growth strategies, assess the market competitive situation, analyze their position in the current marketplace, and make informed business decisions regarding M-Commerce.
Market Segmentation

Scope of M-Commerce - Market Report

Report Metric Details
Report Name M-Commerce - Market
Forecasted market size in 2030 US$ 7232480 million
CAGR 17.3%
Forecasted years 2024 - 2030
Segment by Payment:
Segment by Application
By Region
  • North America (United States, Canada)
  • Europe (Germany, France, UK, Italy, Russia) Rest of Europe
  • Nordic Countries
  • Asia-Pacific (China, Japan, South Korea)
  • Southeast Asia (India, Australia)
  • Rest of Asia
  • Latin America (Mexico, Brazil)
  • Rest of Latin America
  • Middle East & Africa (Turkey, Saudi Arabia, UAE, Rest of MEA)
By Company Ericsson Inc, PayPal, Visa, MasterCard, IBM, Google, Mopay Inc, Oxygen8, SAP, Amazon, Apple Inc, Gemalto, Staples, Microsoft Corp, ASOS, eBay, Wal-Mart Stores, Zynga, Barnes & Noble, BlackBerry Ltd, Costco Wholesale Corp, Netflix, Office Depot, Target Corp, Rakuten, Sears Holdings Corp
Forecast units USD million in value
Report coverage Revenue and volume forecast, company share, competitive landscape, growth factors and trends

Chapter Outline

  • Chapter 1: Introduces the report scope of the report, global total market size. This chapter also provides the market dynamics, latest developments of the market, the driving factors and restrictive factors of the market, the challenges and risks faced by manufacturers in the industry, and the analysis of relevant policies in the industry.
  • Chapter 2: Detailed analysis of M-Commerce manufacturers competitive landscape, revenue market share, latest development plan, merger, and acquisition information, etc.
  • Chapter 3: Provides the analysis of various market segments by Payment, covering the market size and development potential of each market segment, to help readers find the blue ocean market in different market segments.
  • Chapter 4: Provides the analysis of various market segments by Application, covering the market size and development potential of each market segment, to help readers find the blue ocean market in different downstream markets.
  • Chapter 5: Revenue of M-Commerce in regional level. It provides a quantitative analysis of the market size and development potential of each region and introduces the market development, future development prospects, market space, and market size of each country in the world.
  • Chapter 6: Revenue of M-Commerce in country level. It provides sigmate data by Payment, and by Application for each country/region.
  • Chapter 7: Provides profiles of key players, introducing the basic situation of the main companies in the market in detail, including product revenue, gross margin, product introduction, recent development, etc.
  • Chapter 8: Analysis of industrial chain, including the upstream and downstream of the industry.
  • Chapter 9: Conclusion.

FAQ for this report

What is the M-Commerce - Market size in 2030?

Ans: The M-Commerce - Market size in 2030 will be US$ 7232480 million.

Who are the main players in the M-Commerce - Market report?

Ans: The main players in the M-Commerce - Market are Ericsson Inc, PayPal, Visa, MasterCard, IBM, Google, Mopay Inc, Oxygen8, SAP, Amazon, Apple Inc, Gemalto, Staples, Microsoft Corp, ASOS, eBay, Wal-Mart Stores, Zynga, Barnes & Noble, BlackBerry Ltd, Costco Wholesale Corp, Netflix, Office Depot, Target Corp, Rakuten, Sears Holdings Corp

What are the Application segmentation covered in the M-Commerce - Market report?

Ans: The Applications covered in the M-Commerce - Market report are Retail, Reservation/Ticket Booking, Bill Payments, Mobile Wallets, Others

Recommended Reports

Mobile Commerce Tech

Cross-Border Ecommerce

Mobile Healthcare

1 Market Overview
1.1 M-Commerce Product Introduction
1.2 Global M-Commerce Market Size Forecast
1.3 M-Commerce Market Trends & Drivers
1.3.1 M-Commerce Industry Trends
1.3.2 M-Commerce Market Drivers & Opportunity
1.3.3 M-Commerce Market Challenges
1.3.4 M-Commerce Market Restraints
1.4 Assumptions and Limitations
1.5 Study Objectives
1.6 Years Considered
2 Competitive Analysis by Company
2.1 Global M-Commerce Players Revenue Ranking (2023)
2.2 Global M-Commerce Revenue by Company (2019-2024)
2.3 Key Companies M-Commerce Manufacturing Base Distribution and Headquarters
2.4 Key Companies M-Commerce Product Offered
2.5 Key Companies Time to Begin Mass Production of M-Commerce
2.6 M-Commerce Market Competitive Analysis
2.6.1 M-Commerce Market Concentration Rate (2019-2024)
2.6.2 Global 5 and 10 Largest Companies by M-Commerce Revenue in 2023
2.6.3 Global Top Companies by Company Type (Tier 1, Tier 2, and Tier 3) & (based on the Revenue in M-Commerce as of 2023)
2.7 Mergers & Acquisitions, Expansion
3 Segmentation by Payment
3.1 Introduction by Payment
3.1.1 Near Field Communication (NFC)
3.1.2 Premium SMS
3.1.3 Wireless application protocol (WAP)
3.1.4 Direct Carrier Billing
3.2 Global M-Commerce Sales Value by Payment
3.2.1 Global M-Commerce Sales Value by Payment (2019 VS 2023 VS 2030)
3.2.2 Global M-Commerce Sales Value, by Payment (2019-2030)
3.2.3 Global M-Commerce Sales Value, by Payment (%) (2019-2030)
4 Segmentation by Application
4.1 Introduction by Application
4.1.1 Retail
4.1.2 Reservation/Ticket Booking
4.1.3 Bill Payments
4.1.4 Mobile Wallets
4.1.5 Others
4.2 Global M-Commerce Sales Value by Application
4.2.1 Global M-Commerce Sales Value by Application (2019 VS 2023 VS 2030)
4.2.2 Global M-Commerce Sales Value, by Application (2019-2030)
4.2.3 Global M-Commerce Sales Value, by Application (%) (2019-2030)
5 Segmentation by Region
5.1 Global M-Commerce Sales Value by Region
5.1.1 Global M-Commerce Sales Value by Region: 2019 VS 2023 VS 2030
5.1.2 Global M-Commerce Sales Value by Region (2019-2024)
5.1.3 Global M-Commerce Sales Value by Region (2025-2030)
5.1.4 Global M-Commerce Sales Value by Region (%), (2019-2030)
5.2 North America
5.2.1 North America M-Commerce Sales Value, 2019-2030
5.2.2 North America M-Commerce Sales Value by Country (%), 2023 VS 2030
5.3 Europe
5.3.1 Europe M-Commerce Sales Value, 2019-2030
5.3.2 Europe M-Commerce Sales Value by Country (%), 2023 VS 2030
5.4 Asia Pacific
5.4.1 Asia Pacific M-Commerce Sales Value, 2019-2030
5.4.2 Asia Pacific M-Commerce Sales Value by Country (%), 2023 VS 2030
5.5 South America
5.5.1 South America M-Commerce Sales Value, 2019-2030
5.5.2 South America M-Commerce Sales Value by Country (%), 2023 VS 2030
5.6 Middle East & Africa
5.6.1 Middle East & Africa M-Commerce Sales Value, 2019-2030
5.6.2 Middle East & Africa M-Commerce Sales Value by Country (%), 2023 VS 2030
6 Segmentation by Key Countries/Regions
6.1 Key Countries/Regions M-Commerce Sales Value Growth Trends, 2019 VS 2023 VS 2030
6.2 Key Countries/Regions M-Commerce Sales Value
6.3 United States
6.3.1 United States M-Commerce Sales Value, 2019-2030
6.3.2 United States M-Commerce Sales Value by Payment (%), 2023 VS 2030
6.3.3 United States M-Commerce Sales Value by Application, 2023 VS 2030
6.4 Europe
6.4.1 Europe M-Commerce Sales Value, 2019-2030
6.4.2 Europe M-Commerce Sales Value by Payment (%), 2023 VS 2030
6.4.3 Europe M-Commerce Sales Value by Application, 2023 VS 2030
6.5 China
6.5.1 China M-Commerce Sales Value, 2019-2030
6.5.2 China M-Commerce Sales Value by Payment (%), 2023 VS 2030
6.5.3 China M-Commerce Sales Value by Application, 2023 VS 2030
6.6 Japan
6.6.1 Japan M-Commerce Sales Value, 2019-2030
6.6.2 Japan M-Commerce Sales Value by Payment (%), 2023 VS 2030
6.6.3 Japan M-Commerce Sales Value by Application, 2023 VS 2030
6.7 South Korea
6.7.1 South Korea M-Commerce Sales Value, 2019-2030
6.7.2 South Korea M-Commerce Sales Value by Payment (%), 2023 VS 2030
6.7.3 South Korea M-Commerce Sales Value by Application, 2023 VS 2030
6.8 Southeast Asia
6.8.1 Southeast Asia M-Commerce Sales Value, 2019-2030
6.8.2 Southeast Asia M-Commerce Sales Value by Payment (%), 2023 VS 2030
6.8.3 Southeast Asia M-Commerce Sales Value by Application, 2023 VS 2030
6.9 India
6.9.1 India M-Commerce Sales Value, 2019-2030
6.9.2 India M-Commerce Sales Value by Payment (%), 2023 VS 2030
6.9.3 India M-Commerce Sales Value by Application, 2023 VS 2030
7 Company Profiles
7.1 Ericsson Inc
7.1.1 Ericsson Inc Profile
7.1.2 Ericsson Inc Main Business
7.1.3 Ericsson Inc M-Commerce Products, Services and Solutions
7.1.4 Ericsson Inc M-Commerce Revenue (US$ Million) & (2019-2024)
7.1.5 Ericsson Inc Recent Developments
7.2 PayPal
7.2.1 PayPal Profile
7.2.2 PayPal Main Business
7.2.3 PayPal M-Commerce Products, Services and Solutions
7.2.4 PayPal M-Commerce Revenue (US$ Million) & (2019-2024)
7.2.5 PayPal Recent Developments
7.3 Visa
7.3.1 Visa Profile
7.3.2 Visa Main Business
7.3.3 Visa M-Commerce Products, Services and Solutions
7.3.4 Visa M-Commerce Revenue (US$ Million) & (2019-2024)
7.3.5 MasterCard Recent Developments
7.4 MasterCard
7.4.1 MasterCard Profile
7.4.2 MasterCard Main Business
7.4.3 MasterCard M-Commerce Products, Services and Solutions
7.4.4 MasterCard M-Commerce Revenue (US$ Million) & (2019-2024)
7.4.5 MasterCard Recent Developments
7.5 IBM
7.5.1 IBM Profile
7.5.2 IBM Main Business
7.5.3 IBM M-Commerce Products, Services and Solutions
7.5.4 IBM M-Commerce Revenue (US$ Million) & (2019-2024)
7.5.5 IBM Recent Developments
7.6 Google
7.6.1 Google Profile
7.6.2 Google Main Business
7.6.3 Google M-Commerce Products, Services and Solutions
7.6.4 Google M-Commerce Revenue (US$ Million) & (2019-2024)
7.6.5 Google Recent Developments
7.7 Mopay Inc
7.7.1 Mopay Inc Profile
7.7.2 Mopay Inc Main Business
7.7.3 Mopay Inc M-Commerce Products, Services and Solutions
7.7.4 Mopay Inc M-Commerce Revenue (US$ Million) & (2019-2024)
7.7.5 Mopay Inc Recent Developments
7.8 Oxygen8
7.8.1 Oxygen8 Profile
7.8.2 Oxygen8 Main Business
7.8.3 Oxygen8 M-Commerce Products, Services and Solutions
7.8.4 Oxygen8 M-Commerce Revenue (US$ Million) & (2019-2024)
7.8.5 Oxygen8 Recent Developments
7.9 SAP
7.9.1 SAP Profile
7.9.2 SAP Main Business
7.9.3 SAP M-Commerce Products, Services and Solutions
7.9.4 SAP M-Commerce Revenue (US$ Million) & (2019-2024)
7.9.5 SAP Recent Developments
7.10 Amazon
7.10.1 Amazon Profile
7.10.2 Amazon Main Business
7.10.3 Amazon M-Commerce Products, Services and Solutions
7.10.4 Amazon M-Commerce Revenue (US$ Million) & (2019-2024)
7.10.5 Amazon Recent Developments
7.11 Apple Inc
7.11.1 Apple Inc Profile
7.11.2 Apple Inc Main Business
7.11.3 Apple Inc M-Commerce Products, Services and Solutions
7.11.4 Apple Inc M-Commerce Revenue (US$ Million) & (2019-2024)
7.11.5 Apple Inc Recent Developments
7.12 Gemalto
7.12.1 Gemalto Profile
7.12.2 Gemalto Main Business
7.12.3 Gemalto M-Commerce Products, Services and Solutions
7.12.4 Gemalto M-Commerce Revenue (US$ Million) & (2019-2024)
7.12.5 Gemalto Recent Developments
7.13 Staples
7.13.1 Staples Profile
7.13.2 Staples Main Business
7.13.3 Staples M-Commerce Products, Services and Solutions
7.13.4 Staples M-Commerce Revenue (US$ Million) & (2019-2024)
7.13.5 Staples Recent Developments
7.14 Microsoft Corp
7.14.1 Microsoft Corp Profile
7.14.2 Microsoft Corp Main Business
7.14.3 Microsoft Corp M-Commerce Products, Services and Solutions
7.14.4 Microsoft Corp M-Commerce Revenue (US$ Million) & (2019-2024)
7.14.5 Microsoft Corp Recent Developments
7.15 ASOS
7.15.1 ASOS Profile
7.15.2 ASOS Main Business
7.15.3 ASOS M-Commerce Products, Services and Solutions
7.15.4 ASOS M-Commerce Revenue (US$ Million) & (2019-2024)
7.15.5 ASOS Recent Developments
7.16 eBay
7.16.1 eBay Profile
7.16.2 eBay Main Business
7.16.3 eBay M-Commerce Products, Services and Solutions
7.16.4 eBay M-Commerce Revenue (US$ Million) & (2019-2024)
7.16.5 eBay Recent Developments
7.17 Wal-Mart Stores
7.17.1 Wal-Mart Stores Profile
7.17.2 Wal-Mart Stores Main Business
7.17.3 Wal-Mart Stores M-Commerce Products, Services and Solutions
7.17.4 Wal-Mart Stores M-Commerce Revenue (US$ Million) & (2019-2024)
7.17.5 Wal-Mart Stores Recent Developments
7.18 Zynga
7.18.1 Zynga Profile
7.18.2 Zynga Main Business
7.18.3 Zynga M-Commerce Products, Services and Solutions
7.18.4 Zynga M-Commerce Revenue (US$ Million) & (2019-2024)
7.18.5 Zynga Recent Developments
7.19 Barnes & Noble
7.19.1 Barnes & Noble Profile
7.19.2 Barnes & Noble Main Business
7.19.3 Barnes & Noble M-Commerce Products, Services and Solutions
7.19.4 Barnes & Noble M-Commerce Revenue (US$ Million) & (2019-2024)
7.19.5 Barnes & Noble Recent Developments
7.20 BlackBerry Ltd
7.20.1 BlackBerry Ltd Profile
7.20.2 BlackBerry Ltd Main Business
7.20.3 BlackBerry Ltd M-Commerce Products, Services and Solutions
7.20.4 BlackBerry Ltd M-Commerce Revenue (US$ Million) & (2019-2024)
7.20.5 BlackBerry Ltd Recent Developments
7.21 Costco Wholesale Corp
7.21.1 Costco Wholesale Corp Profile
7.21.2 Costco Wholesale Corp Main Business
7.21.3 Costco Wholesale Corp M-Commerce Products, Services and Solutions
7.21.4 Costco Wholesale Corp M-Commerce Revenue (US$ Million) & (2019-2024)
7.21.5 Costco Wholesale Corp Recent Developments
7.22 Netflix
7.22.1 Netflix Profile
7.22.2 Netflix Main Business
7.22.3 Netflix M-Commerce Products, Services and Solutions
7.22.4 Netflix M-Commerce Revenue (US$ Million) & (2019-2024)
7.22.5 Netflix Recent Developments
7.23 Office Depot
7.23.1 Office Depot Profile
7.23.2 Office Depot Main Business
7.23.3 Office Depot M-Commerce Products, Services and Solutions
7.23.4 Office Depot M-Commerce Revenue (US$ Million) & (2019-2024)
7.23.5 Office Depot Recent Developments
7.24 Target Corp
7.24.1 Target Corp Profile
7.24.2 Target Corp Main Business
7.24.3 Target Corp M-Commerce Products, Services and Solutions
7.24.4 Target Corp M-Commerce Revenue (US$ Million) & (2019-2024)
7.24.5 Target Corp Recent Developments
7.25 Rakuten
7.25.1 Rakuten Profile
7.25.2 Rakuten Main Business
7.25.3 Rakuten M-Commerce Products, Services and Solutions
7.25.4 Rakuten M-Commerce Revenue (US$ Million) & (2019-2024)
7.25.5 Rakuten Recent Developments
7.26 Sears Holdings Corp
7.26.1 Sears Holdings Corp Profile
7.26.2 Sears Holdings Corp Main Business
7.26.3 Sears Holdings Corp M-Commerce Products, Services and Solutions
7.26.4 Sears Holdings Corp M-Commerce Revenue (US$ Million) & (2019-2024)
7.26.5 Sears Holdings Corp Recent Developments
8 Industry Chain Analysis
8.1 M-Commerce Industrial Chain
8.2 M-Commerce Upstream Analysis
8.2.1 Key Raw Materials
8.2.2 Raw Materials Key Suppliers
8.2.3 Manufacturing Cost Structure
8.3 Midstream Analysis
8.4 Downstream Analysis (Customers Analysis)
8.5 Sales Model and Sales Channels
8.5.1 M-Commerce Sales Model
8.5.2 Sales Channel
8.5.3 M-Commerce Distributors
9 Research Findings and Conclusion
10 Appendix
10.1 Research Methodology
10.1.1 Methodology/Research Approach
10.1.2 Data Source
10.2 Author Details
10.3 Disclaimer
List of Tables
    Table 1. M-Commerce Market Trends
    Table 2. M-Commerce Market Drivers & Opportunity
    Table 3. M-Commerce Market Challenges
    Table 4. M-Commerce Market Restraints
    Table 5. Global M-Commerce Revenue by Company (2019-2024) & (US$ Million)
    Table 6. Global M-Commerce Revenue Market Share by Company (2019-2024)
    Table 7. Key Companies M-Commerce Manufacturing Base Distribution and Headquarters
    Table 8. Key Companies M-Commerce Product Type
    Table 9. Key Companies Time to Begin Mass Production of M-Commerce
    Table 10. Global M-Commerce Companies Market Concentration Ratio (CR5 and HHI)
    Table 11. Global Top Companies Market Share by Company Type (Tier 1, Tier 2, and Tier 3) & (based on the Revenue in M-Commerce as of 2023)
    Table 12. Mergers & Acquisitions, Expansion Plans
    Table 13. Global M-Commerce Sales Value by Payment: 2019 VS 2023 VS 2030 (US$ Million)
    Table 14. Global M-Commerce Sales Value by Payment (2019-2024) & (US$ Million)
    Table 15. Global M-Commerce Sales Value by Payment (2025-2030) & (US$ Million)
    Table 16. Global M-Commerce Sales Market Share in Value by Payment (2019-2024) & (%)
    Table 17. Global M-Commerce Sales Market Share in Value by Payment (2025-2030) & (%)
    Table 18. Global M-Commerce Sales Value by Application: 2019 VS 2023 VS 2030 (US$ Million)
    Table 19. Global M-Commerce Sales Value by Application (2019-2024) & (US$ Million)
    Table 20. Global M-Commerce Sales Value by Application (2025-2030) & (US$ Million)
    Table 21. Global M-Commerce Sales Market Share in Value by Application (2019-2024) & (%)
    Table 22. Global M-Commerce Sales Market Share in Value by Application (2025-2030) & (%)
    Table 23. Global M-Commerce Sales Value by Region: 2019 VS 2023 VS 2030 (US$ Million)
    Table 24. Global M-Commerce Sales Value by Region (2019-2024) & (US$ Million)
    Table 25. Global M-Commerce Sales Value by Region (2025-2030) & (US$ Million)
    Table 26. Global M-Commerce Sales Value by Region (2019-2024) & (%)
    Table 27. Global M-Commerce Sales Value by Region (2025-2030) & (%)
    Table 28. Key Countries/Regions M-Commerce Sales Value Growth Trends, (US$ Million): 2019 VS 2023 VS 2030
    Table 29. Key Countries/Regions M-Commerce Sales Value, (2019-2024) & (US$ Million)
    Table 30. Key Countries/Regions M-Commerce Sales Value, (2025-2030) & (US$ Million)
    Table 31. Ericsson Inc Basic Information List
    Table 32. Ericsson Inc Description and Business Overview
    Table 33. Ericsson Inc M-Commerce Products, Services and Solutions
    Table 34. Revenue (US$ Million) in M-Commerce Business of Ericsson Inc (2019-2024)
    Table 35. Ericsson Inc Recent Developments
    Table 36. PayPal Basic Information List
    Table 37. PayPal Description and Business Overview
    Table 38. PayPal M-Commerce Products, Services and Solutions
    Table 39. Revenue (US$ Million) in M-Commerce Business of PayPal (2019-2024)
    Table 40. PayPal Recent Developments
    Table 41. Visa Basic Information List
    Table 42. Visa Description and Business Overview
    Table 43. Visa M-Commerce Products, Services and Solutions
    Table 44. Revenue (US$ Million) in M-Commerce Business of Visa (2019-2024)
    Table 45. Visa Recent Developments
    Table 46. MasterCard Basic Information List
    Table 47. MasterCard Description and Business Overview
    Table 48. MasterCard M-Commerce Products, Services and Solutions
    Table 49. Revenue (US$ Million) in M-Commerce Business of MasterCard (2019-2024)
    Table 50. MasterCard Recent Developments
    Table 51. IBM Basic Information List
    Table 52. IBM Description and Business Overview
    Table 53. IBM M-Commerce Products, Services and Solutions
    Table 54. Revenue (US$ Million) in M-Commerce Business of IBM (2019-2024)
    Table 55. IBM Recent Developments
    Table 56. Google Basic Information List
    Table 57. Google Description and Business Overview
    Table 58. Google M-Commerce Products, Services and Solutions
    Table 59. Revenue (US$ Million) in M-Commerce Business of Google (2019-2024)
    Table 60. Google Recent Developments
    Table 61. Mopay Inc Basic Information List
    Table 62. Mopay Inc Description and Business Overview
    Table 63. Mopay Inc M-Commerce Products, Services and Solutions
    Table 64. Revenue (US$ Million) in M-Commerce Business of Mopay Inc (2019-2024)
    Table 65. Mopay Inc Recent Developments
    Table 66. Oxygen8 Basic Information List
    Table 67. Oxygen8 Description and Business Overview
    Table 68. Oxygen8 M-Commerce Products, Services and Solutions
    Table 69. Revenue (US$ Million) in M-Commerce Business of Oxygen8 (2019-2024)
    Table 70. Oxygen8 Recent Developments
    Table 71. SAP Basic Information List
    Table 72. SAP Description and Business Overview
    Table 73. SAP M-Commerce Products, Services and Solutions
    Table 74. Revenue (US$ Million) in M-Commerce Business of SAP (2019-2024)
    Table 75. SAP Recent Developments
    Table 76. Amazon Basic Information List
    Table 77. Amazon Description and Business Overview
    Table 78. Amazon M-Commerce Products, Services and Solutions
    Table 79. Revenue (US$ Million) in M-Commerce Business of Amazon (2019-2024)
    Table 80. Amazon Recent Developments
    Table 81. Apple Inc Basic Information List
    Table 82. Apple Inc Description and Business Overview
    Table 83. Apple Inc M-Commerce Products, Services and Solutions
    Table 84. Revenue (US$ Million) in M-Commerce Business of Apple Inc (2019-2024)
    Table 85. Apple Inc Recent Developments
    Table 86. Gemalto Basic Information List
    Table 87. Gemalto Description and Business Overview
    Table 88. Gemalto M-Commerce Products, Services and Solutions
    Table 89. Revenue (US$ Million) in M-Commerce Business of Gemalto (2019-2024)
    Table 90. Gemalto Recent Developments
    Table 91. Staples Basic Information List
    Table 92. Staples Description and Business Overview
    Table 93. Staples M-Commerce Products, Services and Solutions
    Table 94. Revenue (US$ Million) in M-Commerce Business of Staples (2019-2024)
    Table 95. Staples Recent Developments
    Table 96. Microsoft Corp Basic Information List
    Table 97. Microsoft Corp Description and Business Overview
    Table 98. Microsoft Corp M-Commerce Products, Services and Solutions
    Table 99. Revenue (US$ Million) in M-Commerce Business of Microsoft Corp (2019-2024)
    Table 100. Microsoft Corp Recent Developments
    Table 101. ASOS Basic Information List
    Table 102. ASOS Description and Business Overview
    Table 103. ASOS M-Commerce Products, Services and Solutions
    Table 104. Revenue (US$ Million) in M-Commerce Business of ASOS (2019-2024)
    Table 105. ASOS Recent Developments
    Table 106. eBay Basic Information List
    Table 107. eBay Description and Business Overview
    Table 108. eBay M-Commerce Products, Services and Solutions
    Table 109. Revenue (US$ Million) in M-Commerce Business of eBay (2019-2024)
    Table 110. eBay Recent Developments
    Table 111. Wal-Mart Stores Basic Information List
    Table 112. Wal-Mart Stores Description and Business Overview
    Table 113. Wal-Mart Stores M-Commerce Products, Services and Solutions
    Table 114. Revenue (US$ Million) in M-Commerce Business of Wal-Mart Stores (2019-2024)
    Table 115. Wal-Mart Stores Recent Developments
    Table 116. Zynga Basic Information List
    Table 117. Zynga Description and Business Overview
    Table 118. Zynga M-Commerce Products, Services and Solutions
    Table 119. Revenue (US$ Million) in M-Commerce Business of Zynga (2019-2024)
    Table 120. Zynga Recent Developments
    Table 121. Barnes & Noble Basic Information List
    Table 122. Barnes & Noble Description and Business Overview
    Table 123. Barnes & Noble M-Commerce Products, Services and Solutions
    Table 124. Revenue (US$ Million) in M-Commerce Business of Barnes & Noble (2019-2024)
    Table 125. Barnes & Noble Recent Developments
    Table 126. BlackBerry Ltd Basic Information List
    Table 127. BlackBerry Ltd Description and Business Overview
    Table 128. BlackBerry Ltd M-Commerce Products, Services and Solutions
    Table 129. Revenue (US$ Million) in M-Commerce Business of BlackBerry Ltd (2019-2024)
    Table 130. BlackBerry Ltd Recent Developments
    Table 131. Costco Wholesale Corp Basic Information List
    Table 132. Costco Wholesale Corp Description and Business Overview
    Table 133. Costco Wholesale Corp M-Commerce Products, Services and Solutions
    Table 134. Revenue (US$ Million) in M-Commerce Business of Costco Wholesale Corp (2019-2024)
    Table 135. Costco Wholesale Corp Recent Developments
    Table 136. Netflix Basic Information List
    Table 137. Netflix Description and Business Overview
    Table 138. Netflix M-Commerce Products, Services and Solutions
    Table 139. Revenue (US$ Million) in M-Commerce Business of Netflix (2019-2024)
    Table 140. Netflix Recent Developments
    Table 141. Office Depot Basic Information List
    Table 142. Office Depot Description and Business Overview
    Table 143. Office Depot M-Commerce Products, Services and Solutions
    Table 144. Revenue (US$ Million) in M-Commerce Business of Office Depot (2019-2024)
    Table 145. Office Depot Recent Developments
    Table 146. Target Corp Basic Information List
    Table 147. Target Corp Description and Business Overview
    Table 148. Target Corp M-Commerce Products, Services and Solutions
    Table 149. Revenue (US$ Million) in M-Commerce Business of Target Corp (2019-2024)
    Table 150. Target Corp Recent Developments
    Table 151. Rakuten Basic Information List
    Table 152. Rakuten Description and Business Overview
    Table 153. Rakuten M-Commerce Products, Services and Solutions
    Table 154. Revenue (US$ Million) in M-Commerce Business of Rakuten (2019-2024)
    Table 155. Rakuten Recent Developments
    Table 156. Sears Holdings Corp Basic Information List
    Table 157. Sears Holdings Corp Description and Business Overview
    Table 158. Sears Holdings Corp M-Commerce Products, Services and Solutions
    Table 159. Revenue (US$ Million) in M-Commerce Business of Sears Holdings Corp (2019-2024)
    Table 160. Sears Holdings Corp Recent Developments
    Table 161. Key Raw Materials Lists
    Table 162. Raw Materials Key Suppliers Lists
    Table 163. M-Commerce Downstream Customers
    Table 164. M-Commerce Distributors List
    Table 165. Research Programs/Design for This Report
    Table 166. Key Data Information from Secondary Sources
    Table 167. Key Data Information from Primary Sources
    Table 168. Business Unit and Senior & Team Lead Analysts
List of Figures
    Figure 1. M-Commerce Product Picture
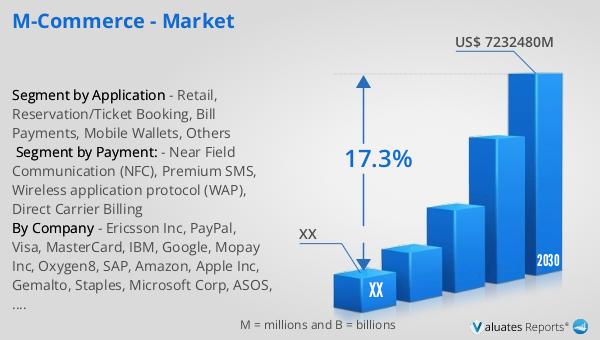
    Figure 2. Global M-Commerce Sales Value, 2019 VS 2023 VS 2030 (US$ Million)
    Figure 3. Global M-Commerce Sales Value (2019-2030) & (US$ Million)
    Figure 4. M-Commerce Report Years Considered
    Figure 5. Global M-Commerce Players Revenue Ranking (2023) & (US$ Million)
    Figure 6. The 5 and 10 Largest Manufacturers in the World: Market Share by M-Commerce Revenue in 2023
    Figure 7. M-Commerce Market Share by Company Type (Tier 1, Tier 2, and Tier 3): 2019 VS 2023
    Figure 8. Near Field Communication (NFC) Picture
    Figure 9. Premium SMS Picture
    Figure 10. Wireless application protocol (WAP) Picture
    Figure 11. Direct Carrier Billing Picture
    Figure 12. Global M-Commerce Sales Value by Payment (2019 VS 2023 VS 2030) & (US$ Million)
    Figure 13. Global M-Commerce Sales Value Market Share by Payment, 2023 & 2030
    Figure 14. Product Picture of Retail
    Figure 15. Product Picture of Reservation/Ticket Booking
    Figure 16. Product Picture of Bill Payments
    Figure 17. Product Picture of Mobile Wallets
    Figure 18. Product Picture of Others
    Figure 19. Global M-Commerce Sales Value by Application (2019 VS 2023 VS 2030) & (US$ Million)
    Figure 20. Global M-Commerce Sales Value Market Share by Application, 2023 & 2030
    Figure 21. North America M-Commerce Sales Value (2019-2030) & (US$ Million)
    Figure 22. North America M-Commerce Sales Value by Country (%), 2023 VS 2030
    Figure 23. Europe M-Commerce Sales Value (2019-2030) & (US$ Million)
    Figure 24. Europe M-Commerce Sales Value by Country (%), 2023 VS 2030
    Figure 25. Asia Pacific M-Commerce Sales Value (2019-2030) & (US$ Million)
    Figure 26. Asia Pacific M-Commerce Sales Value by Country (%), 2023 VS 2030
    Figure 27. South America M-Commerce Sales Value (2019-2030) & (US$ Million)
    Figure 28. South America M-Commerce Sales Value by Country (%), 2023 VS 2030
    Figure 29. Middle East & Africa M-Commerce Sales Value (2019-2030) & (US$ Million)
    Figure 30. Middle East & Africa M-Commerce Sales Value by Country (%), 2023 VS 2030
    Figure 31. Key Countries/Regions M-Commerce Sales Value (%), (2019-2030)
    Figure 32. United States M-Commerce Sales Value, (2019-2030) & (US$ Million)
    Figure 33. United States M-Commerce Sales Value by Payment (%), 2023 VS 2030
    Figure 34. United States M-Commerce Sales Value by Application (%), 2023 VS 2030
    Figure 35. Europe M-Commerce Sales Value, (2019-2030) & (US$ Million)
    Figure 36. Europe M-Commerce Sales Value by Payment (%), 2023 VS 2030
    Figure 37. Europe M-Commerce Sales Value by Application (%), 2023 VS 2030
    Figure 38. China M-Commerce Sales Value, (2019-2030) & (US$ Million)
    Figure 39. China M-Commerce Sales Value by Payment (%), 2023 VS 2030
    Figure 40. China M-Commerce Sales Value by Application (%), 2023 VS 2030
    Figure 41. Japan M-Commerce Sales Value, (2019-2030) & (US$ Million)
    Figure 42. Japan M-Commerce Sales Value by Payment (%), 2023 VS 2030
    Figure 43. Japan M-Commerce Sales Value by Application (%), 2023 VS 2030
    Figure 44. South Korea M-Commerce Sales Value, (2019-2030) & (US$ Million)
    Figure 45. South Korea M-Commerce Sales Value by Payment (%), 2023 VS 2030
    Figure 46. South Korea M-Commerce Sales Value by Application (%), 2023 VS 2030
    Figure 47. Southeast Asia M-Commerce Sales Value, (2019-2030) & (US$ Million)
    Figure 48. Southeast Asia M-Commerce Sales Value by Payment (%), 2023 VS 2030
    Figure 49. Southeast Asia M-Commerce Sales Value by Application (%), 2023 VS 2030
    Figure 50. India M-Commerce Sales Value, (2019-2030) & (US$ Million)
    Figure 51. India M-Commerce Sales Value by Payment (%), 2023 VS 2030
    Figure 52. India M-Commerce Sales Value by Application (%), 2023 VS 2030
    Figure 53. M-Commerce Industrial Chain
    Figure 54. M-Commerce Manufacturing Cost Structure
    Figure 55. Channels of Distribution (Direct Sales, and Distribution)
    Figure 56. Bottom-up and Top-down Approaches for This Report
    Figure 57. Data Triangulation
SELECT A FORMAT
Added to Cart
Electronic (PDF)

$3950

This license allows only one user to access the PDF.
Electronic (PDF)

$5925

This license allows 1 - 5 user to access the PDF, license is suitable for small groups of 5 users working together
Electronic (PDF)

$7900

This license allows users/teams in a same Enterprise to use this report, various departments within an enterpise can use this report
Add to Cart
Buy Now (15% Discount)

OUR CUSTOMER

SecuX Technology Inc