
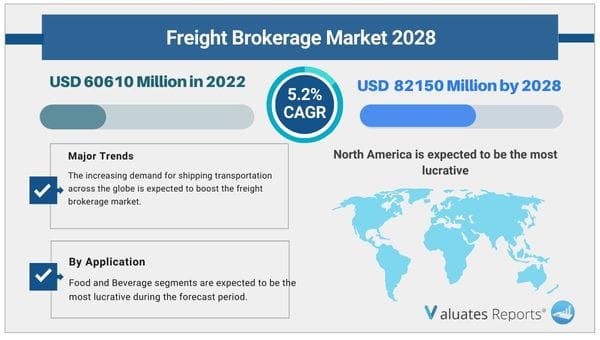
Freight Brokerage market is projected to reach US$ 82150 million by 2028 from an estimated US$ 60610 million in 2022, at a CAGR of 5.2% during 2023 and 2028. Key drivers of the freight brokerage market include the growing demand for shipping transportation due to the rising e-commerce industry across the world. Further, the rising usage of smartphones, growing wireless connectivity, and advantages provided by digital platforms are going to drive the growth of the freight brokerage market during the forecast period. Moreover, rapid integration of technology and growth in the number of licensed brokers will accelerate the market growth in the coming years.
Growing demand for shipping transportation
Shipping or intermodal transportation is going to increase manifold in the coming years. As eCommerce has created a global disruption in the supply chain and industrial transportation networks the demand for fast and efficient shipping of goods is rising. Intermodal transportation is a combination of two or more different shipping modes such as ships, aircraft, trucks, trains which enable efficient and cost-effective delivery of goods for shippers, carriers, and other stakeholders in the supply chain industry. Thus growing shipping transportation will create lucrative opportunities for the growth of the freight brokerage market during the forecast period.
Rising usage of smartphones and digital transformation
Freight transactions create an enormous amount of data that can be automated easily through digital platforms. The various benefits offered by digital platforms include track and trace, automated pricing, digital document storage, push notifications, communication via an app, more accuracy, reduced costs to both shippers and carriers, etc. Thus growing smartphone usage along with digital transformation has led to the creation of mobile/web-based platforms which are enhancing the efficiency of freight transportation ultimately driving the growth of the freight brokerage market.
Integration of technology and a growing number of licensed brokers
Freight brokers provide a range of benefits to shippers and carriers by creating more efficient routes and arranging more backhauls thereby each vehicle is able to accomplish more on fewer resources ultimately reducing costs. Further with the integration of technology transactions and processes are automated improving efficiency. Also with new digital entrants in the freight brokerage industry such as Convoy, Uship, etc, the number of licensed brokers is only going to increase in the coming years. Thus rapid integration of technology along with the growing number of licensed brokers is expected to accelerate the growth of the freight brokerage market during the forecast period.
Based on region, United States is the largest market, with a share over 70%, followed by China, and Europe, both have a share about 15 percent.
In terms of product, Truckload is the largest segment, with a share about 60%.
And in terms of application, the largest application is Food and Beverage, followed by Retail, Manufacturing, Auto and Industrial, etc.
Global Freight Brokerage key players include C.H. Robinson, Expeditors, Landstar System, TQL, etc. Global top four manufacturers hold a share about 60%.
In the competitive analysis section of the report, leading as well as prominent players of the global Freight Brokerage market are broadly studied on the basis of key factors. The report offers comprehensive analysis and accurate statistics on revenue by the player for the period 2016-2021. It also offers detailed analysis supported by reliable statistics on price and revenue (global level) by player for the period 2016-2021.
| Report Metric | Details |
| Report Name | Freight Brokerage Market |
| The market size in 2022 | USD 60610 Million |
| The revenue forecast in 2028 | USD 82150 Million |
| Growth Rate | Compound Annual Growth Rate (CAGR) of 5.2% from 2023 to 2028 |
| Market size available for years | 2023-2028 |
| Forecast units | Value (USD) |
| Segments covered | Type, Application and Region |
| Report coverage | Revenue & volume forecast, company share, competitive landscape, growth factors, and trends |
| Geographic regions covered | North America, Europe, Asia Pacific, Latin America, Middle East & Africa |
Ans. Considering the economic change due to COVID-19 and Russia-Ukraine War Influence, the global Freight Brokerage market is projected to reach US$ 82150 million by 2028 from an estimated US$ 60610 million in 2022, at a CAGR of 5.2% during 2023 and 2028.
Ans. The global Freight Brokerage market size is expected to grow at a compound annual growth rate of 5.2% from 2023 to 2028.
Ans. C.H. Robinson, Expeditors, Landstar System, TQL, Coyote Logistics, XPO Logistics, Yusen Logistics, Echo Global Logistics, JB Hunt Transport, Worldwide Express, Hub Group, GlobalTranz Enterprises, Allen Lund, Transplace, Werner Logistics, BNSF Logistics.
List of Tables
Table 1. Global Freight Brokerage Market Size Growth Rate by Type (US$ Million): 2017 VS 2021 VS 2028
Table 2. Major Companies of Truckload
Table 3. Major Companies of LTL
Table 4. Major Companies of Other
Table 5. Global Freight Brokerage Market Size Growth by Application (US$ Million): 2017 VS 2021 VS 2028
Table 6. Global Freight Brokerage Market Size by Region (US$ Million): 2022 VS 2028
Table 7. Global Freight Brokerage Revenue by Region (2017-2022) & (US$ Million)
Table 8. Global Freight Brokerage Revenue Forecast by Region (2023-2028) & (US$ Million)
Table 9. Freight Brokerage Revenue by Company (2017-2022) & (US$ Million)
Table 10. Freight Brokerage Revenue Share by Company (2017-2022)
Table 11. Ranking of Global Top Freight Brokerage Players by Revenue (US$ Million) in 2021
Table 12. Global Freight Brokerage Companies Market Concentration Ratio (CR5 and HHI) & (2017-2022)
Table 13. Global Freight Brokerage by Company Type (Tier 1, Tier 2 and Tier 3) & (based on the Revenue in Freight Brokerage as of 2021)
Table 14. Global Freight Brokerage Companies Headquarters
Table 15. Global Freight Brokerage Companies Product & Service
Table 16. Date of International Companies Enter into Freight Brokerage Market
Table 17. Global Freight Brokerage Mergers & Acquisitions, Expansion Plans
Table 18. C.H. Robinson Corporation Information
Table 19. C.H. Robinson Description and Business Overview
Table 20. C.H. Robinson Freight Brokerage Revenue (US$ Million) and Gross Margin (2017-2022)
Table 21. C.H. Robinson Freight Brokerage Product
Table 22. C.H. Robinson Freight Brokerage Revenue Proportion of Freight Brokerage by Product in 2021
Table 23. C.H. Robinson Freight Brokerage Revenue Proportion of Freight Brokerage by Application in 2021
Table 24. C.H. Robinson Freight Brokerage Revenue Proportion of Freight Brokerage by Geographic Area in 2021
Table 25. C.H. Robinson Recent Development
Table 26. Expeditors Corporation Information
Table 27. Expeditors Description and Business Overview
Table 28. Expeditors Freight Brokerage Revenue (US$ Million) and Gross Margin (2017-2022)
Table 29. Expeditors Freight Brokerage Product
Table 30. Expeditors Freight Brokerage Revenue Proportion of Freight Brokerage by Product in 2021
Table 31. Expeditors Freight Brokerage Revenue Proportion of Freight Brokerage by Application in 2021
Table 32. Expeditors Freight Brokerage Revenue Proportion of Freight Brokerage by Geographic Area in 2021
Table 33. Expeditors Recent Development
Table 34. Landstar System Corporation Information
Table 35. Landstar System Description and Business Overview
Table 36. Landstar System Freight Brokerage Revenue (US$ Million) and Gross Margin (2017-2022)
Table 37. Landstar System Freight Brokerage Product
Table 38. Landstar System Freight Brokerage Revenue Proportion of Freight Brokerage by Product in 2021
Table 39. Landstar System Freight Brokerage Revenue Proportion of Freight Brokerage by Application in 2021
Table 40. Landstar System Freight Brokerage Revenue Proportion of Freight Brokerage by Geographic Area in 2021
Table 41. Landstar System Recent Development
Table 42. TQL Corporation Information
Table 43. TQL Description and Business Overview
Table 44. TQL Freight Brokerage Revenue (US$ Million) and Gross Margin (2017-2022)
Table 45. TQL Freight Brokerage Product
Table 46. TQL Freight Brokerage Revenue Proportion of Freight Brokerage by Product in 2021
Table 47. TQL Freight Brokerage Revenue Proportion of Freight Brokerage by Application in 2021
Table 48. TQL Freight Brokerage Revenue Proportion of Freight Brokerage by Geographic Area in 2021
Table 49. TQL Recent Development
Table 50. Coyote Logistics Corporation Information
Table 51. Coyote Logistics Description and Business Overview
Table 52. Coyote Logistics Freight Brokerage Revenue (US$ Million) and Gross Margin (2017-2022)
Table 53. Coyote Logistics Freight Brokerage Product
Table 54. Coyote Logistics Freight Brokerage Revenue Proportion of Freight Brokerage by Product in 2021
Table 55. Coyote Logistics Freight Brokerage Revenue Proportion of Freight Brokerage by Application in 2021
Table 56. Coyote Logistics Freight Brokerage Revenue Proportion of Freight Brokerage by Geographic Area in 2021
Table 57. Coyote Logistics Recent Development
Table 58. XPO Logistics Corporation Information
Table 59. XPO Logistics Description and Business Overview
Table 60. XPO Logistics Freight Brokerage Revenue (US$ Million) and Gross Margin (2017-2022)
Table 61. XPO Logistics Freight Brokerage Product
Table 62. XPO Logistics Freight Brokerage Revenue Proportion of Freight Brokerage by Product in 2021
Table 63. XPO Logistics Freight Brokerage Revenue Proportion of Freight Brokerage by Application in 2021
Table 64. XPO Logistics Freight Brokerage Revenue Proportion of Freight Brokerage by Geographic Area in 2021
Table 65. Yusen Logistics Corporation Information
Table 66. Yusen Logistics Description and Business Overview
Table 67. Yusen Logistics Freight Brokerage Revenue (US$ Million) and Gross Margin (2017-2022)
Table 68. Yusen Logistics Freight Brokerage Product
Table 69. Yusen Logistics Freight Brokerage Revenue Proportion of Freight Brokerage by Product in 2021
Table 70. Yusen Logistics Freight Brokerage Revenue Proportion of Freight Brokerage by Application in 2021
Table 71. Yusen Logistics Freight Brokerage Revenue Proportion of Freight Brokerage by Geographic Area in 2021
Table 72. Echo Global Logistics Corporation Information
Table 73. Echo Global Logistics Description and Business Overview
Table 74. Echo Global Logistics Freight Brokerage Revenue (US$ Million) and Gross Margin (2017-2022)
Table 75. Echo Global Logistics Freight Brokerage Product
Table 76. Echo Global Logistics Freight Brokerage Revenue Proportion of Freight Brokerage by Product in 2021
Table 77. Echo Global Logistics Freight Brokerage Revenue Proportion of Freight Brokerage by Application in 2021
Table 78. Echo Global Logistics Freight Brokerage Revenue Proportion of Freight Brokerage by Geographic Area in 2021
Table 79. JB Hunt Transport Corporation Information
Table 80. JB Hunt Transport Description and Business Overview
Table 81. JB Hunt Transport Freight Brokerage Revenue (US$ Million) and Gross Margin (2017-2022)
Table 82. JB Hunt Transport Freight Brokerage Product
Table 83. JB Hunt Transport Freight Brokerage Revenue Proportion of Freight Brokerage by Product in 2021
Table 84. JB Hunt Transport Freight Brokerage Revenue Proportion of Freight Brokerage by Application in 2021
Table 85. JB Hunt Transport Freight Brokerage Revenue Proportion of Freight Brokerage by Geographic Area in 2021
Table 86. Worldwide Express Corporation Information
Table 87. Worldwide Express Description and Business Overview
Table 88. Worldwide Express Freight Brokerage Revenue (US$ Million) and Gross Margin (2017-2022)
Table 89. Worldwide Express Freight Brokerage Product
Table 90. Worldwide Express Freight Brokerage Revenue Proportion of Freight Brokerage by Product in 2021
Table 91. Worldwide Express Freight Brokerage Revenue Proportion of Freight Brokerage by Application in 2021
Table 92. Worldwide Express Freight Brokerage Revenue Proportion of Freight Brokerage by Geographic Area in 2021
Table 93. Hub Group Corporation Information
Table 94. Hub Group Description and Business Overview
Table 95. Hub Group Freight Brokerage Revenue (US$ Million) and Gross Margin (2017-2022)
Table 96. Hub Group Freight Brokerage Product
Table 97. Hub Group Freight Brokerage Revenue Proportion of Freight Brokerage by Product in 2021
Table 98. Hub Group Freight Brokerage Revenue Proportion of Freight Brokerage by Application in 2021
Table 99. Hub Group Freight Brokerage Revenue Proportion of Freight Brokerage by Geographic Area in 2021
Table 100. GlobalTranz Enterprises Corporation Information
Table 101. GlobalTranz Enterprises Description and Business Overview
Table 102. GlobalTranz Enterprises Freight Brokerage Revenue (US$ Million) and Gross Margin (2017-2022)
Table 103. GlobalTranz Enterprises Freight Brokerage Product
Table 104. GlobalTranz Enterprises Freight Brokerage Revenue Proportion of Freight Brokerage by Product in 2021
Table 105. GlobalTranz Enterprises Freight Brokerage Revenue Proportion of Freight Brokerage by Application in 2021
Table 106. GlobalTranz Enterprises Freight Brokerage Revenue Proportion of Freight Brokerage by Geographic Area in 2021
Table 107. Allen Lund Corporation Information
Table 108. Allen Lund Description and Business Overview
Table 109. Allen Lund Freight Brokerage Revenue (US$ Million) and Gross Margin (2017-2022)
Table 110. Allen Lund Freight Brokerage Product
Table 111. Allen Lund Freight Brokerage Revenue Proportion of Freight Brokerage by Product in 2021
Table 112. Allen Lund Freight Brokerage Revenue Proportion of Freight Brokerage by Application in 2021
Table 113. Allen Lund Freight Brokerage Revenue Proportion of Freight Brokerage by Geographic Area in 2021
Table 114. Transplace Corporation Information
Table 115. Transplace Description and Business Overview
Table 116. Transplace Freight Brokerage Revenue (US$ Million) and Gross Margin (2017-2022)
Table 117. Transplace Freight Brokerage Product
Table 118. Transplace Freight Brokerage Revenue Proportion of Freight Brokerage by Product in 2021
Table 119. Transplace Freight Brokerage Revenue Proportion of Freight Brokerage by Application in 2021
Table 120. Transplace Freight Brokerage Revenue Proportion of Freight Brokerage by Geographic Area in 2021
Table 121. Werner Logistics Corporation Information
Table 122. Werner Logistics Description and Business Overview
Table 123. Werner Logistics Freight Brokerage Revenue (US$ Million) and Gross Margin (2017-2022)
Table 124. Werner Logistics Freight Brokerage Product
Table 125. Werner Logistics Freight Brokerage Revenue Proportion of Freight Brokerage by Product in 2021
Table 126. Werner Logistics Freight Brokerage Revenue Proportion of Freight Brokerage by Application in 2021
Table 127. Werner Logistics Freight Brokerage Revenue Proportion of Freight Brokerage by Geographic Area in 2021
Table 128. BNSF Logistics Corporation Information
Table 129. BNSF Logistics Description and Business Overview
Table 130. BNSF Logistics Freight Brokerage Revenue (US$ Million) and Gross Margin (2017-2022)
Table 131. BNSF Logistics Freight Brokerage Product
Table 132. BNSF Logistics Freight Brokerage Revenue Proportion of Freight Brokerage by Product in 2021
Table 133. BNSF Logistics Freight Brokerage Revenue Proportion of Freight Brokerage by Application in 2021
Table 134. BNSF Logistics Freight Brokerage Revenue Proportion of Freight Brokerage by Geographic Area in 2021
Table 135. Global Freight Brokerage Revenue by Type (2017-2022) & (US$ Million)
Table 136. Global Freight Brokerage Revenue by Application (2017-2022) & (US$ Million)
Table 137. Global Freight Brokerage Revenue Forecast by Application (2023-2028) & (US$ Million)
Table 138. North America Freight Brokerage Revenue by Country (2017-2022) & (US$ Million)
Table 139. North America Freight Brokerage Revenue by Country (2023-2028) & (US$ Million)
Table 140. North America Freight Brokerage Revenue by Type (2017-2022) & (US$ Million)
Table 141. North America Freight Brokerage Revenue by Application (2017-2022) & (US$ Million)
Table 142. Asia-Pacific Freight Brokerage Revenue by Region (2017-2028) & (US$ Million)
Table 143. Asia-Pacific Freight Brokerage Revenue by Region (2023-2028) & (US$ Million)
Table 144. Asia-Pacific Freight Brokerage Revenue by Type (2017-2022) & (US$ Million)
Table 145. Asia-Pacific Freight Brokerage Revenue by Application (2017-2022) & (US$ Million)
Table 146. Europe Freight Brokerage Revenue by Country (2017-2022) & (US$ Million)
Table 147. Europe Freight Brokerage Revenue by Country (2023-2028) & (US$ Million)
Table 148. Europe Freight Brokerage Revenue by Type (2017-2022) & (US$ Million)
Table 149. Europe Freight Brokerage Revenue by Application (2017-2022) & (US$ Million)
Table 150. Latin America Freight Brokerage Revenue by Country (2017-2022) & (US$ Million)
Table 151. Latin America Freight Brokerage Revenue by Country (2023-2028) & (US$ Million)
Table 152. Latin America Freight Brokerage Revenue by Type (2017-2022) & (US$ Million)
Table 153. Latin America Freight Brokerage Revenue by Application (2017-2022) & (US$ Million)
Table 154. Middle East and Africa Freight Brokerage Revenue by Country (2017-2022) & (US$ Million)
Table 155. Middle East and Africa Freight Brokerage Revenue by Country (2023-2028) & (US$ Million)
Table 156. Middle East and Africa Freight Brokerage Revenue by Type (2017-2022) & (US$ Million)
Table 157. Middle East and Africa Freight Brokerage Revenue by Application (2017-2022) & (US$ Million)
Table 158. Freight Brokerage Key Raw Materials, Industry Status and Trend
Table 159. Freight Brokerage Key Raw Materials and Upstream Suppliers
Table 160. Freight Brokerage Clients Status and Trend
Table 161. Freight Brokerage Typical Clients
Table 162. Freight Brokerage Distributors
Table 163. Freight Brokerage Market Trends
Table 164. Freight Brokerage Market Drivers
Table 165. Freight Brokerage Market Challenges
Table 166. Freight Brokerage Market Restraints
Table 167. Research Programs/Design for This Report
Table 168. Key Data Information from Secondary Sources
Table 169. Key Data Information from Primary Sources
List of Figures
Figure 1. Freight Brokerage Product Picture
Figure 2. Global Freight Brokerage Revenue Market Share by Type in 2021 & 2028
Figure 3. Truckload Product Picture
Figure 4. LTL Product Picture
Figure 5. Other Product Picture
Figure 6. Global Freight Brokerage Revenue Market Share by Application in 2021 & 2028
Figure 7. Food and Beverage
Figure 8. Manufacturing
Figure 9. Retail
Figure 10. Auto and Industrial
Figure 11. Chemical
Figure 12. Other
Figure 13. Freight Brokerage Report Years Considered
Figure 14. Global Freight Brokerage Revenue, (US$ Million), 2017 VS 2021 VS 2028
Figure 15. Global Freight Brokerage Market Size 2017-2028 (US$ Million)
Figure 16. Global Freight Brokerage Market Size Market Share by Region: 2022 Versus 2028
Figure 17. Global Freight Brokerage Revenue Market Share by Region (2017-2028)
Figure 18. Freight Brokerage Market Share by Company Type (Tier 1, Tier 2 and Tier 3): 2017 VS 2021
Figure 19. Global Freight Brokerage Revenue Market Share Forecast by Type (2017-2028)
Figure 20. Global Freight Brokerage Revenue Market Share Forecast by Application (2017-2028)
Figure 21. North America Freight Brokerage Revenue 2017-2028 (US$ Million)
Figure 22. North America Freight Brokerage Revenue Market Share by Type (2017-2022)
Figure 23. North America Freight Brokerage Revenue Market Share by Application (2017-2022)
Figure 24. Asia-Pacific Freight Brokerage Revenue 2017-2028 (US$ Million)
Figure 25. Asia-Pacific Freight Brokerage Revenue Market Share by Region (2017-2028)
Figure 26. Asia-Pacific Freight Brokerage Revenue Market Share by Type (2017-2022)
Figure 27. Asia-Pacific Freight Brokerage Revenue Market Share by Application (2017-2022)
Figure 28. Europe Freight Brokerage Revenue Growth Rate 2017-2028 (US$ Million)
Figure 29. Europe Freight Brokerage Revenue Market Share by Country (2017-2028)
Figure 30. Europe Freight Brokerage Revenue Market Share by Type (2017-2022)
Figure 31. Europe Freight Brokerage Revenue Market Share by Application (2017-2022)
Figure 32. Latin America Freight Brokerage Revenue Growth Rate 2017-2028 (US$ Million)
Figure 33. Latin America Freight Brokerage Revenue Market Share by Country (2017-2022)
Figure 34. Latin America Freight Brokerage Revenue Market Share by Type (2017-2022)
Figure 35. Latin America Freight Brokerage Revenue Market Share by Application (2017-2022)
Figure 36. Middle East and Africa Freight Brokerage Revenue Growth Rate 2017-2028 (US$ Million)
Figure 37. Middle East and Africa Freight Brokerage Revenue Market Share by Country (2017-2028)
Figure 38. Middle East and Africa Freight Brokerage Revenue Market Share by Type (2017-2022)
Figure 39. Middle East and Africa Freight Brokerage Revenue Market Share by Application (2017-2022)
Figure 40. Freight Brokerage Supply Chain (Upstream and Downstream Market)
Figure 41. Global Production Market Share of Freight Brokerage Raw Materials by Region in 2021
Figure 42. Freight Brokerage Distribution Channels
Figure 43. Global Freight Brokerage Percentage 2017-2028: Indirect Sales VS Direct Sales
Figure 44. Global Freight Brokerage Percentage 2017-2028: Online Sales VS Offline Sales
Figure 45. Bottom-up and Top-down Approaches for This Report
Figure 46. Data Triangulation
Figure 47. Key Executives Interviewed
$5900
$11800
HAVE A QUERY?
OUR CUSTOMER