List of Tables
Table 1. Global K-12 STEM Kits Market Size Growth Rate by Type (US$ Million): 2019 VS 2023 VS 2030
Table 2. Key Players of Basic Science Exploration Kits
Table 3. Key Players of Technology Design and Programming Kits
Table 4. Key Players of Engineering Design and Construction Kits
Table 5. Key Players of Mathematics and Logical Thinking Kits
Table 6. Key Players of Others
Table 7. Global K-12 STEM Kits Market Size Growth by Application (US$ Million): 2019 VS 2023 VS 2030
Table 8. Global K-12 STEM Kits Market Size by Region (US$ Million): 2019 VS 2023 VS 2030
Table 9. Global K-12 STEM Kits Market Size by Region (2019-2024) & (US$ Million)
Table 10. Global K-12 STEM Kits Market Share by Region (2019-2024)
Table 11. Global K-12 STEM Kits Forecasted Market Size by Region (2025-2030) & (US$ Million)
Table 12. Global K-12 STEM Kits Market Share by Region (2025-2030)
Table 13. K-12 STEM Kits Market Trends
Table 14. K-12 STEM Kits Market Drivers
Table 15. K-12 STEM Kits Market Challenges
Table 16. K-12 STEM Kits Market Restraints
Table 17. Global K-12 STEM Kits Revenue by Players (2019-2024) & (US$ Million)
Table 18. Global K-12 STEM Kits Market Share by Players (2019-2024)
Table 19. Global Top K-12 STEM Kits Players by Company Type (Tier 1, Tier 2, and Tier 3) & (based on the Revenue in K-12 STEM Kits as of 2023)
Table 20. Ranking of Global Top K-12 STEM Kits Companies by Revenue (US$ Million) in 2023
Table 21. Global 5 Largest Players Market Share by K-12 STEM Kits Revenue (CR5 and HHI) & (2019-2024)
Table 22. Global Key Players of K-12 STEM Kits, Headquarters and Area Served
Table 23. Global Key Players of K-12 STEM Kits, Product and Application
Table 24. Global Key Players of K-12 STEM Kits, Date of Enter into This Industry
Table 25. Mergers & Acquisitions, Expansion Plans
Table 26. Global K-12 STEM Kits Market Size by Type (2019-2024) & (US$ Million)
Table 27. Global K-12 STEM Kits Revenue Market Share by Type (2019-2024)
Table 28. Global K-12 STEM Kits Forecasted Market Size by Type (2025-2030) & (US$ Million)
Table 29. Global K-12 STEM Kits Revenue Market Share by Type (2025-2030)
Table 30. Global K-12 STEM Kits Market Size by Application (2019-2024) & (US$ Million)
Table 31. Global K-12 STEM Kits Revenue Market Share by Application (2019-2024)
Table 32. Global K-12 STEM Kits Forecasted Market Size by Application (2025-2030) & (US$ Million)
Table 33. Global K-12 STEM Kits Revenue Market Share by Application (2025-2030)
Table 34. North America K-12 STEM Kits Market Size Growth Rate by Country (US$ Million): 2019 VS 2023 VS 2030
Table 35. North America K-12 STEM Kits Market Size by Country (2019-2024) & (US$ Million)
Table 36. North America K-12 STEM Kits Market Size by Country (2025-2030) & (US$ Million)
Table 37. Europe K-12 STEM Kits Market Size Growth Rate by Country (US$ Million): 2019 VS 2023 VS 2030
Table 38. Europe K-12 STEM Kits Market Size by Country (2019-2024) & (US$ Million)
Table 39. Europe K-12 STEM Kits Market Size by Country (2025-2030) & (US$ Million)
Table 40. Asia-Pacific K-12 STEM Kits Market Size Growth Rate by Country (US$ Million): 2019 VS 2023 VS 2030
Table 41. Asia-Pacific K-12 STEM Kits Market Size by Region (2019-2024) & (US$ Million)
Table 42. Asia-Pacific K-12 STEM Kits Market Size by Region (2025-2030) & (US$ Million)
Table 43. Latin America K-12 STEM Kits Market Size Growth Rate by Country (US$ Million): 2019 VS 2023 VS 2030
Table 44. Latin America K-12 STEM Kits Market Size by Country (2019-2024) & (US$ Million)
Table 45. Latin America K-12 STEM Kits Market Size by Country (2025-2030) & (US$ Million)
Table 46. Middle East & Africa K-12 STEM Kits Market Size Growth Rate by Country (US$ Million): 2019 VS 2023 VS 2030
Table 47. Middle East & Africa K-12 STEM Kits Market Size by Country (2019-2024) & (US$ Million)
Table 48. Middle East & Africa K-12 STEM Kits Market Size by Country (2025-2030) & (US$ Million)
Table 49. Boxlight Company Details
Table 50. Boxlight Business Overview
Table 51. Boxlight K-12 STEM Kits Product
Table 52. Boxlight Revenue in K-12 STEM Kits Business (2019-2024) & (US$ Million)
Table 53. Boxlight Recent Development
Table 54. Ednex Company Details
Table 55. Ednex Business Overview
Table 56. Ednex K-12 STEM Kits Product
Table 57. Ednex Revenue in K-12 STEM Kits Business (2019-2024) & (US$ Million)
Table 58. Ednex Recent Development
Table 59. Finger Flyer Company Details
Table 60. Finger Flyer Business Overview
Table 61. Finger Flyer K-12 STEM Kits Product
Table 62. Finger Flyer Revenue in K-12 STEM Kits Business (2019-2024) & (US$ Million)
Table 63. Finger Flyer Recent Development
Table 64. Flinn Scientific Company Details
Table 65. Flinn Scientific Business Overview
Table 66. Flinn Scientific K-12 STEM Kits Product
Table 67. Flinn Scientific Revenue in K-12 STEM Kits Business (2019-2024) & (US$ Million)
Table 68. Flinn Scientific Recent Development
Table 69. Lab Aids Company Details
Table 70. Lab Aids Business Overview
Table 71. Lab Aids K-12 STEM Kits Product
Table 72. Lab Aids Revenue in K-12 STEM Kits Business (2019-2024) & (US$ Million)
Table 73. Lab Aids Recent Development
Table 74. Nasco Education Company Details
Table 75. Nasco Education Business Overview
Table 76. Nasco Education K-12 STEM Kits Product
Table 77. Nasco Education Revenue in K-12 STEM Kits Business (2019-2024) & (US$ Million)
Table 78. Nasco Education Recent Development
Table 79. NextWaveSTEM Company Details
Table 80. NextWaveSTEM Business Overview
Table 81. NextWaveSTEM K-12 STEM Kits Product
Table 82. NextWaveSTEM Revenue in K-12 STEM Kits Business (2019-2024) & (US$ Million)
Table 83. NextWaveSTEM Recent Development
Table 84. Smartivity USA Company Details
Table 85. Smartivity USA Business Overview
Table 86. Smartivity USA K-12 STEM Kits Product
Table 87. Smartivity USA Revenue in K-12 STEM Kits Business (2019-2024) & (US$ Million)
Table 88. Smartivity USA Recent Development
Table 89. Sphero Company Details
Table 90. Sphero Business Overview
Table 91. Sphero K-12 STEM Kits Product
Table 92. Sphero Revenue in K-12 STEM Kits Business (2019-2024) & (US$ Million)
Table 93. Sphero Recent Development
Table 94. STEAM Queens Company Details
Table 95. STEAM Queens Business Overview
Table 96. STEAM Queens K-12 STEM Kits Product
Table 97. STEAM Queens Revenue in K-12 STEM Kits Business (2019-2024) & (US$ Million)
Table 98. STEAM Queens Recent Development
Table 99. STEMROBO Company Details
Table 100. STEMROBO Business Overview
Table 101. STEMROBO K-12 STEM Kits Product
Table 102. STEMROBO Revenue in K-12 STEM Kits Business (2019-2024) & (US$ Million)
Table 103. STEMROBO Recent Development
Table 104. Wonder Workshop Company Details
Table 105. Wonder Workshop Business Overview
Table 106. Wonder Workshop K-12 STEM Kits Product
Table 107. Wonder Workshop Revenue in K-12 STEM Kits Business (2019-2024) & (US$ Million)
Table 108. Wonder Workshop Recent Development
Table 109. Research Programs/Design for This Report
Table 110. Key Data Information from Secondary Sources
Table 111. Key Data Information from Primary Sources
Table 112. Authors List of This Report
List of Figures
Figure 1. K-12 STEM Kits Picture
Figure 2. Global K-12 STEM Kits Market Size Comparison by Type (2024-2030) & (US$ Million)
Figure 3. Global K-12 STEM Kits Market Share by Type: 2023 VS 2030
Figure 4. Basic Science Exploration Kits Features
Figure 5. Technology Design and Programming Kits Features
Figure 6. Engineering Design and Construction Kits Features
Figure 7. Mathematics and Logical Thinking Kits Features
Figure 8. Others Features
Figure 9. Global K-12 STEM Kits Market Size by Application (2024-2030) & (US$ Million)
Figure 10. Global K-12 STEM Kits Market Share by Application: 2023 VS 2030
Figure 11. Family Case Studies
Figure 12. School Case Studies
Figure 13. Training Institution Case Studies
Figure 14. K-12 STEM Kits Report Years Considered
Figure 15. Global K-12 STEM Kits Market Size (US$ Million), Year-over-Year: 2019-2030
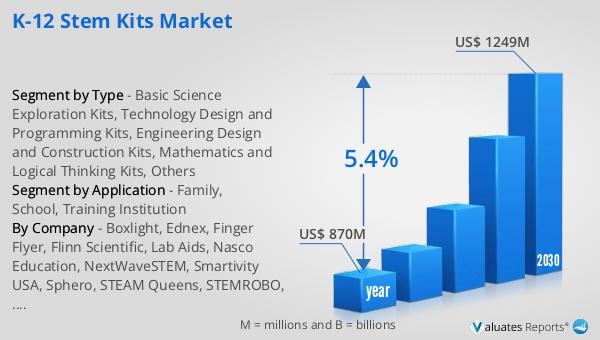
Figure 16. Global K-12 STEM Kits Market Size, (US$ Million), 2019 VS 2023 VS 2030
Figure 17. Global K-12 STEM Kits Market Share by Region: 2023 VS 2030
Figure 18. Global K-12 STEM Kits Market Share by Players in 2023
Figure 19. Global Top K-12 STEM Kits Players by Company Type (Tier 1, Tier 2, and Tier 3) & (based on the Revenue in K-12 STEM Kits as of 2023)
Figure 20. The Top 10 and 5 Players Market Share by K-12 STEM Kits Revenue in 2023
Figure 21. North America K-12 STEM Kits Market Size YoY Growth (2019-2030) & (US$ Million)
Figure 22. North America K-12 STEM Kits Market Share by Country (2019-2030)
Figure 23. United States K-12 STEM Kits Market Size YoY Growth (2019-2030) & (US$ Million)
Figure 24. Canada K-12 STEM Kits Market Size YoY Growth (2019-2030) & (US$ Million)
Figure 25. Europe K-12 STEM Kits Market Size YoY Growth (2019-2030) & (US$ Million)
Figure 26. Europe K-12 STEM Kits Market Share by Country (2019-2030)
Figure 27. Germany K-12 STEM Kits Market Size YoY Growth (2019-2030) & (US$ Million)
Figure 28. France K-12 STEM Kits Market Size YoY Growth (2019-2030) & (US$ Million)
Figure 29. U.K. K-12 STEM Kits Market Size YoY Growth (2019-2030) & (US$ Million)
Figure 30. Italy K-12 STEM Kits Market Size YoY Growth (2019-2030) & (US$ Million)
Figure 31. Russia K-12 STEM Kits Market Size YoY Growth (2019-2030) & (US$ Million)
Figure 32. Nordic Countries K-12 STEM Kits Market Size YoY Growth (2019-2030) & (US$ Million)
Figure 33. Asia-Pacific K-12 STEM Kits Market Size YoY Growth (2019-2030) & (US$ Million)
Figure 34. Asia-Pacific K-12 STEM Kits Market Share by Region (2019-2030)
Figure 35. China K-12 STEM Kits Market Size YoY Growth (2019-2030) & (US$ Million)
Figure 36. Japan K-12 STEM Kits Market Size YoY Growth (2019-2030) & (US$ Million)
Figure 37. South Korea K-12 STEM Kits Market Size YoY Growth (2019-2030) & (US$ Million)
Figure 38. Southeast Asia K-12 STEM Kits Market Size YoY Growth (2019-2030) & (US$ Million)
Figure 39. India K-12 STEM Kits Market Size YoY Growth (2019-2030) & (US$ Million)
Figure 40. Australia K-12 STEM Kits Market Size YoY Growth (2019-2030) & (US$ Million)
Figure 41. Latin America K-12 STEM Kits Market Size YoY Growth (2019-2030) & (US$ Million)
Figure 42. Latin America K-12 STEM Kits Market Share by Country (2019-2030)
Figure 43. Mexico K-12 STEM Kits Market Size YoY Growth (2019-2030) & (US$ Million)
Figure 44. Brazil K-12 STEM Kits Market Size YoY Growth (2019-2030) & (US$ Million)
Figure 45. Middle East & Africa K-12 STEM Kits Market Size YoY Growth (2019-2030) & (US$ Million)
Figure 46. Middle East & Africa K-12 STEM Kits Market Share by Country (2019-2030)
Figure 47. Turkey K-12 STEM Kits Market Size YoY Growth (2019-2030) & (US$ Million)
Figure 48. Saudi Arabia K-12 STEM Kits Market Size YoY Growth (2019-2030) & (US$ Million)
Figure 49. UAE K-12 STEM Kits Market Size YoY Growth (2019-2030) & (US$ Million)
Figure 50. Boxlight Revenue Growth Rate in K-12 STEM Kits Business (2019-2024)
Figure 51. Ednex Revenue Growth Rate in K-12 STEM Kits Business (2019-2024)
Figure 52. Finger Flyer Revenue Growth Rate in K-12 STEM Kits Business (2019-2024)
Figure 53. Flinn Scientific Revenue Growth Rate in K-12 STEM Kits Business (2019-2024)
Figure 54. Lab Aids Revenue Growth Rate in K-12 STEM Kits Business (2019-2024)
Figure 55. Nasco Education Revenue Growth Rate in K-12 STEM Kits Business (2019-2024)
Figure 56. NextWaveSTEM Revenue Growth Rate in K-12 STEM Kits Business (2019-2024)
Figure 57. Smartivity USA Revenue Growth Rate in K-12 STEM Kits Business (2019-2024)
Figure 58. Sphero Revenue Growth Rate in K-12 STEM Kits Business (2019-2024)
Figure 59. STEAM Queens Revenue Growth Rate in K-12 STEM Kits Business (2019-2024)
Figure 60. STEMROBO Revenue Growth Rate in K-12 STEM Kits Business (2019-2024)
Figure 61. Wonder Workshop Revenue Growth Rate in K-12 STEM Kits Business (2019-2024)
Figure 62. Bottom-up and Top-down Approaches for This Report
Figure 63. Data Triangulation
Figure 64. Key Executives Interviewed