Dental Imaging Market
On the basis of technology, the dental imaging market is segmented into X-ray systems, dental CBCT, intraoral cameras and dental optical imaging. In 2017, the X-ray systems segment is expected to account for the largest share of the global market, by technology. The high share can be attributed to the extensive use of X-Ray systems for essential dental screening conditions such as periodontal diseases, tooth decay, dental abscess, and erosion of tooth enamel. The X-ray market is further divided into digital X-ray systems and analog X-ray systems.
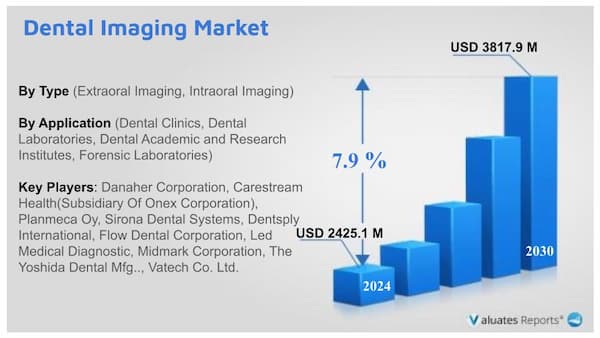
The global Dental Imaging market is projected to grow from US$ 2425.1 million in 2024 to US$ 3817.9 million by 2030, at a Compound Annual Growth Rate (CAGR) of 7.9% during the forecast period.
Trends Influencing the Global Dental Imaging Market
The growing number of oral diseases
Dental health conditions are growing rapidly. Diseases such as periodontal, tooth decay, oral cancer, oral dental trauma, etc affect millions of people every year. This creates a huge healthcare burden. Digital imaging machines such as X-rays help dentists in capturing sharp images of your teeth and gums through low levels of radiation thereby helping in identifying the problems. These factors will drive the growth of the dental imaging market during the forecast period. Untreated oral health diseases are the most common health conditions leading to pain, discomfort, or disfigurement.
Rapid innovations
The advent of modern technology ranging from intraoral periapical X-rays to computed tomography, cone beam computed tomography, magnetic resonance imaging systems and ultrasound have revolutionized the dentistry industry. These technical tools have made the process faster, simpler, and image storage, manipulation along with retrieval easier. The 3D imaging technology has made the viewing of inner facial structures less complicated leading to a quick diagnosis of deep-seated lesions. Moreover, extraoral radiographs are used for examining the jaws, skull, craniofacial skeletons, affected teeth, and joints. These widespread applications will propel the growth of the dental imaging market during the review period.
Cosmetic application and cost-effective
The geriatric population is rising rapidly across the globe. This has augmented the unprecedented rise of dental problems. Furthermore, people are seeking out aesthetic facial improvements that are minimally invasive and improve exterior appearance at a cheap cost. The procedures are dental whitening, resin veneers, full reconstruction of mouth, gum lift, reshaping, straightening, tooth implants, etc. Cosmetic dental surgeries are becoming less invasive with numerous product launches and innovations. This in turn will boost the demand for the dental imaging market during the review period.
Costly initial investment and slow acceptance
Wired devices, software, and hardware are complicated to set up with high initial costs. In addition to it, manufacturers are not transparent over the standards of hardware, software, technicalities, and different image file formats. This leads to confusion and slow implementation by dentists. This will create restraints for the dental imaging market during the review period.
Dental Imaging Market Size and Share
According to our research, the global market for medical devices is estimated at US$ 603 billion in the year 2023, and will be growing at a CAGR of 5% during next six years. The global healthcare spending contributes to occupy 10% of the global GDP and is continuously rising in recent years due to the increasing health needs of the aging population, the growing prevalence of chronic and infectious diseases and the expansion of emerging markets. The medical devices market plays a significant role in the healthcare industry. The market is driven by several factors, including the increasing demand for advanced healthcare services globally, advancements in medical technology, growing geriatric population, rising healthcare expenditure, and increasing awareness about early disease diagnosis and treatment.
Dental Imaging Market Insights
Based on type, the intraoral imaging segment will create immense opportunities for growth in the dental imaging market share due to the quick capturing of dental images thereby reducing workflow stoppages. The waiting time gets reduced drastically.
Based on application, the Dental clinics' segment will maintain dominance in the dental imaging market share due to increased awareness levels and lesser costs.
Based on region, North America is expected to provide lucrative opportunities for growth in the dental imaging market share due to the presence of big industry players and early adoption of technologies.
Dental Imaging Market Segment and Scope
This report presents an overview of global market for Dental Imaging, sales, revenue and price. Analyses of the global market trends, with historic market revenue/sales data for 2019 - 2023, estimates for 2024, and projections of CAGR through 2030.
This report researches the key producers of Dental Imaging, also provides the sales of main regions and countries. of the upcoming market potential for Dental Imaging, and key regions/countries of focus to forecast this market into various segments and sub-segments. Country specific data and market value analysis for the U.S., Canada, Mexico, Brazil, China, Japan, South Korea, Southeast Asia, India, Germany, the U.K., Italy, Middle East, Africa, and Other Countries.
This report focuses on the Dental Imaging sales, revenue, market share and industry ranking of main manufacturers, data from 2019 to 2024. Identification of the major stakeholders in the global Dental Imaging market, and analysis of their competitive landscape and market positioning based on recent developments and segmental revenues. This report will help stakeholders to understand the competitive landscape and gain more insights and position their businesses and market strategies in a better way.
This report analyzes the segments data by Type, and by Application, sales, revenue, and price, from 2019 to 2030. Evaluation and forecast the market size for Dental Imaging sales, projected growth trends, production technology, application and end-user industry.
Descriptive company profiles of the major global players, including Danaher Corporation, Carestream Health(Subsidiary Of Onex Corporation), Planmeca Oy, Sirona Dental Systems, Dentsply International, Flow Dental Corporation, Led Medical Diagnostic, Midmark Corporation and The Yoshida Dental Mfg.., etc.
Dental Imaging Market Segment By Type
- Extraoral Imaging
- Intraoral Imaging
Dental Imaging Market Segment By Application
- Dental Clinics
- Dental Laboratories
- Dental Academic and Research Institutes
- Forensic Laboratories
By Company
- Danaher Corporation
- Carestream Health(Subsidiary Of Onex Corporation)
- Planmeca Oy
- Sirona Dental Systems
- Dentsply International
- Flow Dental Corporation
- Led Medical Diagnostic
- Midmark Corporation
- The Yoshida Dental Mfg.
- Vatech Co. Ltd.
By Region
- North America
- U.S.
- Canada
- Europe
- Germany
- France
- U.K.
- Italy
- Russia
- Asia-Pacific
- China
- Japan
- South Korea
- India
- Australia
- Taiwan
- Indonesia
- Thailand
- Malaysia
- Philippines
- Vietnam
- Latin America
- Mexico
- Brazil
- Argentina
- Middle East & Africa
- Turkey
- Saudi Arabia
- U.A.E
Table of Contents
1 Study Coverage
1.1 Dental Imaging Product Introduction
1.2 Market by Type
1.2.1 Global Dental Imaging Market Size Growth Rate by Type, 2019 VS 2023 VS 2030
1.2.2 Extraoral Imaging
1.2.3 Intraoral Imaging
1.3 Market by Application
1.3.1 Global Dental Imaging Market Size Growth Rate by Application, 2019 VS 2023 VS 2030
1.3.2 Dental Clinics
1.3.3 Dental Laboratories
1.3.4 Dental Academic and Research Institutes
1.3.5 Forensic Laboratories
1.4 Assumptions and Limitations
1.5 Study Objectives
1.6 Years Considered
2 Executive Summary
2.1 Global Dental Imaging Sales Estimates and Forecasts 2019-2030
2.2 Global Dental Imaging Revenue by Region
2.2.1 Global Dental Imaging Revenue by Region: 2019 VS 2023 VS 2030
2.2.2 Global Dental Imaging Revenue by Region (2019-2024)
2.2.3 Global Dental Imaging Revenue by Region (2025-2030)
2.2.4 Global Dental Imaging Revenue Market Share by Region (2019-2030)
2.3 Global Dental Imaging Sales Estimates and Forecasts 2019-2030
2.4 Global Dental Imaging Sales by Region
2.4.1 Global Dental Imaging Sales by Region: 2019 VS 2023 VS 2030
2.4.2 Global Dental Imaging Sales by Region (2019-2024)
2.4.3 Global Dental Imaging Sales by Region (2025-2030)
2.4.4 Global Dental Imaging Sales Market Share by Region (2019-2030)
2.5 US & Canada
2.6 Europe
2.7 China
2.8 Asia (excluding China)
2.9 Middle East, Africa and Latin America
3 Competition by Manufactures
3.1 Global Dental Imaging Sales by Manufacturers
3.1.1 Global Dental Imaging Sales by Manufacturers (2019-2024)
3.1.2 Global Dental Imaging Sales Market Share by Manufacturers (2019-2024)
3.1.3 Global Top 10 and Top 5 Largest Manufacturers of Dental Imaging in 2023
3.2 Global Dental Imaging Revenue by Manufacturers
3.2.1 Global Dental Imaging Revenue by Manufacturers (2019-2024)
3.2.2 Global Dental Imaging Revenue Market Share by Manufacturers (2019-2024)
3.2.3 Global Top 10 and Top 5 Companies by Dental Imaging Revenue in 2023
3.3 Global Key Players of Dental Imaging, Industry Ranking, 2022 VS 2023 VS 2024
3.4 Global Dental Imaging Sales Price by Manufacturers
3.5 Analysis of Competitive Landscape
3.5.1 Manufacturers Market Concentration Ratio (CR5 and HHI)
3.5.2 Global Dental Imaging Market Share by Company Type (Tier 1, Tier 2, and Tier 3)
3.6 Global Key Manufacturers of Dental Imaging, Manufacturing Base Distribution and Headquarters
3.7 Global Key Manufacturers of Dental Imaging, Product Offered and Application
3.8 Global Key Manufacturers of Dental Imaging, Date of Enter into This Industry
3.9 Mergers & Acquisitions, Expansion Plans
4 Market Size by Type
4.1 Global Dental Imaging Sales by Type
4.1.1 Global Dental Imaging Historical Sales by Type (2019-2024)
4.1.2 Global Dental Imaging Forecasted Sales by Type (2025-2030)
4.1.3 Global Dental Imaging Sales Market Share by Type (2019-2030)
4.2 Global Dental Imaging Revenue by Type
4.2.1 Global Dental Imaging Historical Revenue by Type (2019-2024)
4.2.2 Global Dental Imaging Forecasted Revenue by Type (2025-2030)
4.2.3 Global Dental Imaging Revenue Market Share by Type (2019-2030)
4.3 Global Dental Imaging Price by Type
4.3.1 Global Dental Imaging Price by Type (2019-2024)
4.3.2 Global Dental Imaging Price Forecast by Type (2025-2030)
5 Market Size by Application
5.1 Global Dental Imaging Sales by Application
5.1.1 Global Dental Imaging Historical Sales by Application (2019-2024)
5.1.2 Global Dental Imaging Forecasted Sales by Application (2025-2030)
5.1.3 Global Dental Imaging Sales Market Share by Application (2019-2030)
5.2 Global Dental Imaging Revenue by Application
5.2.1 Global Dental Imaging Historical Revenue by Application (2019-2024)
5.2.2 Global Dental Imaging Forecasted Revenue by Application (2025-2030)
5.2.3 Global Dental Imaging Revenue Market Share by Application (2019-2030)
5.3 Global Dental Imaging Price by Application
5.3.1 Global Dental Imaging Price by Application (2019-2024)
5.3.2 Global Dental Imaging Price Forecast by Application (2025-2030)
6 US & Canada
6.1 US & Canada Dental Imaging Market Size by Type
6.1.1 US & Canada Dental Imaging Sales by Type (2019-2030)
6.1.2 US & Canada Dental Imaging Revenue by Type (2019-2030)
6.2 US & Canada Dental Imaging Market Size by Application
6.2.1 US & Canada Dental Imaging Sales by Application (2019-2030)
6.2.2 US & Canada Dental Imaging Revenue by Application (2019-2030)
6.3 US & Canada Dental Imaging Market Size by Country
6.3.1 US & Canada Dental Imaging Revenue by Country: 2019 VS 2023 VS 2030
6.3.2 US & Canada Dental Imaging Sales by Country (2019-2030)
6.3.3 US & Canada Dental Imaging Revenue by Country (2019-2030)
6.3.4 US
6.3.5 Canada
7 Europe
7.1 Europe Dental Imaging Market Size by Type
7.1.1 Europe Dental Imaging Sales by Type (2019-2030)
7.1.2 Europe Dental Imaging Revenue by Type (2019-2030)
7.2 Europe Dental Imaging Market Size by Application
7.2.1 Europe Dental Imaging Sales by Application (2019-2030)
7.2.2 Europe Dental Imaging Revenue by Application (2019-2030)
7.3 Europe Dental Imaging Market Size by Country
7.3.1 Europe Dental Imaging Revenue by Country: 2019 VS 2023 VS 2030
7.3.2 Europe Dental Imaging Sales by Country (2019-2030)
7.3.3 Europe Dental Imaging Revenue by Country (2019-2030)
7.3.4 Germany
7.3.5 France
7.3.6 U.K.
7.3.7 Italy
7.3.8 Russia
8 China
8.1 China Dental Imaging Market Size
8.1.1 China Dental Imaging Sales (2019-2030)
8.1.2 China Dental Imaging Revenue (2019-2030)
8.2 China Dental Imaging Market Size by Application
8.2.1 China Dental Imaging Sales by Application (2019-2030)
8.2.2 China Dental Imaging Revenue by Application (2019-2030)
9 Asia (excluding China)
9.1 Asia Dental Imaging Market Size by Type
9.1.1 Asia Dental Imaging Sales by Type (2019-2030)
9.1.2 Asia Dental Imaging Revenue by Type (2019-2030)
9.2 Asia Dental Imaging Market Size by Application
9.2.1 Asia Dental Imaging Sales by Application (2019-2030)
9.2.2 Asia Dental Imaging Revenue by Application (2019-2030)
9.3 Asia Dental Imaging Sales by Region
9.3.1 Asia Dental Imaging Revenue by Region: 2019 VS 2023 VS 2030
9.3.2 Asia Dental Imaging Revenue by Region (2019-2030)
9.3.3 Asia Dental Imaging Sales by Region (2019-2030)
9.3.4 Japan
9.3.5 South Korea
9.3.6 China Taiwan
9.3.7 Southeast Asia
9.3.8 India
10 Middle East, Africa and Latin America
10.1 Middle East, Africa and Latin America Dental Imaging Market Size by Type
10.1.1 Middle East, Africa and Latin America Dental Imaging Sales by Type (2019-2030)
10.1.2 Middle East, Africa and Latin America Dental Imaging Revenue by Type (2019-2030)
10.2 Middle East, Africa and Latin America Dental Imaging Market Size by Application
10.2.1 Middle East, Africa and Latin America Dental Imaging Sales by Application (2019-2030)
10.2.2 Middle East, Africa and Latin America Dental Imaging Revenue by Application (2019-2030)
10.3 Middle East, Africa and Latin America Dental Imaging Sales by Country
10.3.1 Middle East, Africa and Latin America Dental Imaging Revenue by Country: 2019 VS 2023 VS 2030
10.3.2 Middle East, Africa and Latin America Dental Imaging Revenue by Country (2019-2030)
10.3.3 Middle East, Africa and Latin America Dental Imaging Sales by Country (2019-2030)
10.3.4 Brazil
10.3.5 Mexico
10.3.6 Turkey
10.3.7 Israel
10.3.8 GCC Countries
11 Company Profiles
11.1 Danaher Corporation
11.1.1 Danaher Corporation Company Information
11.1.2 Danaher Corporation Overview
11.1.3 Danaher Corporation Dental Imaging Sales, Price, Revenue and Gross Margin (2019-2024)
11.1.4 Danaher Corporation Dental Imaging Product Model Numbers, Pictures, Descriptions and Specifications
11.1.5 Danaher Corporation Recent Developments
11.2 Carestream Health(Subsidiary Of Onex Corporation)
11.2.1 Carestream Health(Subsidiary Of Onex Corporation) Company Information
11.2.2 Carestream Health(Subsidiary Of Onex Corporation) Overview
11.2.3 Carestream Health(Subsidiary Of Onex Corporation) Dental Imaging Sales, Price, Revenue and Gross Margin (2019-2024)
11.2.4 Carestream Health(Subsidiary Of Onex Corporation) Dental Imaging Product Model Numbers, Pictures, Descriptions and Specifications
11.2.5 Carestream Health(Subsidiary Of Onex Corporation) Recent Developments
11.3 Planmeca Oy
11.3.1 Planmeca Oy Company Information
11.3.2 Planmeca Oy Overview
11.3.3 Planmeca Oy Dental Imaging Sales, Price, Revenue and Gross Margin (2019-2024)
11.3.4 Planmeca Oy Dental Imaging Product Model Numbers, Pictures, Descriptions and Specifications
11.3.5 Planmeca Oy Recent Developments
11.4 Sirona Dental Systems
11.4.1 Sirona Dental Systems Company Information
11.4.2 Sirona Dental Systems Overview
11.4.3 Sirona Dental Systems Dental Imaging Sales, Price, Revenue and Gross Margin (2019-2024)
11.4.4 Sirona Dental Systems Dental Imaging Product Model Numbers, Pictures, Descriptions and Specifications
11.4.5 Sirona Dental Systems Recent Developments
11.5 Dentsply International
11.5.1 Dentsply International Company Information
11.5.2 Dentsply International Overview
11.5.3 Dentsply International Dental Imaging Sales, Price, Revenue and Gross Margin (2019-2024)
11.5.4 Dentsply International Dental Imaging Product Model Numbers, Pictures, Descriptions and Specifications
11.5.5 Dentsply International Recent Developments
11.6 Flow Dental Corporation
11.6.1 Flow Dental Corporation Company Information
11.6.2 Flow Dental Corporation Overview
11.6.3 Flow Dental Corporation Dental Imaging Sales, Price, Revenue and Gross Margin (2019-2024)
11.6.4 Flow Dental Corporation Dental Imaging Product Model Numbers, Pictures, Descriptions and Specifications
11.6.5 Flow Dental Corporation Recent Developments
11.7 Led Medical Diagnostic
11.7.1 Led Medical Diagnostic Company Information
11.7.2 Led Medical Diagnostic Overview
11.7.3 Led Medical Diagnostic Dental Imaging Sales, Price, Revenue and Gross Margin (2019-2024)
11.7.4 Led Medical Diagnostic Dental Imaging Product Model Numbers, Pictures, Descriptions and Specifications
11.7.5 Led Medical Diagnostic Recent Developments
11.8 Midmark Corporation
11.8.1 Midmark Corporation Company Information
11.8.2 Midmark Corporation Overview
11.8.3 Midmark Corporation Dental Imaging Sales, Price, Revenue and Gross Margin (2019-2024)
11.8.4 Midmark Corporation Dental Imaging Product Model Numbers, Pictures, Descriptions and Specifications
11.8.5 Midmark Corporation Recent Developments
11.9 The Yoshida Dental Mfg..
11.9.1 The Yoshida Dental Mfg.. Company Information
11.9.2 The Yoshida Dental Mfg.. Overview
11.9.3 The Yoshida Dental Mfg.. Dental Imaging Sales, Price, Revenue and Gross Margin (2019-2024)
11.9.4 The Yoshida Dental Mfg.. Dental Imaging Product Model Numbers, Pictures, Descriptions and Specifications
11.9.5 The Yoshida Dental Mfg.. Recent Developments
11.10 Vatech Co. Ltd.
11.10.1 Vatech Co. Ltd. Company Information
11.10.2 Vatech Co. Ltd. Overview
11.10.3 Vatech Co. Ltd. Dental Imaging Sales, Price, Revenue and Gross Margin (2019-2024)
11.10.4 Vatech Co. Ltd. Dental Imaging Product Model Numbers, Pictures, Descriptions and Specifications
11.10.5 Vatech Co. Ltd. Recent Developments
12 Industry Chain and Sales Channels Analysis
12.1 Dental Imaging Industry Chain Analysis
12.2 Dental Imaging Key Raw Materials
12.2.1 Key Raw Materials
12.2.2 Raw Materials Key Suppliers
12.3 Dental Imaging Production Mode & Process
12.4 Dental Imaging Sales and Marketing
12.4.1 Dental Imaging Sales Channels
12.4.2 Dental Imaging Distributors
12.5 Dental Imaging Customers
13 Market Dynamics
13.1 Dental Imaging Industry Trends
13.2 Dental Imaging Market Drivers
13.3 Dental Imaging Market Challenges
13.4 Dental Imaging Market Restraints
14 Key Findings in The Global Dental Imaging Study
15 Appendix
15.1 Research Methodology
15.1.1 Methodology/Research Approach
15.1.2 Data Source
15.2 Author Details
15.3 Disclaimer
Table of Figures
List of Tables
Table 1. Global Dental Imaging Market Size Growth Rate by Type, 2019 VS 2023 VS 2030 (US$ Million)
Table 2. Major Manufacturers of Extraoral Imaging
Table 3. Major Manufacturers of Intraoral Imaging
Table 4. Global Dental Imaging Market Size Growth Rate by Application, 2019 VS 2023 VS 2030 (US$ Million)
Table 5. Global Dental Imaging Revenue Grow Rate (CAGR) by Region: 2019 VS 2023 VS 2030 (US$ Million)
Table 6. Global Dental Imaging Revenue by Region (2019-2024) & (US$ Million)
Table 7. Global Dental Imaging Revenue by Region (2025-2030) & (US$ Million)
Table 8. Global Dental Imaging Revenue Market Share by Region (2019-2024)
Table 9. Global Dental Imaging Revenue Market Share by Region (2025-2030)
Table 10. Global Dental Imaging Sales Grow Rate (CAGR) by Region: 2019 VS 2023 VS 2030 (US$ Million)
Table 11. Global Dental Imaging Sales by Region (2019-2024) & (K Units)
Table 12. Global Dental Imaging Sales by Region (2025-2030) & (K Units)
Table 13. Global Dental Imaging Sales Market Share by Region (2019-2024)
Table 14. Global Dental Imaging Sales Market Share by Region (2025-2030)
Table 15. Global Dental Imaging Sales by Manufacturers (2019-2024) & (K Units)
Table 16. Global Dental Imaging Sales Share by Manufacturers (2019-2024)
Table 17. Global Dental Imaging Revenue by Manufacturers (2019-2024) & (US$ Million)
Table 18. Global Dental Imaging Revenue Share by Manufacturers (2019-2024)
Table 19. Global Key Players of Dental Imaging, Industry Ranking, 2022 VS 2023 VS 2024
Table 20. Dental Imaging Price by Manufacturers 2019-2024 (USD/Unit)
Table 21. Global Dental Imaging Manufacturers Market Concentration Ratio (CR5 and HHI)
Table 22. Global Dental Imaging by Company Type (Tier 1, Tier 2, and Tier 3) & (based on the Revenue in Dental Imaging as of 2023)
Table 23. Global Key Manufacturers of Dental Imaging, Manufacturing Base Distribution and Headquarters
Table 24. Global Key Manufacturers of Dental Imaging, Product Offered and Application
Table 25. Global Key Manufacturers of Dental Imaging, Date of Enter into This Industry
Table 26. Mergers & Acquisitions, Expansion Plans
Table 27. Global Dental Imaging Sales by Type (2019-2024) & (K Units)
Table 28. Global Dental Imaging Sales by Type (2025-2030) & (K Units)
Table 29. Global Dental Imaging Sales Share by Type (2019-2024)
Table 30. Global Dental Imaging Sales Share by Type (2025-2030)
Table 31. Global Dental Imaging Revenue by Type (2019-2024) & (US$ Million)
Table 32. Global Dental Imaging Revenue by Type (2025-2030) & (US$ Million)
Table 33. Global Dental Imaging Revenue Share by Type (2019-2024)
Table 34. Global Dental Imaging Revenue Share by Type (2025-2030)
Table 35. Dental Imaging Price by Type (2019-2024) & (USD/Unit)
Table 36. Global Dental Imaging Price Forecast by Type (2025-2030) & (USD/Unit)
Table 37. Global Dental Imaging Sales by Application (2019-2024) & (K Units)
Table 38. Global Dental Imaging Sales by Application (2025-2030) & (K Units)
Table 39. Global Dental Imaging Sales Share by Application (2019-2024)
Table 40. Global Dental Imaging Sales Share by Application (2025-2030)
Table 41. Global Dental Imaging Revenue by Application (2019-2024) & (US$ Million)
Table 42. Global Dental Imaging Revenue by Application (2025-2030) & (US$ Million)
Table 43. Global Dental Imaging Revenue Share by Application (2019-2024)
Table 44. Global Dental Imaging Revenue Share by Application (2025-2030)
Table 45. Dental Imaging Price by Application (2019-2024) & (USD/Unit)
Table 46. Global Dental Imaging Price Forecast by Application (2025-2030) & (USD/Unit)
Table 47. US & Canada Dental Imaging Sales by Type (2019-2024) & (K Units)
Table 48. US & Canada Dental Imaging Sales by Type (2025-2030) & (K Units)
Table 49. US & Canada Dental Imaging Revenue by Type (2019-2024) & (US$ Million)
Table 50. US & Canada Dental Imaging Revenue by Type (2025-2030) & (US$ Million)
Table 51. US & Canada Dental Imaging Sales by Application (2019-2024) & (K Units)
Table 52. US & Canada Dental Imaging Sales by Application (2025-2030) & (K Units)
Table 53. US & Canada Dental Imaging Revenue by Application (2019-2024) & (US$ Million)
Table 54. US & Canada Dental Imaging Revenue by Application (2025-2030) & (US$ Million)
Table 55. US & Canada Dental Imaging Revenue Grow Rate (CAGR) by Country: 2019 VS 2023 VS 2030 (US$ Million)
Table 56. US & Canada Dental Imaging Revenue by Country (2019-2024) & (US$ Million)
Table 57. US & Canada Dental Imaging Revenue by Country (2025-2030) & (US$ Million)
Table 58. US & Canada Dental Imaging Sales by Country (2019-2024) & (K Units)
Table 59. US & Canada Dental Imaging Sales by Country (2025-2030) & (K Units)
Table 60. Europe Dental Imaging Sales by Type (2019-2024) & (K Units)
Table 61. Europe Dental Imaging Sales by Type (2025-2030) & (K Units)
Table 62. Europe Dental Imaging Revenue by Type (2019-2024) & (US$ Million)
Table 63. Europe Dental Imaging Revenue by Type (2025-2030) & (US$ Million)
Table 64. Europe Dental Imaging Sales by Application (2019-2024) & (K Units)
Table 65. Europe Dental Imaging Sales by Application (2025-2030) & (K Units)
Table 66. Europe Dental Imaging Revenue by Application (2019-2024) & (US$ Million)
Table 67. Europe Dental Imaging Revenue by Application (2025-2030) & (US$ Million)
Table 68. Europe Dental Imaging Revenue Grow Rate (CAGR) by Country: 2019 VS 2023 VS 2030 (US$ Million)
Table 69. Europe Dental Imaging Revenue by Country (2019-2024) & (US$ Million)
Table 70. Europe Dental Imaging Revenue by Country (2025-2030) & (US$ Million)
Table 71. Europe Dental Imaging Sales by Country (2019-2024) & (K Units)
Table 72. Europe Dental Imaging Sales by Country (2025-2030) & (K Units)
Table 73. China Dental Imaging Sales by Type (2019-2024) & (K Units)
Table 74. China Dental Imaging Sales by Type (2025-2030) & (K Units)
Table 75. China Dental Imaging Revenue by Type (2019-2024) & (US$ Million)
Table 76. China Dental Imaging Revenue by Type (2025-2030) & (US$ Million)
Table 77. China Dental Imaging Sales by Application (2019-2024) & (K Units)
Table 78. China Dental Imaging Sales by Application (2025-2030) & (K Units)
Table 79. China Dental Imaging Revenue by Application (2019-2024) & (US$ Million)
Table 80. China Dental Imaging Revenue by Application (2025-2030) & (US$ Million)
Table 81. Asia Dental Imaging Sales by Type (2019-2024) & (K Units)
Table 82. Asia Dental Imaging Sales by Type (2025-2030) & (K Units)
Table 83. Asia Dental Imaging Revenue by Type (2019-2024) & (US$ Million)
Table 84. Asia Dental Imaging Revenue by Type (2025-2030) & (US$ Million)
Table 85. Asia Dental Imaging Sales by Application (2019-2024) & (K Units)
Table 86. Asia Dental Imaging Sales by Application (2025-2030) & (K Units)
Table 87. Asia Dental Imaging Revenue by Application (2019-2024) & (US$ Million)
Table 88. Asia Dental Imaging Revenue by Application (2025-2030) & (US$ Million)
Table 89. Asia Dental Imaging Revenue Grow Rate (CAGR) by Country: 2019 VS 2023 VS 2030 (US$ Million)
Table 90. Asia Dental Imaging Revenue by Region (2019-2024) & (US$ Million)
Table 91. Asia Dental Imaging Revenue by Region (2025-2030) & (US$ Million)
Table 92. Asia Dental Imaging Sales by Region (2019-2024) & (K Units)
Table 93. Asia Dental Imaging Sales by Region (2025-2030) & (K Units)
Table 94. Middle East, Africa and Latin America Dental Imaging Sales by Type (2019-2024) & (K Units)
Table 95. Middle East, Africa and Latin America Dental Imaging Sales by Type (2025-2030) & (K Units)
Table 96. Middle East, Africa and Latin America Dental Imaging Revenue by Type (2019-2024) & (US$ Million)
Table 97. Middle East, Africa and Latin America Dental Imaging Revenue by Type (2025-2030) & (US$ Million)
Table 98. Middle East, Africa and Latin America Dental Imaging Sales by Application (2019-2024) & (K Units)
Table 99. Middle East, Africa and Latin America Dental Imaging Sales by Application (2025-2030) & (K Units)
Table 100. Middle East, Africa and Latin America Dental Imaging Revenue by Application (2019-2024) & (US$ Million)
Table 101. Middle East, Africa and Latin America Dental Imaging Revenue by Application (2025-2030) & (US$ Million)
Table 102. Middle East, Africa and Latin America Dental Imaging Revenue Grow Rate (CAGR) by Country: 2019 VS 2023 VS 2030 (US$ Million)
Table 103. Middle East, Africa and Latin America Dental Imaging Revenue by Country (2019-2024) & (US$ Million)
Table 104. Middle East, Africa and Latin America Dental Imaging Revenue by Country (2025-2030) & (US$ Million)
Table 105. Middle East, Africa and Latin America Dental Imaging Sales by Country (2019-2024) & (K Units)
Table 106. Middle East, Africa and Latin America Dental Imaging Sales by Country (2025-2030) & (K Units)
Table 107. Danaher Corporation Company Information
Table 108. Danaher Corporation Description and Major Businesses
Table 109. Danaher Corporation Dental Imaging Sales (K Units), Revenue (US$ Million), Price (USD/Unit) and Gross Margin (2019-2024)
Table 110. Danaher Corporation Dental Imaging Product Model Numbers, Pictures, Descriptions and Specifications
Table 111. Danaher Corporation Recent Developments
Table 112. Carestream Health(Subsidiary Of Onex Corporation) Company Information
Table 113. Carestream Health(Subsidiary Of Onex Corporation) Description and Major Businesses
Table 114. Carestream Health(Subsidiary Of Onex Corporation) Dental Imaging Sales (K Units), Revenue (US$ Million), Price (USD/Unit) and Gross Margin (2019-2024)
Table 115. Carestream Health(Subsidiary Of Onex Corporation) Dental Imaging Product Model Numbers, Pictures, Descriptions and Specifications
Table 116. Carestream Health(Subsidiary Of Onex Corporation) Recent Developments
Table 117. Planmeca Oy Company Information
Table 118. Planmeca Oy Description and Major Businesses
Table 119. Planmeca Oy Dental Imaging Sales (K Units), Revenue (US$ Million), Price (USD/Unit) and Gross Margin (2019-2024)
Table 120. Planmeca Oy Dental Imaging Product Model Numbers, Pictures, Descriptions and Specifications
Table 121. Planmeca Oy Recent Developments
Table 122. Sirona Dental Systems Company Information
Table 123. Sirona Dental Systems Description and Major Businesses
Table 124. Sirona Dental Systems Dental Imaging Sales (K Units), Revenue (US$ Million), Price (USD/Unit) and Gross Margin (2019-2024)
Table 125. Sirona Dental Systems Dental Imaging Product Model Numbers, Pictures, Descriptions and Specifications
Table 126. Sirona Dental Systems Recent Developments
Table 127. Dentsply International Company Information
Table 128. Dentsply International Description and Major Businesses
Table 129. Dentsply International Dental Imaging Sales (K Units), Revenue (US$ Million), Price (USD/Unit) and Gross Margin (2019-2024)
Table 130. Dentsply International Dental Imaging Product Model Numbers, Pictures, Descriptions and Specifications
Table 131. Dentsply International Recent Developments
Table 132. Flow Dental Corporation Company Information
Table 133. Flow Dental Corporation Description and Major Businesses
Table 134. Flow Dental Corporation Dental Imaging Sales (K Units), Revenue (US$ Million), Price (USD/Unit) and Gross Margin (2019-2024)
Table 135. Flow Dental Corporation Dental Imaging Product Model Numbers, Pictures, Descriptions and Specifications
Table 136. Flow Dental Corporation Recent Developments
Table 137. Led Medical Diagnostic Company Information
Table 138. Led Medical Diagnostic Description and Major Businesses
Table 139. Led Medical Diagnostic Dental Imaging Sales (K Units), Revenue (US$ Million), Price (USD/Unit) and Gross Margin (2019-2024)
Table 140. Led Medical Diagnostic Dental Imaging Product Model Numbers, Pictures, Descriptions and Specifications
Table 141. Led Medical Diagnostic Recent Developments
Table 142. Midmark Corporation Company Information
Table 143. Midmark Corporation Description and Major Businesses
Table 144. Midmark Corporation Dental Imaging Sales (K Units), Revenue (US$ Million), Price (USD/Unit) and Gross Margin (2019-2024)
Table 145. Midmark Corporation Dental Imaging Product Model Numbers, Pictures, Descriptions and Specifications
Table 146. Midmark Corporation Recent Developments
Table 147. The Yoshida Dental Mfg.. Company Information
Table 148. The Yoshida Dental Mfg.. Description and Major Businesses
Table 149. The Yoshida Dental Mfg.. Dental Imaging Sales (K Units), Revenue (US$ Million), Price (USD/Unit) and Gross Margin (2019-2024)
Table 150. The Yoshida Dental Mfg.. Dental Imaging Product Model Numbers, Pictures, Descriptions and Specifications
Table 151. The Yoshida Dental Mfg.. Recent Developments
Table 152. Vatech Co. Ltd. Company Information
Table 153. Vatech Co. Ltd. Description and Major Businesses
Table 154. Vatech Co. Ltd. Dental Imaging Sales (K Units), Revenue (US$ Million), Price (USD/Unit) and Gross Margin (2019-2024)
Table 155. Vatech Co. Ltd. Dental Imaging Product Model Numbers, Pictures, Descriptions and Specifications
Table 156. Vatech Co. Ltd. Recent Developments
Table 157. Key Raw Materials Lists
Table 158. Raw Materials Key Suppliers Lists
Table 159. Dental Imaging Distributors List
Table 160. Dental Imaging Customers List
Table 161. Dental Imaging Market Trends
Table 162. Dental Imaging Market Drivers
Table 163. Dental Imaging Market Challenges
Table 164. Dental Imaging Market Restraints
Table 165. Research Programs/Design for This Report
Table 166. Key Data Information from Secondary Sources
Table 167. Key Data Information from Primary Sources
List of Figures
Figure 1. Dental Imaging Product Picture
Figure 2. Global Dental Imaging Market Size Growth Rate by Type, 2019 VS 2023 VS 2030 (US$ Million)
Figure 3. Global Dental Imaging Market Share by Type in 2023 & 2030
Figure 4. Extraoral Imaging Product Picture
Figure 5. Intraoral Imaging Product Picture
Figure 6. Global Dental Imaging Market Size Growth Rate by Application, 2019 VS 2023 VS 2030 (US$ Million)
Figure 7. Global Dental Imaging Market Share by Application in 2023 & 2030
Figure 8. Dental Clinics
Figure 9. Dental Laboratories
Figure 10. Dental Academic and Research Institutes
Figure 11. Forensic Laboratories
Figure 12. Dental Imaging Report Years Considered
Figure 13. Global Dental Imaging Revenue, (US$ Million), 2019 VS 2023 VS 2030
Figure 14. Global Dental Imaging Revenue 2019-2030 (US$ Million)
Figure 15. Global Dental Imaging Revenue Market Share by Region in Percentage: 2023 Versus 2030
Figure 16. Global Dental Imaging Revenue Market Share by Region (2019-2030)
Figure 17. Global Dental Imaging Sales 2019-2030 ((K Units)
Figure 18. Global Dental Imaging Sales Market Share by Region (2019-2030)
Figure 19. US & Canada Dental Imaging Sales YoY (2019-2030) & (K Units)
Figure 20. US & Canada Dental Imaging Revenue YoY (2019-2030) & (US$ Million)
Figure 21. Europe Dental Imaging Sales YoY (2019-2030) & (K Units)
Figure 22. Europe Dental Imaging Revenue YoY (2019-2030) & (US$ Million)
Figure 23. China Dental Imaging Sales YoY (2019-2030) & (K Units)
Figure 24. China Dental Imaging Revenue YoY (2019-2030) & (US$ Million)
Figure 25. Asia (excluding China) Dental Imaging Sales YoY (2019-2030) & (K Units)
Figure 26. Asia (excluding China) Dental Imaging Revenue YoY (2019-2030) & (US$ Million)
Figure 27. Middle East, Africa and Latin America Dental Imaging Sales YoY (2019-2030) & (K Units)
Figure 28. Middle East, Africa and Latin America Dental Imaging Revenue YoY (2019-2030) & (US$ Million)
Figure 29. The Dental Imaging Market Share of Top 10 and Top 5 Largest Manufacturers Around the World in 2023
Figure 30. The Top 5 and 10 Largest Manufacturers of Dental Imaging in the World: Market Share by Dental Imaging Revenue in 2023
Figure 31. Global Dental Imaging Market Share by Company Type (Tier 1, Tier 2, and Tier 3): 2019 VS 2023
Figure 32. Global Dental Imaging Sales Market Share by Type (2019-2030)
Figure 33. Global Dental Imaging Revenue Market Share by Type (2019-2030)
Figure 34. Global Dental Imaging Sales Market Share by Application (2019-2030)
Figure 35. Global Dental Imaging Revenue Market Share by Application (2019-2030)
Figure 36. US & Canada Dental Imaging Sales Market Share by Type (2019-2030)
Figure 37. US & Canada Dental Imaging Revenue Market Share by Type (2019-2030)
Figure 38. US & Canada Dental Imaging Sales Market Share by Application (2019-2030)
Figure 39. US & Canada Dental Imaging Revenue Market Share by Application (2019-2030)
Figure 40. US & Canada Dental Imaging Revenue Share by Country (2019-2030)
Figure 41. US & Canada Dental Imaging Sales Share by Country (2019-2030)
Figure 42. U.S. Dental Imaging Revenue (2019-2030) & (US$ Million)
Figure 43. Canada Dental Imaging Revenue (2019-2030) & (US$ Million)
Figure 44. Europe Dental Imaging Sales Market Share by Type (2019-2030)
Figure 45. Europe Dental Imaging Revenue Market Share by Type (2019-2030)
Figure 46. Europe Dental Imaging Sales Market Share by Application (2019-2030)
Figure 47. Europe Dental Imaging Revenue Market Share by Application (2019-2030)
Figure 48. Europe Dental Imaging Revenue Share by Country (2019-2030)
Figure 49. Europe Dental Imaging Sales Share by Country (2019-2030)
Figure 50. Germany Dental Imaging Revenue (2019-2030) & (US$ Million)
Figure 51. France Dental Imaging Revenue (2019-2030) & (US$ Million)
Figure 52. U.K. Dental Imaging Revenue (2019-2030) & (US$ Million)
Figure 53. Italy Dental Imaging Revenue (2019-2030) & (US$ Million)
Figure 54. Russia Dental Imaging Revenue (2019-2030) & (US$ Million)
Figure 55. China Dental Imaging Sales Market Share by Type (2019-2030)
Figure 56. China Dental Imaging Revenue Market Share by Type (2019-2030)
Figure 57. China Dental Imaging Sales Market Share by Application (2019-2030)
Figure 58. China Dental Imaging Revenue Market Share by Application (2019-2030)
Figure 59. Asia Dental Imaging Sales Market Share by Type (2019-2030)
Figure 60. Asia Dental Imaging Revenue Market Share by Type (2019-2030)
Figure 61. Asia Dental Imaging Sales Market Share by Application (2019-2030)
Figure 62. Asia Dental Imaging Revenue Market Share by Application (2019-2030)
Figure 63. Asia Dental Imaging Revenue Share by Region (2019-2030)
Figure 64. Asia Dental Imaging Sales Share by Region (2019-2030)
Figure 65. Japan Dental Imaging Revenue (2019-2030) & (US$ Million)
Figure 66. South Korea Dental Imaging Revenue (2019-2030) & (US$ Million)
Figure 67. China Taiwan Dental Imaging Revenue (2019-2030) & (US$ Million)
Figure 68. Southeast Asia Dental Imaging Revenue (2019-2030) & (US$ Million)
Figure 69. India Dental Imaging Revenue (2019-2030) & (US$ Million)
Figure 70. Middle East, Africa and Latin America Dental Imaging Sales Market Share by Type (2019-2030)
Figure 71. Middle East, Africa and Latin America Dental Imaging Revenue Market Share by Type (2019-2030)
Figure 72. Middle East, Africa and Latin America Dental Imaging Sales Market Share by Application (2019-2030)
Figure 73. Middle East, Africa and Latin America Dental Imaging Revenue Market Share by Application (2019-2030)
Figure 74. Middle East, Africa and Latin America Dental Imaging Revenue Share by Country (2019-2030)
Figure 75. Middle East, Africa and Latin America Dental Imaging Sales Share by Country (2019-2030)
Figure 76. Brazil Dental Imaging Revenue (2019-2030) & (US$ Million)
Figure 77. Mexico Dental Imaging Revenue (2019-2030) & (US$ Million)
Figure 78. Turkey Dental Imaging Revenue (2019-2030) & (US$ Million)
Figure 79. Israel Dental Imaging Revenue (2019-2030) & (US$ Million)
Figure 80. GCC Countries Dental Imaging Revenue (2019-2030) & (US$ Million)
Figure 81. Dental Imaging Value Chain
Figure 82. Dental Imaging Production Process
Figure 83. Channels of Distribution
Figure 84. Distributors Profiles
Figure 85. Bottom-up and Top-down Approaches for This Report
Figure 86. Data Triangulation
Figure 87. Key Executives Interviewed

