
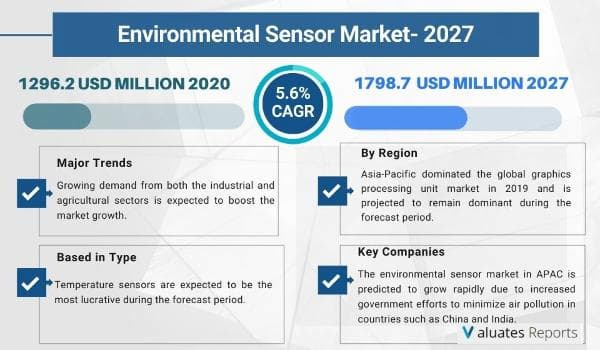
The global environmental sensor market size is projected to reach US$ 1798.7 million by 2027 from US$ 1296.2 million in 2020 at a CAGR of 5.6% during 2021-2027. Key drivers of the environmental sensor market are increasing usage of air monitoring stations and stringent government regulations for decreasing pollution levels for health and safety concerns. Further. increasing demand from the industrial, agricultural sector, and smart home initiatives are expected to drive the growth of the environmental sensor market during the forecast period. Moreover, technological advancements, innovations in sensors, and growing investments in environmental management due to increasing awareness regarding climate change will create lucrative opportunities for the growth of the market during the forecast period. Widespread application in various other sectors such as waste disposal and proper pesticide management is also expected to drive the market growth in the coming years,
Rising usage of air monitoring stations and stringent government regulations
The world has now become aware of the importance of sustainable environmental growth thereby leading to increasing usage of air monitoring stations in many places across the globe. In addition to it, governments around the world are implementing stringent rules and regulations for decreasing air pollution levels for health and safety concerns. Thus the need for intelligent detection of pollutants becomes necessary leading to widescale adoption of environment sensors ultimately driving the growth of the environmental sensor market during the forecast period.
Increasing adoption in industrial, agricultural, and smart home sectors
Sensors sense surroundings as per their algorithm and provide real-time data based on their detection capability. These sensors have the ability to link various devices and systems through wireless technology enabling detection of changes in height, length, temperature, and skillful processing of products. They also enhance product quality, reduce production costs, predict climate, crop health status and provide pest management, etc for proper crop harvesting thereby finding applications in industrial and agricultural sectors. Moreover, sensors are used in smart home initiatives including green buildings for reducing energy and water consumption. Thus growing usage in industrial, agricultural, and smart home initiatives will propel the growth of the environmental sensor market in the coming years.
Technological advancements, innovations, and growing investments
Due to growing awareness regarding climate change governments around the world are investing heavily in proper environmental management leading to the emergence of new technologies such as IoT and cloud-based services. Environmental protection is the topmost agenda of various countries. Moreover increasing capabilities of sensors with rapid processing, fast detection, rising sensibility, and more developments in the engineering of individual sensors is expected to accelerate the growth of the environmental sensor market in the coming years.
Widespread application in various sectors
Sensors also find application in the combustion of fossil fuels, water quality management, weather prediction, waste disposal, disaster detection, greenhouse gas emissions control, pesticide management, oceanic, terrestrial and atmospheric environment further expanding the growth of the environmental sensor market during the forecast period.
Based on type, temperature sensors are expected to provide lucrative opportunities for growth in the environmental sensor market share during the forecast period due to the rising adoption of temperature sensors in portable devices, measuring environmental parameters, technological advancements, and growing demand from residential and smart city sectors
Based on application, government and public utilities are expected to provide lucrative opportunities for growth in the environmental sensor market share during the forecast period due to growing government projects for installing weather monitoring stations to curb environmental pollution.
Based on region, Asia Pacific is expected to provide lucrative opportunities for growth in the environmental sensor market share during the forecast period due to increasing government initiatives to curb pollution in emerging economies such as China, India and growing penetration of environmental sensor fitted smart devices.The major regions covered in the report are North America, Europe, Asia-Pacific, South America, Middle East & Africa, etc. The report has specifically covered major countries including U.S., Canada, Germany, France, U.K., Italy, Russia, China, Japan, South Korea, India, Australia, Taiwan, Indonesia, Thailand, Malaysia, Philippines, Vietnam, Mexico, Brazil, Turkey, Saudi Arabia, U.A.E, etc. It includes revenue and volume analysis of each region and their respective countries for the forecast years. It also contains country-wise volume and revenue from the year 2016 to 2021. Additionally, it provides the reader with accurate data on volume sales according to the consumption for the same years.
Competitive Landscape:
The report provides a list of all the key players in the Environmental Sensor market along with a detailed analysis of the strategies, which the companies are adopting. The strategies mainly include new product Developments, research, and Developments, and also provides revenue shares, company overview, and recent company Developments to remain competitive in the market.
|
Report Metric |
Details |
|
Report Name |
Environmental Sensor Market |
|
The Market size value in 2020 |
1296.2 Million USD |
|
The Revenue forecast in 2027 |
1798.7 Million USD |
|
Growth Rate |
CAGR of 5.6% from 2021 to 2026 |
|
Base year considered |
2020 |
|
Forecast period |
2021-2027 |
|
Forecast units |
Value (USD) |
|
Segments covered |
Type, End-User, Offerings, and Region |
|
Report coverage |
Revenue & volume forecast, company share, competitive landscape, growth factors, and trends |
|
Geographic regions covered |
North America, Europe, Asia Pacific, Latin America, Middle East & Africa |
|
Companies covered |
Bosch Sensortec, Sensirion, AMS AG, Honeywell, Siemens, Omron, Raritan, Texas Instruments, Schneider Electric, Amphenol & Others. |
Ans. Environmental Sensor provides detailed and reliable data on key environmental parameters, like temperature and combined temperature / humidity, water, air flow, etc, as more exotic sensors for measuring the level of fuel in a fuel storage tank.
Ans. The global Environmental Sensor market size is projected to reach USD 1798.7 million by 2027, from USD 1296.2 million in 2020.
Ans. The global Environmental Sensor market is expected to grow at a compound annual growth rate of 5.6% from 2021 to 2027.
Ans. Bosch Sensortec, Sensirion, AMS AG, Honeywell, Siemens, Omron, Raritan, Texas Instruments, Schneider Electric, Amphenol & Others.
Table of Contents
1 Environmental Sensor Market Overview
1.1 Environmental Sensor Product Overview
1.2 Environmental Sensor Market Segment by Type
1.2.1 Temperature
1.2.2 Humidity
1.2.3 Air Quality
1.2.4 UV
1.2.5 Integrated Environmental Sensor
1.2.6 Soil Moisture
1.2.7 Water Quality
1.3 Global Environmental Sensor Market Size by Type
1.3.1 Global Environmental Sensor Market Size Overview by Type (2016-2027)
1.3.2 Global Environmental Sensor Historic Market Size Review by Type (2016-2021)
1.3.2.1 Global Environmental Sensor Sales Breakdown in Volume by Type (2016-2021)
1.3.2.2 Global Environmental Sensor Sales Breakdown in Value by Type (2016-2021)
1.3.2.3 Global Environmental Sensor Average Selling Price (ASP) by Type (2016-2021)
1.3.3 Global Environmental Sensor Forecasted Market Size by Type (2022-2027)
1.3.3.1 Global Environmental Sensor Sales Breakdown in Volume by Type (2022-2027)
1.3.3.2 Global Environmental Sensor Sales Breakdown in Value by Type (2022-2027)
1.3.3.3 Global Environmental Sensor Average Selling Price (ASP) by Type (2022-2027)
1.4 Key Regions Market Size Segment by Type
1.4.1 North America Environmental Sensor Sales Breakdown by Type (2016-2021)
1.4.2 Europe Environmental Sensor Sales Breakdown by Type (2016-2021)
1.4.3 Asia-Pacific Environmental Sensor Sales Breakdown by Type (2016-2021)
1.4.4 Latin America Environmental Sensor Sales Breakdown by Type (2016-2021)
1.4.5 Middle East and Africa Environmental Sensor Sales Breakdown by Type (2016-2021)
2 Global Environmental Sensor Market Competition by Company
2.1 Global Top Players by Environmental Sensor Sales (2016-2021)
2.2 Global Top Players by Environmental Sensor Revenue (2016-2021)
2.3 Global Top Players Environmental Sensor Price (2016-2021)
2.4 Global Top Manufacturers Environmental Sensor Manufacturing Base Distribution, Sales Area, Product Type
2.5 Environmental Sensor Market Competitive Situation and Trends
2.5.1 Environmental Sensor Market Concentration Rate (2016-2021)
2.5.2 Global 5 and 10 Largest Manufacturers by Environmental Sensor Sales and Revenue in 2020
2.6 Global Top Manufacturers by Company Type (Tier 1, Tier 2 and Tier 3) & (based on the Revenue in Environmental Sensor as of 2020)
2.7 Date of Key Manufacturers Enter into Environmental Sensor Market
2.8 Key Manufacturers Environmental Sensor Product Offered
2.9 Mergers & Acquisitions, Expansion
3 Environmental Sensor Status and Outlook by Region
3.1 Global Environmental Sensor Market Size and CAGR by Region: 2016 VS 2021 VS 2026
3.2 Global Environmental Sensor Historic Market Size by Region
3.2.1 Global Environmental Sensor Sales in Volume by Region (2016-2021)
3.2.2 Global Environmental Sensor Sales in Value by Region (2016-2021)
3.2.3 Global Environmental Sensor Sales (Volume & Value) Price and Gross Margin (2016-2021)
3.3 Global Environmental Sensor Forecasted Market Size by Region
3.3.1 Global Environmental Sensor Sales in Volume by Region (2022-2027)
3.3.2 Global Environmental Sensor Sales in Value by Region (2022-2027)
3.3.3 Global Environmental Sensor Sales (Volume & Value), Price and Gross Margin (2022-2027)
4 Global Environmental Sensor by Application
4.1 Environmental Sensor Market Segment by Application
4.1.1 Government & Public Utilities
4.1.2 Commercial
4.1.3 Enterprise
4.1.4 Consumer Electronics
4.1.5 Residential
4.1.6 Healthcare & Pharmaceutical
4.1.7 Industrial
4.1.8 Others
4.2 Global Environmental Sensor Market Size by Application
4.2.1 Global Environmental Sensor Market Size Overview by Application (2016-2027)
4.2.2 Global Environmental Sensor Historic Market Size Review by Application (2016-2021)
4.2.2.1 Global Environmental Sensor Sales Breakdown in Volume, by Application (2016-2021)
4.2.2.2 Global Environmental Sensor Sales Breakdown in Value, by Application (2016-2021)
4.2.2.3 Global Environmental Sensor Average Selling Price (ASP) by Application (2016-2021)
4.2.3 Global Environmental Sensor Forecasted Market Size by Application (2022-2027)
4.2.3.1 Global Environmental Sensor Sales Breakdown in Volume, by Application (2022-2027)
4.2.3.2 Global Environmental Sensor Sales Breakdown in Value, by Application (2022-2027)
4.2.3.3 Global Environmental Sensor Average Selling Price (ASP) by Application (2022-2027)
4.3 Key Regions Market Size Segment by Application
4.3.1 North America Environmental Sensor Sales Breakdown by Application (2016-2021)
4.3.2 Europe Environmental Sensor Sales Breakdown by Application (2016-2021)
4.3.3 Asia-Pacific Environmental Sensor Sales Breakdown by Application (2016-2021)
4.3.4 Latin America Environmental Sensor Sales Breakdown by Application (2016-2021)
4.3.5 Middle East and Africa Environmental Sensor Sales Breakdown by Application (2016-2021)
5 North America Environmental Sensor by Country
5.1 North America Environmental Sensor Historic Market Size by Country
5.1.1 North America Environmental Sensor Sales in Volume by Country (2016-2021)
5.1.2 North America Environmental Sensor Sales in Value by Country (2016-2021)
5.2 North America Environmental Sensor Forecasted Market Size by Country
5.2.1 North America Environmental Sensor Sales in Volume by Country (2022-2027)
5.2.2 North America Environmental Sensor Sales in Value by Country (2022-2027)
6 Europe Environmental Sensor by Country
6.1 Europe Environmental Sensor Historic Market Size by Country
6.1.1 Europe Environmental Sensor Sales in Volume by Country (2016-2021)
6.1.2 Europe Environmental Sensor Sales in Value by Country (2016-2021)
6.2 Europe Environmental Sensor Forecasted Market Size by Country
6.2.1 Europe Environmental Sensor Sales in Volume by Country (2022-2027)
6.2.2 Europe Environmental Sensor Sales in Value by Country (2022-2027)
7 Asia-Pacific Environmental Sensor by Region
7.1 Asia-Pacific Environmental Sensor Historic Market Size by Region
7.1.1 Asia-Pacific Environmental Sensor Sales in Volume by Region (2016-2021)
7.1.2 Asia-Pacific Environmental Sensor Sales in Value by Region (2016-2021)
7.2 Asia-Pacific Environmental Sensor Forecasted Market Size by Region
7.2.1 Asia-Pacific Environmental Sensor Sales in Volume by Region (2022-2027)
7.2.2 Asia-Pacific Environmental Sensor Sales in Value by Region (2022-2027)
8 Latin America Environmental Sensor by Country
8.1 Latin America Environmental Sensor Historic Market Size by Country
8.1.1 Latin America Environmental Sensor Sales in Volume by Country (2016-2021)
8.1.2 Latin America Environmental Sensor Sales in Value by Country (2016-2021)
8.2 Latin America Environmental Sensor Forecasted Market Size by Country
8.2.1 Latin America Environmental Sensor Sales in Volume by Country (2022-2027)
8.2.2 Latin America Environmental Sensor Sales in Value by Country (2022-2027)
9 Middle East and Africa Environmental Sensor by Country
9.1 Middle East and Africa Environmental Sensor Historic Market Size by Country
9.1.1 Middle East and Africa Environmental Sensor Sales in Volume by Country (2016-2021)
9.1.2 Middle East and Africa Environmental Sensor Sales in Value by Country (2016-2021)
9.2 Middle East and Africa Environmental Sensor Forecasted Market Size by Country
9.2.1 Middle East and Africa Environmental Sensor Sales in Volume by Country (2022-2027)
9.2.2 Middle East and Africa Environmental Sensor Sales in Value by Country (2022-2027)
10 Company Profiles and Key Figures in Environmental Sensor Business
10.1 Bosch Sensortec
10.1.1 Bosch Sensortec Corporation Information
10.1.2 Bosch Sensortec Introduction and Business Overview
10.1.3 Bosch Sensortec Environmental Sensor Sales, Revenue and Gross Margin (2016-2021)
10.1.4 Bosch Sensortec Environmental Sensor Products Offered
10.1.5 Bosch Sensortec Recent Development
10.2 Sensirion
10.2.1 Sensirion Corporation Information
10.2.2 Sensirion Introduction and Business Overview
10.2.3 Sensirion Environmental Sensor Sales, Revenue and Gross Margin (2016-2021)
10.2.4 Bosch Sensortec Environmental Sensor Products Offered
10.2.5 Sensirion Recent Development
10.3 AMS AG
10.3.1 AMS AG Corporation Information
10.3.2 AMS AG Introduction and Business Overview
10.3.3 AMS AG Environmental Sensor Sales, Revenue and Gross Margin (2016-2021)
10.3.4 AMS AG Environmental Sensor Products Offered
10.3.5 AMS AG Recent Development
10.4 Honeywell
10.4.1 Honeywell Corporation Information
10.4.2 Honeywell Introduction and Business Overview
10.4.3 Honeywell Environmental Sensor Sales, Revenue and Gross Margin (2016-2021)
10.4.4 Honeywell Environmental Sensor Products Offered
10.4.5 Honeywell Recent Development
10.5 Siemens
10.5.1 Siemens Corporation Information
10.5.2 Siemens Introduction and Business Overview
10.5.3 Siemens Environmental Sensor Sales, Revenue and Gross Margin (2016-2021)
10.5.4 Siemens Environmental Sensor Products Offered
10.5.5 Siemens Recent Development
10.6 Omron
10.6.1 Omron Corporation Information
10.6.2 Omron Introduction and Business Overview
10.6.3 Omron Environmental Sensor Sales, Revenue and Gross Margin (2016-2021)
10.6.4 Omron Environmental Sensor Products Offered
10.6.5 Omron Recent Development
10.7 Raritan
10.7.1 Raritan Corporation Information
10.7.2 Raritan Introduction and Business Overview
10.7.3 Raritan Environmental Sensor Sales, Revenue and Gross Margin (2016-2021)
10.7.4 Raritan Environmental Sensor Products Offered
10.7.5 Raritan Recent Development
10.8 Texas Instruments
10.8.1 Texas Instruments Corporation Information
10.8.2 Texas Instruments Introduction and Business Overview
10.8.3 Texas Instruments Environmental Sensor Sales, Revenue and Gross Margin (2016-2021)
10.8.4 Texas Instruments Environmental Sensor Products Offered
10.8.5 Texas Instruments Recent Development
10.9 Schneider Electric
10.9.1 Schneider Electric Corporation Information
10.9.2 Schneider Electric Introduction and Business Overview
10.9.3 Schneider Electric Environmental Sensor Sales, Revenue and Gross Margin (2016-2021)
10.9.4 Schneider Electric Environmental Sensor Products Offered
10.9.5 Schneider Electric Recent Development
10.10 Amphenol
10.10.1 Company Basic Information, Manufacturing Base and Competitors
10.10.2 Environmental Sensor Product Category, Application and Specification
10.10.3 Amphenol Environmental Sensor Sales, Revenue, Price and Gross Margin (2016-2021)
10.10.4 Main Business Overview
10.10.5 Amphenol Recent Development
11 Upstream, Opportunities, Challenges, Risks and Influences Factors Analysis
11.1 Environmental Sensor Key Raw Materials
11.1.1 Key Raw Materials
11.1.2 Key Raw Materials Price
11.1.3 Raw Materials Key Suppliers
11.2 Manufacturing Cost Structure
11.2.1 Raw Materials
11.2.2 Labor Cost
11.2.3 Manufacturing Expenses
11.3 Environmental Sensor Industrial Chain Analysis
11.4 Environmental Sensor Market Dynamics
11.4.1 Industry Trends
11.4.2 Market Drivers
11.4.3 Market Challenges
11.4.4 Market Restraints
12 Market Strategy Analysis, Distributors
12.1 Sales Channel
12.2 Environmental Sensor Distributors
12.3 Environmental Sensor Downstream Customers
13 Research Findings and Conclusion
14 Appendix
14.1 Research Methodology
14.1.1 Methodology/Research Approach
14.1.1.1 Research Programs/Design
14.1.1.2 Market Size Estimation
14.1.1.3 Market Breakdown and Data Triangulation
14.1.2 Data Source
14.1.2.1 Secondary Sources
14.1.2.2 Primary Sources
14.2 Author Details
14.3 Disclaimer
List of Tables
Table 1. Major Company of Temperature
Table 2. Major Company of Humidity
Table 3. Major Company of Air Quality
Table 4. Major Company of UV
Table 5. Major Company of Integrated Environmental Sensor
Table 6. Major Company of Soil Moisture
Table 7. Major Company of Water Quality
Table 8. Global Environmental Sensor Sales by Type 2016 VS 2021 VS 2027 (US$ Million)
Table 9. Global Environmental Sensor Sales by Type (2016-2021) & (K Units)
Table 10. Global Environmental Sensor Sales Market Share in Volume by Type (2016-2021)
Table 11. Global Environmental Sensor Sales by Type (2016-2021) & (US& Million)
Table 12. Global Environmental Sensor Market Share in Value by Type (2016-2021)
Table 13. Global Environmental Sensor Price by Type (2016-2021) & (USD/Unit)
Table 14. Global Environmental Sensor Sales by Type (2022-2027) & (K Units)
Table 15. Global Environmental Sensor Sales Market Share in Volume by Type (2022-2027)
Table 16. Global Environmental Sensor Sales by Type (2022-2027) & (US$ Million)
Table 17. Global Environmental Sensor Sales Market Share in Value by Type (2022-2027)
Table 18. Global Environmental Sensor Price by Type (2022-2027) & (USD/Unit)
Table 19. North America Environmental Sensor Sales by Type (2016-2021) & (K Units)
Table 20. North America Environmental Sensor Sales by Type (2016-2021) & (US$ Million)
Table 21. Europe Environmental Sensor Sales (K Units) by Type (2016-2021)
Table 22. Europe Environmental Sensor Sales by Type (2016-2021) & (US$ Million)
Table 23. Asia-Pacific Environmental Sensor Sales (K Units) by Type (2016-2021)
Table 24. Asia-Pacific Environmental Sensor Sales by Type (2016-2021) & (US$ Million)
Table 25. Latin America Environmental Sensor Sales (K Units) by Type (2016-2021)
Table 26. Latin America Environmental Sensor Sales by Type (2016-2021) & (US$ Million)
Table 27. Middle East and Africa Environmental Sensor Sales (K Units) by Type (2016-2021)
Table 28. Middle East and Africa Environmental Sensor Sales by Type (2016-2021) & (US$ Million)
Table 29. Global Environmental Sensor Sales by Company (2016-2021) & (K Units)
Table 30. Global Environmental Sensor Sales Share by Company (2016-2021)
Table 31. Global Environmental Sensor Revenue by Company (2016-2021) & (US$ Million)
Table 32. Global Environmental Sensor Revenue Share by Company (2016-2021)
Table 33. Global Market Environmental Sensor Price by Company (2016-2021) & (USD/Unit)
Table 34. Global Environmental Sensor Top Manufacturers Manufacturing Base Distribution and Sales Area
Table 35. Global Environmental Sensor Manufacturers Market Concentration Ratio (CR5 and HHI)
Table 36. Global Top Manufacturers Market Share by Company Type (Tier 1, Tier 2 and Tier 3) & (based on the Revenue in Environmental Sensor as of 2020
Table 37. Date of Key Manufacturers Enter into Environmental Sensor Market
Table 38. Key Manufacturers Environmental Sensor Product Type
Table 39. Mergers & Acquisitions, Expansion Plans
Table 40. Global Environmental Sensor Market Size Comparison by Region (US$ Million): 2016 VS 2021 VS 2027
Table 41. Global Environmental Sensor Sales by Region (2016-2021) & (K Units)
Table 42. Global Environmental Sensor Sales Market Share in Volume by Region (2016-2021)
Table 43. Global Environmental Sensor Sales by Region (2016-2021) & (US$ Million)
Table 44. Global Environmental Sensor Sales Market Share in Value by Region (2016-2021)
Table 45. Global Environmental Sensor Sales (K Units), Revenue (US$ Million), Price (USD/Unit) and Gross Margin (2016-2021)
Table 46. Global Environmental Sensor Sales by Region (2022-2027) & (K Units)
Table 47. Global Environmental Sensor Sales Market Share in Volume by Region (2022-2027)
Table 48. Global Environmental Sensor Sales by Region (2022-2027) & (US$ Million)
Table 49. Global Environmental Sensor Sales Market Share in Value by Region (2022-2027)
Table 50. Global Environmental Sensor Sales (K Units), Revenue (US$ Million), Price (USD/Unit) and Gross Margin (2022-2027)
Table 51. Global Environmental Sensor Sales by Application: 2016 VS 2021 VS 2027 (US$ Million)
Table 52. Global Environmental Sensor Sales by Application (2016-2021) & (K Units)
Table 53. Global Environmental Sensor Sales Market Share in Volume by Application (2016-2021)
Table 54. Global Environmental Sensor Sales by Application (2016-2021) & (US$ Million)
Table 55. Global Environmental Sensor Sales Market Share in Value by Application (2016-2021)
Table 56. Global Environmental Sensor Price by Application (2016-2021) & (USD/Unit)
Table 57. Global Environmental Sensor Sales by Application (2022-2027) & (K Units)
Table 58. Global Environmental Sensor Sales Market Share in Volume by Application (2022-2027)
Table 59. Global Environmental Sensor Sales by Application (2022-2027) & (US$ Million)
Table 60. Global Environmental Sensor Sales Market Share in Value by Application (2022-2027)
Table 61. Global Environmental Sensor Price by Application (2022-2027) & (USD/Unit)
Table 62. North America Environmental Sensor Sales by Application (2016-2021) (K Units)
Table 63. North America Environmental Sensor Sales by Application (2016-2021) & (US$ Million)
Table 64. North America Environmental Sensor Sales Market Share in Value by Application in 2020
Table 65. Europe Environmental Sensor Sales by Application (2016-2021) (K Units)
Table 66. Europe Environmental Sensor Sales by Application (2016-2021) & (US$ Million)
Table 67. Europe Environmental Sensor Sales Market Share in Value by Application in 2020
Table 68. Asia-Pacific Environmental Sensor Sales by Application (2016-2021) (K Units)
Table 69. Asia-Pacific Environmental Sensor Sales by Application (2016-2021) & (US$ Million)
Table 70. Asia-Pacific Environmental Sensor Sales Market Share in Value by Application in 2020
Table 71. Latin America Environmental Sensor Sales by Application (2016-2021) (K Units)
Table 72. Latin America Environmental Sensor Sales by Application (2016-2021) & (US$ Million)
Table 73. Latin America Environmental Sensor Sales Market Share in Value by Application in 2020
Table 74. Middle East and Africa Environmental Sensor Sales by Application (2016-2021) (K Units)
Table 75. Middle East and Africa Environmental Sensor Sales by Application (2016-2021) & (US$ Million)
Table 76. Middle East and Africa Environmental Sensor Sales Market Share in Value by Application in 2020
Table 77. North America Environmental Sensor Sales by Country (2016-2021) & (K Units)
Table 78. North America Environmental Sensor Sales Market Share in Volume by Country (2016-2021)
Table 79. North America Environmental Sensor Sales by Country (2016-2021) & (US$ Million)
Table 80. North America Environmental Sensor Sales Market Share in Value by Country (2016-2021)
Table 81. North America Environmental Sensor Sales by Country (2022-2027) & (K Units)
Table 82. North America Environmental Sensor Sales Market Share in Volume by Country (2022-2027)
Table 83. North America Environmental Sensor Sales by Country (2022-2027) & (US$ Million)
Table 84. North America Environmental Sensor Sales Market Share in Value by Country (2022-2027)
Table 85. Europe Environmental Sensor Sales by Country (2016-2021) & (K Units)
Table 86. Europe Environmental Sensor Sales Market Share in Volume by Country (2016-2021)
Table 87. Europe Environmental Sensor Sales by Country (2016-2021) & (US$ Million)
Table 88. Europe Environmental Sensor Sales Market Share in Value by Country (2016-2021)
Table 89. Europe Environmental Sensor Sales by Country (2022-2027) & (K Units)
Table 90. Europe Environmental Sensor Sales Market Share in Volume by Country (2022-2027)
Table 91. Europe Environmental Sensor Sales by Country (2022-2027) & (US$ Million)
Table 92. Europe Environmental Sensor Sales Market Share in Value by Country (2022-2027)
Table 93. Asia-Pacific Environmental Sensor Sales by Region (2016-2021) & (K Units)
Table 94. Asia-Pacific Environmental Sensor Sales Market Share in Volume by Region (2016-2021)
Table 95. Asia-Pacific Environmental Sensor Sales by Region (2016-2021) & (US$ Million)
Table 96. Asia-Pacific Environmental Sensor Sales Market Share in Value by Region (2016-2021)
Table 97. Asia-Pacific Environmental Sensor Sales by Region (2022-2027) & (K Units)
Table 98. Asia-Pacific Environmental Sensor Sales Market Share in Volume by Region (2022-2027)
Table 99. Asia-Pacific Environmental Sensor Sales by Region (2022-2027) & (US$ Million)
Table 100. Asia-Pacific Environmental Sensor Sales Market Share in Value by Region (2022-2027)
Table 101. Latin America Environmental Sensor Sales by Country (2016-2021) & (K Units)
Table 102. Latin America Environmental Sensor Sales Market Share in Volume by Country (2016-2021)
Table 103. Latin America Environmental Sensor Sales by Country (2016-2021) & (US$ Million)
Table 104. Latin America Environmental Sensor Sales Market Share in Value by Country (2016-2021)
Table 105. Latin America Environmental Sensor Sales by Country (2022-2027) & (K Units)
Table 106. Latin America Environmental Sensor Sales Market Share in Volume by Country (2022-2027)
Table 107. Latin America Environmental Sensor Sales by Country (2022-2027) & (US$ Million)
Table 108. Latin America Environmental Sensor Sales Market Share in Value by Country (2022-2027)
Table 109. Middle East and Africa Environmental Sensor Sales by Country (2016-2021) & (K Units)
Table 110. Middle East and Africa Environmental Sensor Sales Market Share in Volume by Country (2016-2021)
Table 111. Middle East and Africa Environmental Sensor Sales by Country (2016-2021) & (US$ Million)
Table 112. Middle East and Africa Environmental Sensor Sales Market Share in Value by Country (2016-2021)
Table 113. Middle East and Africa Environmental Sensor Sales by Country (2022-2027) & (K Units)
Table 114. Middle East and Africa Environmental Sensor Sales Market Share in Volume by Country (2022-2027)
Table 115. Middle East and Africa Environmental Sensor Sales by Country (2022-2027) & (US$ Million)
Table 116. Middle East and Africa Environmental Sensor Sales Market Share in Value by Country (2022-2027)
Table 117. Bosch Sensortec Corporation Information
Table 118. Bosch Sensortec Introduction and Business Overview
Table 119. Bosch Sensortec Environmental Sensor Sales (K Units), Revenue (Million USD), Price (USD/Unit) and Gross Margin (2016-2021)
Table 120. Bosch Sensortec Environmental Sensor Product
Table 121. Bosch Sensortec Recent Development
Table 122. Sensirion Corporation Information
Table 123. Sensirion Introduction and Business Overview
Table 124. Sensirion Environmental Sensor Sales (K Units), Revenue (Million USD), Price (USD/Unit) and Gross Margin (2016-2021)
Table 125. Sensirion Environmental Sensor Product
Table 126. Sensirion Recent Development
Table 127. AMS AG Corporation Information
Table 128. AMS AG Introduction and Business Overview
Table 129. AMS AG Environmental Sensor Sales (K Units), Revenue (Million USD), Price (USD/Unit) and Gross Margin (2016-2021)
Table 130. AMS AG Environmental Sensor Product
Table 131. AMS AG Recent Development
Table 132. Honeywell Corporation Information
Table 133. Honeywell Introduction and Business Overview
Table 134. Honeywell Environmental Sensor Sales (K Units), Revenue (Million USD), Price (USD/Unit) and Gross Margin (2016-2021)
Table 135. Honeywell Environmental Sensor Product
Table 136. Honeywell Recent Development
Table 137. Siemens Corporation Information
Table 138. Siemens Introduction and Business Overview
Table 139. Siemens Environmental Sensor Sales (K Units), Revenue (Million USD), Price (USD/Unit) and Gross Margin (2016-2021)
Table 140. Siemens Environmental Sensor Product
Table 141. Siemens Recent Development
Table 142. Omron Corporation Information
Table 143. Omron Introduction and Business Overview
Table 144. Omron Environmental Sensor Sales (K Units), Revenue (Million USD), Price (USD/Unit) and Gross Margin (2016-2021)
Table 145. Omron Environmental Sensor Product
Table 146. Omron Recent Development
Table 147. Raritan Corporation Information
Table 148. Raritan Introduction and Business Overview
Table 149. Raritan Environmental Sensor Sales (K Units), Revenue (Million USD), Price (USD/Unit) and Gross Margin (2016-2021)
Table 150. Raritan Environmental Sensor Product
Table 151. Raritan Recent Development
Table 152. Texas Instruments Corporation Information
Table 153. Texas Instruments Introduction and Business Overview
Table 154. Texas Instruments Environmental Sensor Sales (K Units), Revenue (Million USD), Price (USD/Unit) and Gross Margin (2016-2021)
Table 155. Texas Instruments Environmental Sensor Product
Table 156. Texas Instruments Recent Development
Table 157. Schneider Electric Corporation Information
Table 158. Schneider Electric Introduction and Business Overview
Table 159. Schneider Electric Environmental Sensor Sales (K Units), Revenue (Million USD), Price (USD/Unit) and Gross Margin (2016-2021)
Table 160. Schneider Electric Environmental Sensor Product
Table 161. Schneider Electric Recent Development
Table 162. Amphenol Corporation Information
Table 163. Amphenol Introduction and Business Overview
Table 164. Amphenol Environmental Sensor Sales (K Units), Revenue (Million USD), Price (USD/Unit) and Gross Margin (2016-2021)
Table 165. Amphenol Environmental Sensor Product
Table 166. Amphenol Recent Development
Table 167. Key Raw Materials Lists
Table 168. Raw Materials Key Suppliers Lists
Table 169. Environmental Sensor Market Trends
Table 170. Environmental Sensor Market Drivers
Table 171. Environmental Sensor Market Challenges
Table 172. Environmental Sensor Market Restraints
Table 173. Environmental Sensor Distributors List
Table 174. Environmental Sensor Downstream Customers
Table 175. Research Programs/Design for This Report
Table 176. Key Data Information from Secondary Sources
Table 177. Key Data Information from Primary Sources
List of Figures
Figure 1. Environmental Sensor Product Picture
Figure 2. Global Environmental Sensor Market Size, 2016 VS 2021 VS 2027 (US$ Million)
Figure 3. Global Environmental Sensor Market Size Status and Outlook (2016-2027) & (US$ Million)
Figure 4. Global Environmental Sensor Sales Status and Outlook (2016-2027) & (K Units)
Figure 5. Product Picture of Temperature
Figure 6. Global Temperature Sales YoY Growth (2016-2021) & (K Units)
Figure 7. Product Picture of Humidity
Figure 8. Global Humidity Sales YoY Growth (2016-2021) & (K Units)
Figure 9. Product Picture of Air Quality
Figure 10. Global Air Quality Sales YoY Growth (2016-2021) & (K Units)
Figure 11. Product Picture of UV
Figure 12. Global UV Sales YoY Growth (2016-2021) & (K Units)
Figure 13. Product Picture of Integrated Environmental Sensor
Figure 14. Global Integrated Environmental Sensor Sales YoY Growth (2016-2021) & (K Units)
Figure 15. Product Picture of Soil Moisture
Figure 16. Global Soil Moisture Sales YoY Growth (2016-2021) & (K Units)
Figure 17. Product Picture of Water Quality
Figure 18. Global Water Quality Sales YoY Growth (2016-2021) & (K Units)
Figure 19. Global Environmental Sensor Sales by Type (2016-2027) & (US$ Million)
Figure 20. Global Environmental Sensor Sales Market Share in Volume by Type (2016-2021)
Figure 21. Global Environmental Sensor Sales Market Share in Value by Type (2016-2021)
Figure 22. Global Environmental Sensor Sales Market Share in Volume by Type (2022-2027)
Figure 23. Global Environmental Sensor Sales Market Share in Value by Type (2022-2027)
Figure 24. North America Environmental Sensor Sales Market Share in Volume by Type in 2020
Figure 25. North America Environmental Sensor Sales Market Share in Value by Type in 2020
Figure 26. Europe Environmental Sensor Sales Market Share in Volume by Type in 2020
Figure 27. Europe Environmental Sensor Sales Market Share in Value by Type in 2020
Figure 28. Asia-Pacific Environmental Sensor Sales Market Share in Volume by Type in 2020
Figure 29. Asia-Pacific Environmental Sensor Sales Market Share in Value by Type in 2020
Figure 30. Latin America Environmental Sensor Sales Market Share in Volume by Type in 2020
Figure 31. Latin America Environmental Sensor Sales Market Share in Value by Type in 2020
Figure 32. Middle East and Africa Environmental Sensor Sales Market Share in Volume by Type in 2020
Figure 33. Middle East and Africa Environmental Sensor Sales Market Share in Value by Type in 2020
Figure 34. The 5 and 10 Largest Manufacturers in the World: Market Share by Environmental Sensor Sales in 2020
Figure 35. The 5 and 10 Largest Manufacturers in the World: Market Share by Environmental Sensor Revenue in 2020
Figure 36. Environmental Sensor Market Share by Company Type (Tier 1, Tier 2, and Tier 3): 2016 VS 2020
Figure 37. Product Picture of Government & Public Utilities
Figure 38. Global Government & Public Utilities Sales YoY Growth (2016-2027) & (K Units)
Figure 39. Product Picture of Commercial
Figure 40. Global Commercial Sales YoY Growth (2016-2027) & (K Units)
Figure 41. Product Picture of Enterprise
Figure 42. Global Enterprise Sales YoY Growth (2016-2027) & (K Units)
Figure 43. Product Picture of Consumer Electronics
Figure 44. Global Consumer Electronics Sales YoY Growth (2016-2027) & (K Units)
Figure 45. Product Picture of Residential
Figure 46. Global Residential Sales YoY Growth (2016-2027) & (K Units)
Figure 47. Product Picture of Healthcare & Pharmaceutical
Figure 48. Global Healthcare & Pharmaceutical Sales YoY Growth (2016-2027) & (K Units)
Figure 49. Product Picture of Industrial
Figure 50. Global Industrial Sales YoY Growth (2016-2027) & (K Units)
Figure 51. Product Picture of Others
Figure 52. Global Others Sales YoY Growth (2016-2027) & (K Units)
Figure 53. Global Environmental Sensor Sales by Application (2016-2027) & (US$ Million)
Figure 54. Global Environmental Sensor Sales Market Share in Volume by Application (2016-2021)
Figure 55. Global Environmental Sensor Sales Market Share in Value by Application (2016-2021)
Figure 56. Global Environmental Sensor Sales Market Share in Volume by Application (2022-2027)
Figure 57. North America Environmental Sensor Sales Market Share in Volume by Application in 2020
Figure 58. Latin America Environmental Sensor Sales Market Share in Value by Application in 2020
Figure 59. Middle East and Africa Environmental Sensor Sales Market Share in Value by Application in 2020
Figure 60. Key Raw Materials Price
Figure 61. Environmental Sensor Manufacturing Cost Structure
Figure 62. Environmental Sensor Industrial Chain Analysis
Figure 63. Channels of Distribution
Figure 64. Distributors Profiles
Figure 65. Bottom-up and Top-down Approaches for This Report
Figure 66. Data Triangulation
Figure 67. Key Executives Interviewed
$3350
$6700
HAVE A QUERY?
OUR CUSTOMER

SIMILAR REPORTS