List of Tables
Table 1. Global Viral Vector Production (Research-use) Market Size Growth Rate by Type (US$ Million): 2020 VS 2024 VS 2031
Table 2. Key Players of Adeno-associated virus (AAV)
Table 3. Key Players of Lentivirus
Table 4. Key Players of Adenovirus
Table 5. Key Players of Retrovirus
Table 6. Key Players of Others
Table 7. Global Viral Vector Production (Research-use) Market Size Growth by Application (US$ Million): 2020 VS 2024 VS 2031
Table 8. Global Viral Vector Production (Research-use) Market Size by Region (US$ Million): 2020 VS 2024 VS 2031
Table 9. Global Viral Vector Production (Research-use) Market Size by Region (2020-2025) & (US$ Million)
Table 10. Global Viral Vector Production (Research-use) Market Share by Region (2020-2025)
Table 11. Global Viral Vector Production (Research-use) Forecasted Market Size by Region (2026-2031) & (US$ Million)
Table 12. Global Viral Vector Production (Research-use) Market Share by Region (2026-2031)
Table 13. Viral Vector Production (Research-use) Market Trends
Table 14. Viral Vector Production (Research-use) Market Drivers
Table 15. Viral Vector Production (Research-use) Market Challenges
Table 16. Viral Vector Production (Research-use) Market Restraints
Table 17. Global Viral Vector Production (Research-use) Revenue by Players (2020-2025) & (US$ Million)
Table 18. Global Viral Vector Production (Research-use) Market Share by Players (2020-2025)
Table 19. Global Top Viral Vector Production (Research-use) Players by Company Type (Tier 1, Tier 2, and Tier 3) & (based on the Revenue in Viral Vector Production (Research-use) as of 2024)
Table 20. Ranking of Global Top Viral Vector Production (Research-use) Companies by Revenue (US$ Million) in 2024
Table 21. Global 5 Largest Players Market Share by Viral Vector Production (Research-use) Revenue (CR5 and HHI) & (2020-2025)
Table 22. Global Key Players of Viral Vector Production (Research-use), Headquarters and Area Served
Table 23. Global Key Players of Viral Vector Production (Research-use), Product and Application
Table 24. Global Key Players of Viral Vector Production (Research-use), Date of Enter into This Industry
Table 25. Mergers & Acquisitions, Expansion Plans
Table 26. Global Viral Vector Production (Research-use) Market Size by Type (2020-2025) & (US$ Million)
Table 27. Global Viral Vector Production (Research-use) Revenue Market Share by Type (2020-2025)
Table 28. Global Viral Vector Production (Research-use) Forecasted Market Size by Type (2026-2031) & (US$ Million)
Table 29. Global Viral Vector Production (Research-use) Revenue Market Share by Type (2026-2031)
Table 30. Global Viral Vector Production (Research-use) Market Size by Application (2020-2025) & (US$ Million)
Table 31. Global Viral Vector Production (Research-use) Revenue Market Share by Application (2020-2025)
Table 32. Global Viral Vector Production (Research-use) Forecasted Market Size by Application (2026-2031) & (US$ Million)
Table 33. Global Viral Vector Production (Research-use) Revenue Market Share by Application (2026-2031)
Table 34. North America Viral Vector Production (Research-use) Market Size Growth Rate by Country (US$ Million): 2020 VS 2024 VS 2031
Table 35. North America Viral Vector Production (Research-use) Market Size by Country (2020-2025) & (US$ Million)
Table 36. North America Viral Vector Production (Research-use) Market Size by Country (2026-2031) & (US$ Million)
Table 37. Europe Viral Vector Production (Research-use) Market Size Growth Rate by Country (US$ Million): 2020 VS 2024 VS 2031
Table 38. Europe Viral Vector Production (Research-use) Market Size by Country (2020-2025) & (US$ Million)
Table 39. Europe Viral Vector Production (Research-use) Market Size by Country (2026-2031) & (US$ Million)
Table 40. Asia-Pacific Viral Vector Production (Research-use) Market Size Growth Rate by Region (US$ Million): 2020 VS 2024 VS 2031
Table 41. Asia-Pacific Viral Vector Production (Research-use) Market Size by Region (2020-2025) & (US$ Million)
Table 42. Asia-Pacific Viral Vector Production (Research-use) Market Size by Region (2026-2031) & (US$ Million)
Table 43. Latin America Viral Vector Production (Research-use) Market Size Growth Rate by Country (US$ Million): 2020 VS 2024 VS 2031
Table 44. Latin America Viral Vector Production (Research-use) Market Size by Country (2020-2025) & (US$ Million)
Table 45. Latin America Viral Vector Production (Research-use) Market Size by Country (2026-2031) & (US$ Million)
Table 46. Middle East & Africa Viral Vector Production (Research-use) Market Size Growth Rate by Country (US$ Million): 2020 VS 2024 VS 2031
Table 47. Middle East & Africa Viral Vector Production (Research-use) Market Size by Country (2020-2025) & (US$ Million)
Table 48. Middle East & Africa Viral Vector Production (Research-use) Market Size by Country (2026-2031) & (US$ Million)
Table 49. Merck KGaA Company Details
Table 50. Merck KGaA Business Overview
Table 51. Merck KGaA Viral Vector Production (Research-use) Product
Table 52. Merck KGaA Revenue in Viral Vector Production (Research-use) Business (2020-2025) & (US$ Million)
Table 53. Merck KGaA Recent Development
Table 54. Lonza Company Details
Table 55. Lonza Business Overview
Table 56. Lonza Viral Vector Production (Research-use) Product
Table 57. Lonza Revenue in Viral Vector Production (Research-use) Business (2020-2025) & (US$ Million)
Table 58. Lonza Recent Development
Table 59. FUJIFILM Diosynth Biotechnologies U.S.A., Inc. Company Details
Table 60. FUJIFILM Diosynth Biotechnologies U.S.A., Inc. Business Overview
Table 61. FUJIFILM Diosynth Biotechnologies U.S.A., Inc. Viral Vector Production (Research-use) Product
Table 62. FUJIFILM Diosynth Biotechnologies U.S.A., Inc. Revenue in Viral Vector Production (Research-use) Business (2020-2025) & (US$ Million)
Table 63. FUJIFILM Diosynth Biotechnologies U.S.A., Inc. Recent Development
Table 64. Cobra Biologics Ltd. Company Details
Table 65. Cobra Biologics Ltd. Business Overview
Table 66. Cobra Biologics Ltd. Viral Vector Production (Research-use) Product
Table 67. Cobra Biologics Ltd. Revenue in Viral Vector Production (Research-use) Business (2020-2025) & (US$ Million)
Table 68. Cobra Biologics Ltd. Recent Development
Table 69. Thermo Fisher Scientific Company Details
Table 70. Thermo Fisher Scientific Business Overview
Table 71. Thermo Fisher Scientific Viral Vector Production (Research-use) Product
Table 72. Thermo Fisher Scientific Revenue in Viral Vector Production (Research-use) Business (2020-2025) & (US$ Million)
Table 73. Thermo Fisher Scientific Recent Development
Table 74. Waisman Biomanufacturing Company Details
Table 75. Waisman Biomanufacturing Business Overview
Table 76. Waisman Biomanufacturing Viral Vector Production (Research-use) Product
Table 77. Waisman Biomanufacturing Revenue in Viral Vector Production (Research-use) Business (2020-2025) & (US$ Million)
Table 78. Waisman Biomanufacturing Recent Development
Table 79. Genezen Company Details
Table 80. Genezen Business Overview
Table 81. Genezen Viral Vector Production (Research-use) Product
Table 82. Genezen Revenue in Viral Vector Production (Research-use) Business (2020-2025) & (US$ Million)
Table 83. Genezen Recent Development
Table 84. YPOSKESI Company Details
Table 85. YPOSKESI Business Overview
Table 86. YPOSKESI Viral Vector Production (Research-use) Product
Table 87. YPOSKESI Revenue in Viral Vector Production (Research-use) Business (2020-2025) & (US$ Million)
Table 88. YPOSKESI Recent Development
Table 89. Advanced BioScience Laboratories, Inc. (ABL, Inc.) Company Details
Table 90. Advanced BioScience Laboratories, Inc. (ABL, Inc.) Business Overview
Table 91. Advanced BioScience Laboratories, Inc. (ABL, Inc.) Viral Vector Production (Research-use) Product
Table 92. Advanced BioScience Laboratories, Inc. (ABL, Inc.) Revenue in Viral Vector Production (Research-use) Business (2020-2025) & (US$ Million)
Table 93. Advanced BioScience Laboratories, Inc. (ABL, Inc.) Recent Development
Table 94. Novasep Holding S.A.S Company Details
Table 95. Novasep Holding S.A.S Business Overview
Table 96. Novasep Holding S.A.S Viral Vector Production (Research-use) Product
Table 97. Novasep Holding S.A.S Revenue in Viral Vector Production (Research-use) Business (2020-2025) & (US$ Million)
Table 98. Novasep Holding S.A.S Recent Development
Table 99. Orgenesis Biotech Israel Ltd (formerly ATVIO Biotech ltd.) Company Details
Table 100. Orgenesis Biotech Israel Ltd (formerly ATVIO Biotech ltd.) Business Overview
Table 101. Orgenesis Biotech Israel Ltd (formerly ATVIO Biotech ltd.) Viral Vector Production (Research-use) Product
Table 102. Orgenesis Biotech Israel Ltd (formerly ATVIO Biotech ltd.) Revenue in Viral Vector Production (Research-use) Business (2020-2025) & (US$ Million)
Table 103. Orgenesis Biotech Israel Ltd (formerly ATVIO Biotech ltd.) Recent Development
Table 104. Vigene Biosciences, Inc. Company Details
Table 105. Vigene Biosciences, Inc. Business Overview
Table 106. Vigene Biosciences, Inc. Viral Vector Production (Research-use) Product
Table 107. Vigene Biosciences, Inc. Revenue in Viral Vector Production (Research-use) Business (2020-2025) & (US$ Million)
Table 108. Vigene Biosciences, Inc. Recent Development
Table 109. General Electric Company (GE Healthcare) Company Details
Table 110. General Electric Company (GE Healthcare) Business Overview
Table 111. General Electric Company (GE Healthcare) Viral Vector Production (Research-use) Product
Table 112. General Electric Company (GE Healthcare) Revenue in Viral Vector Production (Research-use) Business (2020-2025) & (US$ Million)
Table 113. General Electric Company (GE Healthcare) Recent Development
Table 114. CEVEC Pharmaceuticals GmbH Company Details
Table 115. CEVEC Pharmaceuticals GmbH Business Overview
Table 116. CEVEC Pharmaceuticals GmbH Viral Vector Production (Research-use) Product
Table 117. CEVEC Pharmaceuticals GmbH Revenue in Viral Vector Production (Research-use) Business (2020-2025) & (US$ Million)
Table 118. CEVEC Pharmaceuticals GmbH Recent Development
Table 119. Batavia Biosciences B.V. Company Details
Table 120. Batavia Biosciences B.V. Business Overview
Table 121. Batavia Biosciences B.V. Viral Vector Production (Research-use) Product
Table 122. Batavia Biosciences B.V. Revenue in Viral Vector Production (Research-use) Business (2020-2025) & (US$ Million)
Table 123. Batavia Biosciences B.V. Recent Development
Table 124. Biovion oy Company Details
Table 125. Biovion oy Business Overview
Table 126. Biovion oy Viral Vector Production (Research-use) Product
Table 127. Biovion oy Revenue in Viral Vector Production (Research-use) Business (2020-2025) & (US$ Million)
Table 128. Biovion oy Recent Development
Table 129. Wuxi AppTec Co., Ltd. Company Details
Table 130. Wuxi AppTec Co., Ltd. Business Overview
Table 131. Wuxi AppTec Co., Ltd. Viral Vector Production (Research-use) Product
Table 132. Wuxi AppTec Co., Ltd. Revenue in Viral Vector Production (Research-use) Business (2020-2025) & (US$ Million)
Table 133. Wuxi AppTec Co., Ltd. Recent Development
Table 134. VGXI, Inc. Company Details
Table 135. VGXI, Inc. Business Overview
Table 136. VGXI, Inc. Viral Vector Production (Research-use) Product
Table 137. VGXI, Inc. Revenue in Viral Vector Production (Research-use) Business (2020-2025) & (US$ Million)
Table 138. VGXI, Inc. Recent Development
Table 139. Catalent Inc. Company Details
Table 140. Catalent Inc. Business Overview
Table 141. Catalent Inc. Viral Vector Production (Research-use) Product
Table 142. Catalent Inc. Revenue in Viral Vector Production (Research-use) Business (2020-2025) & (US$ Million)
Table 143. Catalent Inc. Recent Development
Table 144. Miltenyi Biotec GmbH Company Details
Table 145. Miltenyi Biotec GmbH Business Overview
Table 146. Miltenyi Biotec GmbH Viral Vector Production (Research-use) Product
Table 147. Miltenyi Biotec GmbH Revenue in Viral Vector Production (Research-use) Business (2020-2025) & (US$ Million)
Table 148. Miltenyi Biotec GmbH Recent Development
Table 149. SIRION Biotech GmbH Company Details
Table 150. SIRION Biotech GmbH Business Overview
Table 151. SIRION Biotech GmbH Viral Vector Production (Research-use) Product
Table 152. SIRION Biotech GmbH Revenue in Viral Vector Production (Research-use) Business (2020-2025) & (US$ Million)
Table 153. SIRION Biotech GmbH Recent Development
Table 154. Virovek Incorporation Company Details
Table 155. Virovek Incorporation Business Overview
Table 156. Virovek Incorporation Viral Vector Production (Research-use) Product
Table 157. Virovek Incorporation Revenue in Viral Vector Production (Research-use) Business (2020-2025) & (US$ Million)
Table 158. Virovek Incorporation Recent Development
Table 159. BioNTech IMFS GmbH Company Details
Table 160. BioNTech IMFS GmbH Business Overview
Table 161. BioNTech IMFS GmbH Viral Vector Production (Research-use) Product
Table 162. BioNTech IMFS GmbH Revenue in Viral Vector Production (Research-use) Business (2020-2025) & (US$ Million)
Table 163. BioNTech IMFS GmbH Recent Development
Table 164. VIVEbiotech S.L. Company Details
Table 165. VIVEbiotech S.L. Business Overview
Table 166. VIVEbiotech S.L. Viral Vector Production (Research-use) Product
Table 167. VIVEbiotech S.L. Revenue in Viral Vector Production (Research-use) Business (2020-2025) & (US$ Million)
Table 168. VIVEbiotech S.L. Recent Development
Table 169. Creative Biogene Company Details
Table 170. Creative Biogene Business Overview
Table 171. Creative Biogene Viral Vector Production (Research-use) Product
Table 172. Creative Biogene Revenue in Viral Vector Production (Research-use) Business (2020-2025) & (US$ Million)
Table 173. Creative Biogene Recent Development
Table 174. Vibalogics GmbH Company Details
Table 175. Vibalogics GmbH Business Overview
Table 176. Vibalogics GmbH Viral Vector Production (Research-use) Product
Table 177. Vibalogics GmbH Revenue in Viral Vector Production (Research-use) Business (2020-2025) & (US$ Million)
Table 178. Vibalogics GmbH Recent Development
Table 179. Takara Bio. Company Details
Table 180. Takara Bio. Business Overview
Table 181. Takara Bio. Viral Vector Production (Research-use) Product
Table 182. Takara Bio. Revenue in Viral Vector Production (Research-use) Business (2020-2025) & (US$ Million)
Table 183. Takara Bio. Recent Development
Table 184. Cell and Gene Therapy Catapult Company Details
Table 185. Cell and Gene Therapy Catapult Business Overview
Table 186. Cell and Gene Therapy Catapult Viral Vector Production (Research-use) Product
Table 187. Cell and Gene Therapy Catapult Revenue in Viral Vector Production (Research-use) Business (2020-2025) & (US$ Million)
Table 188. Cell and Gene Therapy Catapult Recent Development
Table 189. BlueBird Bio Company Details
Table 190. BlueBird Bio Business Overview
Table 191. BlueBird Bio Viral Vector Production (Research-use) Product
Table 192. BlueBird Bio Revenue in Viral Vector Production (Research-use) Business (2020-2025) & (US$ Million)
Table 193. BlueBird Bio Recent Development
Table 194. Addgene, Inc. Company Details
Table 195. Addgene, Inc. Business Overview
Table 196. Addgene, Inc. Viral Vector Production (Research-use) Product
Table 197. Addgene, Inc. Revenue in Viral Vector Production (Research-use) Business (2020-2025) & (US$ Million)
Table 198. Addgene, Inc. Recent Development
Table 199. Aldevron, L.L.C. Company Details
Table 200. Aldevron, L.L.C. Business Overview
Table 201. Aldevron, L.L.C. Viral Vector Production (Research-use) Product
Table 202. Aldevron, L.L.C. Revenue in Viral Vector Production (Research-use) Business (2020-2025) & (US$ Million)
Table 203. Aldevron, L.L.C. Recent Development
Table 204. Audentes Therapeutics Company Details
Table 205. Audentes Therapeutics Business Overview
Table 206. Audentes Therapeutics Viral Vector Production (Research-use) Product
Table 207. Audentes Therapeutics Revenue in Viral Vector Production (Research-use) Business (2020-2025) & (US$ Million)
Table 208. Audentes Therapeutics Recent Development
Table 209. BioMarin Pharmaceutical Company Details
Table 210. BioMarin Pharmaceutical Business Overview
Table 211. BioMarin Pharmaceutical Viral Vector Production (Research-use) Product
Table 212. BioMarin Pharmaceutical Revenue in Viral Vector Production (Research-use) Business (2020-2025) & (US$ Million)
Table 213. BioMarin Pharmaceutical Recent Development
Table 214. RegenxBio, Inc. Company Details
Table 215. RegenxBio, Inc. Business Overview
Table 216. RegenxBio, Inc. Viral Vector Production (Research-use) Product
Table 217. RegenxBio, Inc. Revenue in Viral Vector Production (Research-use) Business (2020-2025) & (US$ Million)
Table 218. RegenxBio, Inc. Recent Development
Table 219. Research Programs/Design for This Report
Table 220. Key Data Information from Secondary Sources
Table 221. Key Data Information from Primary Sources
Table 222. Authors List of This Report
List of Figures
Figure 1. Viral Vector Production (Research-use) Picture
Figure 2. Global Viral Vector Production (Research-use) Market Size Comparison by Type (2020-2031) & (US$ Million)
Figure 3. Global Viral Vector Production (Research-use) Market Share by Type: 2024 VS 2031
Figure 4. Adeno-associated virus (AAV) Features
Figure 5. Lentivirus Features
Figure 6. Adenovirus Features
Figure 7. Retrovirus Features
Figure 8. Others Features
Figure 9. Global Viral Vector Production (Research-use) Market Size by Application (2020-2031) & (US$ Million)
Figure 10. Global Viral Vector Production (Research-use) Market Share by Application: 2024 VS 2031
Figure 11. Cell & Gene Therapy Development Case Studies
Figure 12. Vaccine Development Case Studies
Figure 13. Biopharmaceutical and Pharmaceutical Discovery Case Studies
Figure 14. Biomedical Research Case Studies
Figure 15. Viral Vector Production (Research-use) Report Years Considered
Figure 16. Global Viral Vector Production (Research-use) Market Size (US$ Million), Year-over-Year: 2020-2031
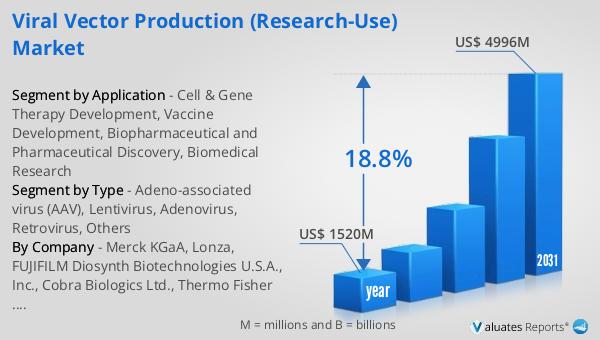
Figure 17. Global Viral Vector Production (Research-use) Market Size, (US$ Million), 2020 VS 2024 VS 2031
Figure 18. Global Viral Vector Production (Research-use) Market Share by Region: 2024 VS 2031
Figure 19. Global Viral Vector Production (Research-use) Market Share by Players in 2024
Figure 20. Global Top Viral Vector Production (Research-use) Players by Company Type (Tier 1, Tier 2, and Tier 3) & (based on the Revenue in Viral Vector Production (Research-use) as of 2024)
Figure 21. The Top 10 and 5 Players Market Share by Viral Vector Production (Research-use) Revenue in 2024
Figure 22. North America Viral Vector Production (Research-use) Market Size YoY Growth (2020-2031) & (US$ Million)
Figure 23. North America Viral Vector Production (Research-use) Market Share by Country (2020-2031)
Figure 24. United States Viral Vector Production (Research-use) Market Size YoY Growth (2020-2031) & (US$ Million)
Figure 25. Canada Viral Vector Production (Research-use) Market Size YoY Growth (2020-2031) & (US$ Million)
Figure 26. Europe Viral Vector Production (Research-use) Market Size YoY Growth (2020-2031) & (US$ Million)
Figure 27. Europe Viral Vector Production (Research-use) Market Share by Country (2020-2031)
Figure 28. Germany Viral Vector Production (Research-use) Market Size YoY Growth (2020-2031) & (US$ Million)
Figure 29. France Viral Vector Production (Research-use) Market Size YoY Growth (2020-2031) & (US$ Million)
Figure 30. U.K. Viral Vector Production (Research-use) Market Size YoY Growth (2020-2031) & (US$ Million)
Figure 31. Italy Viral Vector Production (Research-use) Market Size YoY Growth (2020-2031) & (US$ Million)
Figure 32. Russia Viral Vector Production (Research-use) Market Size YoY Growth (2020-2031) & (US$ Million)
Figure 33. Nordic Countries Viral Vector Production (Research-use) Market Size YoY Growth (2020-2031) & (US$ Million)
Figure 34. Asia-Pacific Viral Vector Production (Research-use) Market Size YoY Growth (2020-2031) & (US$ Million)
Figure 35. Asia-Pacific Viral Vector Production (Research-use) Market Share by Region (2020-2031)
Figure 36. China Viral Vector Production (Research-use) Market Size YoY Growth (2020-2031) & (US$ Million)
Figure 37. Japan Viral Vector Production (Research-use) Market Size YoY Growth (2020-2031) & (US$ Million)
Figure 38. South Korea Viral Vector Production (Research-use) Market Size YoY Growth (2020-2031) & (US$ Million)
Figure 39. Southeast Asia Viral Vector Production (Research-use) Market Size YoY Growth (2020-2031) & (US$ Million)
Figure 40. India Viral Vector Production (Research-use) Market Size YoY Growth (2020-2031) & (US$ Million)
Figure 41. Australia Viral Vector Production (Research-use) Market Size YoY Growth (2020-2031) & (US$ Million)
Figure 42. Latin America Viral Vector Production (Research-use) Market Size YoY Growth (2020-2031) & (US$ Million)
Figure 43. Latin America Viral Vector Production (Research-use) Market Share by Country (2020-2031)
Figure 44. Mexico Viral Vector Production (Research-use) Market Size YoY Growth (2020-2031) & (US$ Million)
Figure 45. Brazil Viral Vector Production (Research-use) Market Size YoY Growth (2020-2031) & (US$ Million)
Figure 46. Middle East & Africa Viral Vector Production (Research-use) Market Size YoY Growth (2020-2031) & (US$ Million)
Figure 47. Middle East & Africa Viral Vector Production (Research-use) Market Share by Country (2020-2031)
Figure 48. Turkey Viral Vector Production (Research-use) Market Size YoY Growth (2020-2031) & (US$ Million)
Figure 49. Saudi Arabia Viral Vector Production (Research-use) Market Size YoY Growth (2020-2031) & (US$ Million)
Figure 50. UAE Viral Vector Production (Research-use) Market Size YoY Growth (2020-2031) & (US$ Million)
Figure 51. Merck KGaA Revenue Growth Rate in Viral Vector Production (Research-use) Business (2020-2025)
Figure 52. Lonza Revenue Growth Rate in Viral Vector Production (Research-use) Business (2020-2025)
Figure 53. FUJIFILM Diosynth Biotechnologies U.S.A., Inc. Revenue Growth Rate in Viral Vector Production (Research-use) Business (2020-2025)
Figure 54. Cobra Biologics Ltd. Revenue Growth Rate in Viral Vector Production (Research-use) Business (2020-2025)
Figure 55. Thermo Fisher Scientific Revenue Growth Rate in Viral Vector Production (Research-use) Business (2020-2025)
Figure 56. Waisman Biomanufacturing Revenue Growth Rate in Viral Vector Production (Research-use) Business (2020-2025)
Figure 57. Genezen Revenue Growth Rate in Viral Vector Production (Research-use) Business (2020-2025)
Figure 58. YPOSKESI Revenue Growth Rate in Viral Vector Production (Research-use) Business (2020-2025)
Figure 59. Advanced BioScience Laboratories, Inc. (ABL, Inc.) Revenue Growth Rate in Viral Vector Production (Research-use) Business (2020-2025)
Figure 60. Novasep Holding S.A.S Revenue Growth Rate in Viral Vector Production (Research-use) Business (2020-2025)
Figure 61. Orgenesis Biotech Israel Ltd (formerly ATVIO Biotech ltd.) Revenue Growth Rate in Viral Vector Production (Research-use) Business (2020-2025)
Figure 62. Vigene Biosciences, Inc. Revenue Growth Rate in Viral Vector Production (Research-use) Business (2020-2025)
Figure 63. General Electric Company (GE Healthcare) Revenue Growth Rate in Viral Vector Production (Research-use) Business (2020-2025)
Figure 64. CEVEC Pharmaceuticals GmbH Revenue Growth Rate in Viral Vector Production (Research-use) Business (2020-2025)
Figure 65. Batavia Biosciences B.V. Revenue Growth Rate in Viral Vector Production (Research-use) Business (2020-2025)
Figure 66. Biovion oy Revenue Growth Rate in Viral Vector Production (Research-use) Business (2020-2025)
Figure 67. Wuxi AppTec Co., Ltd. Revenue Growth Rate in Viral Vector Production (Research-use) Business (2020-2025)
Figure 68. VGXI, Inc. Revenue Growth Rate in Viral Vector Production (Research-use) Business (2020-2025)
Figure 69. Catalent Inc. Revenue Growth Rate in Viral Vector Production (Research-use) Business (2020-2025)
Figure 70. Miltenyi Biotec GmbH Revenue Growth Rate in Viral Vector Production (Research-use) Business (2020-2025)
Figure 71. SIRION Biotech GmbH Revenue Growth Rate in Viral Vector Production (Research-use) Business (2020-2025)
Figure 72. Virovek Incorporation Revenue Growth Rate in Viral Vector Production (Research-use) Business (2020-2025)
Figure 73. BioNTech IMFS GmbH Revenue Growth Rate in Viral Vector Production (Research-use) Business (2020-2025)
Figure 74. VIVEbiotech S.L. Revenue Growth Rate in Viral Vector Production (Research-use) Business (2020-2025)
Figure 75. Creative Biogene Revenue Growth Rate in Viral Vector Production (Research-use) Business (2020-2025)
Figure 76. Vibalogics GmbH Revenue Growth Rate in Viral Vector Production (Research-use) Business (2020-2025)
Figure 77. Takara Bio. Revenue Growth Rate in Viral Vector Production (Research-use) Business (2020-2025)
Figure 78. Cell and Gene Therapy Catapult Revenue Growth Rate in Viral Vector Production (Research-use) Business (2020-2025)
Figure 79. BlueBird Bio Revenue Growth Rate in Viral Vector Production (Research-use) Business (2020-2025)
Figure 80. Addgene, Inc. Revenue Growth Rate in Viral Vector Production (Research-use) Business (2020-2025)
Figure 81. Aldevron, L.L.C. Revenue Growth Rate in Viral Vector Production (Research-use) Business (2020-2025)
Figure 82. Audentes Therapeutics Revenue Growth Rate in Viral Vector Production (Research-use) Business (2020-2025)
Figure 83. BioMarin Pharmaceutical Revenue Growth Rate in Viral Vector Production (Research-use) Business (2020-2025)
Figure 84. RegenxBio, Inc. Revenue Growth Rate in Viral Vector Production (Research-use) Business (2020-2025)
Figure 85. Bottom-up and Top-down Approaches for This Report
Figure 86. Data Triangulation
Figure 87. Key Executives Interviewed