List of Tables
Table 1. Global Security Operation Center as a Service Market Size Growth Rate by Type (US$ Million): 2021 vs 2025 vs 2032
Table 2. Key Players of Cloud-Based
Table 3. Key Players of Hybrid
Table 4. Global Security Operation Center as a Service Market Size Growth Rate by Platform Stack (US$ Million): 2021 vs 2025 vs 2032
Table 5. Key Players of SIEM-centric SOCaaS
Table 6. Key Players of XDR/MDR-centric
Table 7. Key Players of SIEM+SOAR Integrated
Table 8. Key Players of Big-data Situational Awareness Platform
Table 9. Global Security Operation Center as a Service Market Size Growth Rate by Pricing Metric (US$ Million): 2021 vs 2025 vs 2032
Table 10. Key Players of Per Endpoint
Table 11. Key Players of Per GB Ingested
Table 12. Key Players of Per Asset
Table 13. Key Players of Per Alert
Table 14. Key Players of Others
Table 15. Global Security Operation Center as a Service Market Size Growth Rate by Operating Model (US$ Million): 2021 vs 2025 vs 2032
Table 16. Key Players of Multi-tenant SOC
Table 17. Key Players of Dedicated SOC
Table 18. Key Players of Regional SOC Hubs
Table 19. Key Players of Others
Table 20. Global Security Operation Center as a Service Market Size Growth by Application (US$ Million): 2021 vs 2025 vs 2032
Table 21. Global Security Operation Center as a Service Market Size by Region (US$ Million): 2021 vs 2025 vs 2032
Table 22. Global Security Operation Center as a Service Market Size by Region (US$ Million), 2021–2026
Table 23. Global Security Operation Center as a Service Market Share by Region (2021–2026)
Table 24. Global Security Operation Center as a Service Forecasted Market Size by Region (US$ Million), 2027–2032
Table 25. Global Security Operation Center as a Service Market Share by Region (2027–2032)
Table 26. Security Operation Center as a Service Market Trends
Table 27. Security Operation Center as a Service Market Drivers
Table 28. Security Operation Center as a Service Market Challenges
Table 29. Security Operation Center as a Service Market Restraints
Table 30. Global Security Operation Center as a Service Revenue by Players (US$ Million), 2021–2026
Table 31. Global Security Operation Center as a Service Market Share by Players (2021–2026)
Table 32. Global Top Security Operation Center as a Service Players by Tier (Tier 1, Tier 2, and Tier 3), based on Security Operation Center as a Service Revenue, 2025
Table 33. Ranking of Global Top Security Operation Center as a Service Companies by Revenue (US$ Million) in 2025
Table 34. Global 5 Largest Players Market Share by Security Operation Center as a Service Revenue (CR5 and HHI), 2021–2026
Table 35. Global Key Players of Security Operation Center as a Service, Headquarters and Area Served
Table 36. Global Key Players of Security Operation Center as a Service, Products and Applications
Table 37. Global Key Players of Security Operation Center as a Service, Date of General Availability (GA)
Table 38. Mergers and Acquisitions, Expansion Plans
Table 39. Global Security Operation Center as a Service Market Size by Type (US$ Million), 2021–2026
Table 40. Global Security Operation Center as a Service Revenue Market Share by Type (2021–2026)
Table 41. Global Security Operation Center as a Service Forecasted Market Size by Type (US$ Million), 2027–2032
Table 42. Global Security Operation Center as a Service Revenue Market Share by Type (2027–2032)
Table 43. Global Security Operation Center as a Service Market Size by Application (US$ Million), 2021–2026
Table 44. Global Security Operation Center as a Service Revenue Market Share by Application (2021–2026)
Table 45. Global Security Operation Center as a Service Forecasted Market Size by Application (US$ Million), 2027–2032
Table 46. Global Security Operation Center as a Service Revenue Market Share by Application (2027–2032)
Table 47. North America Security Operation Center as a Service Market Size Growth Rate by Country (US$ Million): 2021 vs 2025 vs 2032
Table 48. North America Security Operation Center as a Service Market Size by Country (US$ Million), 2021–2026
Table 49. North America Security Operation Center as a Service Market Size by Country (US$ Million), 2027–2032
Table 50. Europe Security Operation Center as a Service Market Size Growth Rate by Country (US$ Million): 2021 vs 2025 vs 2032
Table 51. Europe Security Operation Center as a Service Market Size by Country (US$ Million), 2021–2026
Table 52. Europe Security Operation Center as a Service Market Size by Country (US$ Million), 2027–2032
Table 53. Asia-Pacific Security Operation Center as a Service Market Size Growth Rate by Region (US$ Million): 2021 vs 2025 vs 2032
Table 54. Asia-Pacific Security Operation Center as a Service Market Size by Region (US$ Million), 2021–2026
Table 55. Asia-Pacific Security Operation Center as a Service Market Size by Region (US$ Million), 2027–2032
Table 56. Latin America Security Operation Center as a Service Market Size Growth Rate by Country (US$ Million): 2021 vs 2025 vs 2032
Table 57. Latin America Security Operation Center as a Service Market Size by Country (US$ Million), 2021–2026
Table 58. Latin America Security Operation Center as a Service Market Size by Country (US$ Million), 2027–2032
Table 59. Middle East & Africa Security Operation Center as a Service Market Size Growth Rate by Country (US$ Million): 2021 vs 2025 vs 2032
Table 60. Middle East & Africa Security Operation Center as a Service Market Size by Country (US$ Million), 2021–2026
Table 61. Middle East & Africa Security Operation Center as a Service Market Size by Country (US$ Million), 2027–2032
Table 62. Broadcom Company Details
Table 63. Broadcom Business Overview
Table 64. Broadcom Security Operation Center as a Service Product
Table 65. Broadcom Revenue in Security Operation Center as a Service Business (US$ Million), 2021–2026
Table 66. Broadcom Recent Development
Table 67. Fortinet Company Details
Table 68. Fortinet Business Overview
Table 69. Fortinet Security Operation Center as a Service Product
Table 70. Fortinet Revenue in Security Operation Center as a Service Business (US$ Million), 2021–2026
Table 71. Fortinet Recent Development
Table 72. Arctic Wolf Company Details
Table 73. Arctic Wolf Business Overview
Table 74. Arctic Wolf Security Operation Center as a Service Product
Table 75. Arctic Wolf Revenue in Security Operation Center as a Service Business (US$ Million), 2021–2026
Table 76. Arctic Wolf Recent Development
Table 77. CrowdStrike Company Details
Table 78. CrowdStrike Business Overview
Table 79. CrowdStrike Security Operation Center as a Service Product
Table 80. CrowdStrike Revenue in Security Operation Center as a Service Business (US$ Million), 2021–2026
Table 81. CrowdStrike Recent Development
Table 82. Rapid7 Company Details
Table 83. Rapid7 Business Overview
Table 84. Rapid7 Security Operation Center as a Service Product
Table 85. Rapid7 Revenue in Security Operation Center as a Service Business (US$ Million), 2021–2026
Table 86. Rapid7 Recent Development
Table 87. Sophos Company Details
Table 88. Sophos Business Overview
Table 89. Sophos Security Operation Center as a Service Product
Table 90. Sophos Revenue in Security Operation Center as a Service Business (US$ Million), 2021–2026
Table 91. Sophos Recent Development
Table 92. IBM Company Details
Table 93. IBM Business Overview
Table 94. IBM Security Operation Center as a Service Product
Table 95. IBM Revenue in Security Operation Center as a Service Business (US$ Million), 2021–2026
Table 96. IBM Recent Development
Table 97. Deepwatch Company Details
Table 98. Deepwatch Business Overview
Table 99. Deepwatch Security Operation Center as a Service Product
Table 100. Deepwatch Revenue in Security Operation Center as a Service Business (US$ Million), 2021–2026
Table 101. Deepwatch Recent Development
Table 102. Fortra Company Details
Table 103. Fortra Business Overview
Table 104. Fortra Security Operation Center as a Service Product
Table 105. Fortra Revenue in Security Operation Center as a Service Business (US$ Million), 2021–2026
Table 106. Fortra Recent Development
Table 107. Netsurion Company Details
Table 108. Netsurion Business Overview
Table 109. Netsurion Security Operation Center as a Service Product
Table 110. Netsurion Revenue in Security Operation Center as a Service Business (US$ Million), 2021–2026
Table 111. Netsurion Recent Development
Table 112. Proficio Company Details
Table 113. Proficio Business Overview
Table 114. Proficio Security Operation Center as a Service Product
Table 115. Proficio Revenue in Security Operation Center as a Service Business (US$ Million), 2021–2026
Table 116. Proficio Recent Development
Table 117. CyberMaxx Company Details
Table 118. CyberMaxx Business Overview
Table 119. CyberMaxx Security Operation Center as a Service Product
Table 120. CyberMaxx Revenue in Security Operation Center as a Service Business (US$ Million), 2021–2026
Table 121. CyberMaxx Recent Development
Table 122. Palo Alto Networks Company Details
Table 123. Palo Alto Networks Business Overview
Table 124. Palo Alto Networks Security Operation Center as a Service Product
Table 125. Palo Alto Networks Revenue in Security Operation Center as a Service Business (US$ Million), 2021–2026
Table 126. Palo Alto Networks Recent Development
Table 127. Microsoft Company Details
Table 128. Microsoft Business Overview
Table 129. Microsoft Security Operation Center as a Service Product
Table 130. Microsoft Revenue in Security Operation Center as a Service Business (US$ Million), 2021–2026
Table 131. Microsoft Recent Development
Table 132. Sprinto Company Details
Table 133. Sprinto Business Overview
Table 134. Sprinto Security Operation Center as a Service Product
Table 135. Sprinto Revenue in Security Operation Center as a Service Business (US$ Million), 2021–2026
Table 136. Sprinto Recent Development
Table 137. Symantec Company Details
Table 138. Symantec Business Overview
Table 139. Symantec Security Operation Center as a Service Product
Table 140. Symantec Revenue in Security Operation Center as a Service Business (US$ Million), 2021–2026
Table 141. Symantec Recent Development
Table 142. Alert Logic Company Details
Table 143. Alert Logic Business Overview
Table 144. Alert Logic Security Operation Center as a Service Product
Table 145. Alert Logic Revenue in Security Operation Center as a Service Business (US$ Million), 2021–2026
Table 146. Alert Logic Recent Development
Table 147. Qualys Company Details
Table 148. Qualys Business Overview
Table 149. Qualys Security Operation Center as a Service Product
Table 150. Qualys Revenue in Security Operation Center as a Service Business (US$ Million), 2021–2026
Table 151. Qualys Recent Development
Table 152. AT&T Company Details
Table 153. AT&T Business Overview
Table 154. AT&T Security Operation Center as a Service Product
Table 155. AT&T Revenue in Security Operation Center as a Service Business (US$ Million), 2021–2026
Table 156. AT&T Recent Development
Table 157. BlackStratus Company Details
Table 158. BlackStratus Business Overview
Table 159. BlackStratus Security Operation Center as a Service Product
Table 160. BlackStratus Revenue in Security Operation Center as a Service Business (US$ Million), 2021–2026
Table 161. BlackStratus Recent Development
Table 162. ESDS Company Details
Table 163. ESDS Business Overview
Table 164. ESDS Security Operation Center as a Service Product
Table 165. ESDS Revenue in Security Operation Center as a Service Business (US$ Million), 2021–2026
Table 166. ESDS Recent Development
Table 167. Suma Soft Company Details
Table 168. Suma Soft Business Overview
Table 169. Suma Soft Security Operation Center as a Service Product
Table 170. Suma Soft Revenue in Security Operation Center as a Service Business (US$ Million), 2021–2026
Table 171. Suma Soft Recent Development
Table 172. CyberCX Company Details
Table 173. CyberCX Business Overview
Table 174. CyberCX Security Operation Center as a Service Product
Table 175. CyberCX Revenue in Security Operation Center as a Service Business (US$ Million), 2021–2026
Table 176. CyberCX Recent Development
Table 177. eSentire Company Details
Table 178. eSentire Business Overview
Table 179. eSentire Security Operation Center as a Service Product
Table 180. eSentire Revenue in Security Operation Center as a Service Business (US$ Million), 2021–2026
Table 181. eSentire Recent Development
Table 182. HABOOB Company Details
Table 183. HABOOB Business Overview
Table 184. HABOOB Security Operation Center as a Service Product
Table 185. HABOOB Revenue in Security Operation Center as a Service Business (US$ Million), 2021–2026
Table 186. HABOOB Recent Development
Table 187. Research Programs/Design for This Report
Table 188. Key Data Information from Secondary Sources
Table 189. Key Data Information from Primary Sources
Table 190. Authors List of This Report
List of Figures
Figure 1. Security Operation Center as a Service Picture
Figure 2. Global Security Operation Center as a Service Market Size Comparison by Type (US$ Million), 2021–2032
Figure 3. Global Security Operation Center as a Service Market Share by Type: 2025 vs 2032
Figure 4. Cloud-Based Features
Figure 5. Hybrid Features
Figure 6. Global Security Operation Center as a Service Market Size Comparison by Platform Stack (US$ Million), 2021–2032
Figure 7. SIEM-centric SOCaaS Features
Figure 8. XDR/MDR-centric Features
Figure 9. SIEM+SOAR Integrated Features
Figure 10. Big-data Situational Awareness Platform Features
Figure 11. Global Security Operation Center as a Service Market Size Comparison by Pricing Metric (US$ Million), 2021–2032
Figure 12. Per Endpoint Features
Figure 13. Per GB Ingested Features
Figure 14. Per Asset Features
Figure 15. Per Alert Features
Figure 16. Others Features
Figure 17. Global Security Operation Center as a Service Market Size Comparison by Operating Model (US$ Million), 2021–2032
Figure 18. Multi-tenant SOC Features
Figure 19. Dedicated SOC Features
Figure 20. Regional SOC Hubs Features
Figure 21. Others Features
Figure 22. Global Security Operation Center as a Service Market Size by Application (US$ Million), 2021–2032
Figure 23. Global Security Operation Center as a Service Market Share by Application: 2025 vs 2032
Figure 24. Financial Services Case Studies
Figure 25. Public Sector Case Studies
Figure 26. Manufacturing & Industrial Case Studies
Figure 27. Healthcare Case Studies
Figure 28. Energy & Critical Infrastructure Case Studies
Figure 29. Others Case Studies
Figure 30. Security Operation Center as a Service Report Years Considered
Figure 31. Global Security Operation Center as a Service Market Size (US$ Million), Year-over-Year: 2021–2032
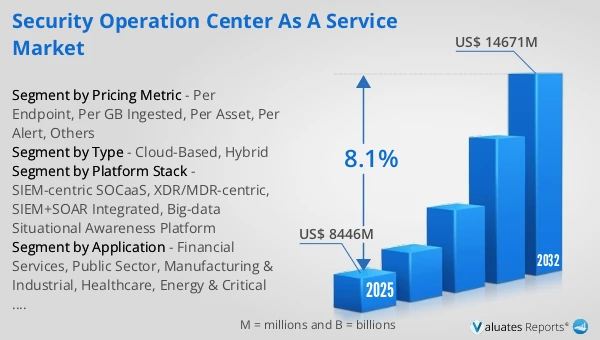
Figure 32. Global Security Operation Center as a Service Market Size, (US$ Million), 2021 vs 2025 vs 2032
Figure 33. Global Security Operation Center as a Service Market Share by Region: 2025 vs 2032
Figure 34. Global Security Operation Center as a Service Market Share by Players in 2025
Figure 35. Global Security Operation Center as a Service Market Share by Company Type (Tier 1, Tier 2, and Tier 3)
Figure 36. The Top 10 and 5 Players Market Share by Security Operation Center as a Service Revenue in 2025
Figure 37. North America Security Operation Center as a Service Market Size YoY Growth (US$ Million), 2021–2032
Figure 38. North America Security Operation Center as a Service Market Share by Country (2021–2032)
Figure 39. United States Security Operation Center as a Service Market Size YoY Growth (US$ Million), 2021–2032
Figure 40. Canada Security Operation Center as a Service Market Size YoY Growth (US$ Million), 2021–2032
Figure 41. Europe Security Operation Center as a Service Market Size YoY Growth (US$ Million), 2021–2032
Figure 42. Europe Security Operation Center as a Service Market Share by Country (2021–2032)
Figure 43. Germany Security Operation Center as a Service Market Size YoY Growth (US$ Million), 2021–2032
Figure 44. France Security Operation Center as a Service Market Size YoY Growth (US$ Million), 2021–2032
Figure 45. U.K. Security Operation Center as a Service Market Size YoY Growth (US$ Million), 2021–2032
Figure 46. Italy Security Operation Center as a Service Market Size YoY Growth (US$ Million), 2021–2032
Figure 47. Russia Security Operation Center as a Service Market Size YoY Growth (US$ Million), 2021–2032
Figure 48. Ireland Security Operation Center as a Service Market Size YoY Growth (US$ Million), 2021–2032
Figure 49. Asia-Pacific Security Operation Center as a Service Market Size YoY Growth (US$ Million), 2021–2032
Figure 50. Asia-Pacific Security Operation Center as a Service Market Share by Region (2021–2032)
Figure 51. China Security Operation Center as a Service Market Size YoY Growth (US$ Million), 2021–2032
Figure 52. Japan Security Operation Center as a Service Market Size YoY Growth (US$ Million), 2021–2032
Figure 53. South Korea Security Operation Center as a Service Market Size YoY Growth (US$ Million), 2021–2032
Figure 54. Southeast Asia Security Operation Center as a Service Market Size YoY Growth (US$ Million), 2021–2032
Figure 55. India Security Operation Center as a Service Market Size YoY Growth (US$ Million), 2021–2032
Figure 56. Australia & New Zealand Security Operation Center as a Service Market Size YoY Growth (US$ Million), 2021–2032
Figure 57. Latin America Security Operation Center as a Service Market Size YoY Growth (US$ Million), 2021–2032
Figure 58. Latin America Security Operation Center as a Service Market Share by Country (2021–2032)
Figure 59. Mexico Security Operation Center as a Service Market Size YoY Growth (US$ Million), 2021–2032
Figure 60. Brazil Security Operation Center as a Service Market Size YoY Growth (US$ Million), 2021–2032
Figure 61. Middle East & Africa Security Operation Center as a Service Market Size YoY Growth (US$ Million), 2021–2032
Figure 62. Middle East & Africa Security Operation Center as a Service Market Share by Country (2021–2032)
Figure 63. Israel Security Operation Center as a Service Market Size YoY Growth (US$ Million), 2021–2032
Figure 64. Saudi Arabia Security Operation Center as a Service Market Size YoY Growth (US$ Million), 2021–2032
Figure 65. UAE Security Operation Center as a Service Market Size YoY Growth (US$ Million), 2021–2032
Figure 66. Broadcom Revenue Growth Rate in Security Operation Center as a Service Business (2021–2026)
Figure 67. Fortinet Revenue Growth Rate in Security Operation Center as a Service Business (2021–2026)
Figure 68. Arctic Wolf Revenue Growth Rate in Security Operation Center as a Service Business (2021–2026)
Figure 69. CrowdStrike Revenue Growth Rate in Security Operation Center as a Service Business (2021–2026)
Figure 70. Rapid7 Revenue Growth Rate in Security Operation Center as a Service Business (2021–2026)
Figure 71. Sophos Revenue Growth Rate in Security Operation Center as a Service Business (2021–2026)
Figure 72. IBM Revenue Growth Rate in Security Operation Center as a Service Business (2021–2026)
Figure 73. Deepwatch Revenue Growth Rate in Security Operation Center as a Service Business (2021–2026)
Figure 74. Fortra Revenue Growth Rate in Security Operation Center as a Service Business (2021–2026)
Figure 75. Netsurion Revenue Growth Rate in Security Operation Center as a Service Business (2021–2026)
Figure 76. Proficio Revenue Growth Rate in Security Operation Center as a Service Business (2021–2026)
Figure 77. CyberMaxx Revenue Growth Rate in Security Operation Center as a Service Business (2021–2026)
Figure 78. Palo Alto Networks Revenue Growth Rate in Security Operation Center as a Service Business (2021–2026)
Figure 79. Microsoft Revenue Growth Rate in Security Operation Center as a Service Business (2021–2026)
Figure 80. Sprinto Revenue Growth Rate in Security Operation Center as a Service Business (2021–2026)
Figure 81. Symantec Revenue Growth Rate in Security Operation Center as a Service Business (2021–2026)
Figure 82. Alert Logic Revenue Growth Rate in Security Operation Center as a Service Business (2021–2026)
Figure 83. Qualys Revenue Growth Rate in Security Operation Center as a Service Business (2021–2026)
Figure 84. AT&T Revenue Growth Rate in Security Operation Center as a Service Business (2021–2026)
Figure 85. BlackStratus Revenue Growth Rate in Security Operation Center as a Service Business (2021–2026)
Figure 86. ESDS Revenue Growth Rate in Security Operation Center as a Service Business (2021–2026)
Figure 87. Suma Soft Revenue Growth Rate in Security Operation Center as a Service Business (2021–2026)
Figure 88. CyberCX Revenue Growth Rate in Security Operation Center as a Service Business (2021–2026)
Figure 89. eSentire Revenue Growth Rate in Security Operation Center as a Service Business (2021–2026)
Figure 90. HABOOB Revenue Growth Rate in Security Operation Center as a Service Business (2021–2026)
Figure 91. Bottom-up and Top-down Approaches for This Report
Figure 92. Data Triangulation
Figure 93. Key Executives Interviewed