List of Tables
Table 1. Global Security Operations (SecOps) Software Market Size Growth Rate by Type (US$ Million): 2021 vs 2025 vs 2032
Table 2. Key Players of Cloud Based
Table 3. Key Players of On-premises
Table 4. Global Security Operations (SecOps) Software Market Size Growth Rate by Pricing Model (US$ Million): 2021 vs 2025 vs 2032
Table 5. Key Players of Data Volume
Table 6. Key Players of Endpoint Count
Table 7. Key Players of Feature Bundles
Table 8. Key Players of Data Retention Period
Table 9. Global Security Operations (SecOps) Software Market Size Growth Rate by Target Environment (US$ Million): 2021 vs 2025 vs 2032
Table 10. Key Players of Cloud-Centric
Table 11. Key Players of Network & Perimeter
Table 12. Key Players of Hybrid and Multi-Cloud
Table 13. Global Security Operations (SecOps) Software Market Size Growth Rate by Automation Level (US$ Million): 2021 vs 2025 vs 2032
Table 14. Key Players of Manual Operations
Table 15. Key Players of Augmented Analysis
Table 16. Key Players of Automated Response
Table 17. Key Players of Predictive & Autonomous
Table 18. Global Security Operations (SecOps) Software Market Size Growth by Application (US$ Million): 2021 vs 2025 vs 2032
Table 19. Global Security Operations (SecOps) Software Market Size by Region (US$ Million): 2021 vs 2025 vs 2032
Table 20. Global Security Operations (SecOps) Software Market Size by Region (US$ Million), 2021–2026
Table 21. Global Security Operations (SecOps) Software Market Share by Region (2021–2026)
Table 22. Global Security Operations (SecOps) Software Forecasted Market Size by Region (US$ Million), 2027–2032
Table 23. Global Security Operations (SecOps) Software Market Share by Region (2027–2032)
Table 24. Security Operations (SecOps) Software Market Trends
Table 25. Security Operations (SecOps) Software Market Drivers
Table 26. Security Operations (SecOps) Software Market Challenges
Table 27. Security Operations (SecOps) Software Market Restraints
Table 28. Global Security Operations (SecOps) Software Revenue by Players (US$ Million), 2021–2026
Table 29. Global Security Operations (SecOps) Software Market Share by Players (2021–2026)
Table 30. Global Top Security Operations (SecOps) Software Players by Tier (Tier 1, Tier 2, and Tier 3), based on Security Operations (SecOps) Software Revenue, 2025
Table 31. Ranking of Global Top Security Operations (SecOps) Software Companies by Revenue (US$ Million) in 2025
Table 32. Global 5 Largest Players Market Share by Security Operations (SecOps) Software Revenue (CR5 and HHI), 2021–2026
Table 33. Global Key Players of Security Operations (SecOps) Software, Headquarters and Area Served
Table 34. Global Key Players of Security Operations (SecOps) Software, Products and Applications
Table 35. Global Key Players of Security Operations (SecOps) Software, Date of General Availability (GA)
Table 36. Mergers and Acquisitions, Expansion Plans
Table 37. Global Security Operations (SecOps) Software Market Size by Type (US$ Million), 2021–2026
Table 38. Global Security Operations (SecOps) Software Revenue Market Share by Type (2021–2026)
Table 39. Global Security Operations (SecOps) Software Forecasted Market Size by Type (US$ Million), 2027–2032
Table 40. Global Security Operations (SecOps) Software Revenue Market Share by Type (2027–2032)
Table 41. Global Security Operations (SecOps) Software Market Size by Application (US$ Million), 2021–2026
Table 42. Global Security Operations (SecOps) Software Revenue Market Share by Application (2021–2026)
Table 43. Global Security Operations (SecOps) Software Forecasted Market Size by Application (US$ Million), 2027–2032
Table 44. Global Security Operations (SecOps) Software Revenue Market Share by Application (2027–2032)
Table 45. North America Security Operations (SecOps) Software Market Size Growth Rate by Country (US$ Million): 2021 vs 2025 vs 2032
Table 46. North America Security Operations (SecOps) Software Market Size by Country (US$ Million), 2021–2026
Table 47. North America Security Operations (SecOps) Software Market Size by Country (US$ Million), 2027–2032
Table 48. Europe Security Operations (SecOps) Software Market Size Growth Rate by Country (US$ Million): 2021 vs 2025 vs 2032
Table 49. Europe Security Operations (SecOps) Software Market Size by Country (US$ Million), 2021–2026
Table 50. Europe Security Operations (SecOps) Software Market Size by Country (US$ Million), 2027–2032
Table 51. Asia-Pacific Security Operations (SecOps) Software Market Size Growth Rate by Region (US$ Million): 2021 vs 2025 vs 2032
Table 52. Asia-Pacific Security Operations (SecOps) Software Market Size by Region (US$ Million), 2021–2026
Table 53. Asia-Pacific Security Operations (SecOps) Software Market Size by Region (US$ Million), 2027–2032
Table 54. Latin America Security Operations (SecOps) Software Market Size Growth Rate by Country (US$ Million): 2021 vs 2025 vs 2032
Table 55. Latin America Security Operations (SecOps) Software Market Size by Country (US$ Million), 2021–2026
Table 56. Latin America Security Operations (SecOps) Software Market Size by Country (US$ Million), 2027–2032
Table 57. Middle East & Africa Security Operations (SecOps) Software Market Size Growth Rate by Country (US$ Million): 2021 vs 2025 vs 2032
Table 58. Middle East & Africa Security Operations (SecOps) Software Market Size by Country (US$ Million), 2021–2026
Table 59. Middle East & Africa Security Operations (SecOps) Software Market Size by Country (US$ Million), 2027–2032
Table 60. Broadcom Company Details
Table 61. Broadcom Business Overview
Table 62. Broadcom Security Operations (SecOps) Software Product
Table 63. Broadcom Revenue in Security Operations (SecOps) Software Business (US$ Million), 2021–2026
Table 64. Broadcom Recent Development
Table 65. Cisco Company Details
Table 66. Cisco Business Overview
Table 67. Cisco Security Operations (SecOps) Software Product
Table 68. Cisco Revenue in Security Operations (SecOps) Software Business (US$ Million), 2021–2026
Table 69. Cisco Recent Development
Table 70. Trend Micro Company Details
Table 71. Trend Micro Business Overview
Table 72. Trend Micro Security Operations (SecOps) Software Product
Table 73. Trend Micro Revenue in Security Operations (SecOps) Software Business (US$ Million), 2021–2026
Table 74. Trend Micro Recent Development
Table 75. McAfee Company Details
Table 76. McAfee Business Overview
Table 77. McAfee Security Operations (SecOps) Software Product
Table 78. McAfee Revenue in Security Operations (SecOps) Software Business (US$ Million), 2021–2026
Table 79. McAfee Recent Development
Table 80. ESET Company Details
Table 81. ESET Business Overview
Table 82. ESET Security Operations (SecOps) Software Product
Table 83. ESET Revenue in Security Operations (SecOps) Software Business (US$ Million), 2021–2026
Table 84. ESET Recent Development
Table 85. OpenText Company Details
Table 86. OpenText Business Overview
Table 87. OpenText Security Operations (SecOps) Software Product
Table 88. OpenText Revenue in Security Operations (SecOps) Software Business (US$ Million), 2021–2026
Table 89. OpenText Recent Development
Table 90. Fortinet Company Details
Table 91. Fortinet Business Overview
Table 92. Fortinet Security Operations (SecOps) Software Product
Table 93. Fortinet Revenue in Security Operations (SecOps) Software Business (US$ Million), 2021–2026
Table 94. Fortinet Recent Development
Table 95. Exabeam Company Details
Table 96. Exabeam Business Overview
Table 97. Exabeam Security Operations (SecOps) Software Product
Table 98. Exabeam Revenue in Security Operations (SecOps) Software Business (US$ Million), 2021–2026
Table 99. Exabeam Recent Development
Table 100. Trellix Company Details
Table 101. Trellix Business Overview
Table 102. Trellix Security Operations (SecOps) Software Product
Table 103. Trellix Revenue in Security Operations (SecOps) Software Business (US$ Million), 2021–2026
Table 104. Trellix Recent Development
Table 105. Securonix Company Details
Table 106. Securonix Business Overview
Table 107. Securonix Security Operations (SecOps) Software Product
Table 108. Securonix Revenue in Security Operations (SecOps) Software Business (US$ Million), 2021–2026
Table 109. Securonix Recent Development
Table 110. Elastic Company Details
Table 111. Elastic Business Overview
Table 112. Elastic Security Operations (SecOps) Software Product
Table 113. Elastic Revenue in Security Operations (SecOps) Software Business (US$ Million), 2021–2026
Table 114. Elastic Recent Development
Table 115. Logpoint Company Details
Table 116. Logpoint Business Overview
Table 117. Logpoint Security Operations (SecOps) Software Product
Table 118. Logpoint Revenue in Security Operations (SecOps) Software Business (US$ Million), 2021–2026
Table 119. Logpoint Recent Development
Table 120. Rapid7 Company Details
Table 121. Rapid7 Business Overview
Table 122. Rapid7 Security Operations (SecOps) Software Product
Table 123. Rapid7 Revenue in Security Operations (SecOps) Software Business (US$ Million), 2021–2026
Table 124. Rapid7 Recent Development
Table 125. CrowdStrike Company Details
Table 126. CrowdStrike Business Overview
Table 127. CrowdStrike Security Operations (SecOps) Software Product
Table 128. CrowdStrike Revenue in Security Operations (SecOps) Software Business (US$ Million), 2021–2026
Table 129. CrowdStrike Recent Development
Table 130. SolarWinds Company Details
Table 131. SolarWinds Business Overview
Table 132. SolarWinds Security Operations (SecOps) Software Product
Table 133. SolarWinds Revenue in Security Operations (SecOps) Software Business (US$ Million), 2021–2026
Table 134. SolarWinds Recent Development
Table 135. ManageEngine Company Details
Table 136. ManageEngine Business Overview
Table 137. ManageEngine Security Operations (SecOps) Software Product
Table 138. ManageEngine Revenue in Security Operations (SecOps) Software Business (US$ Million), 2021–2026
Table 139. ManageEngine Recent Development
Table 140. Graylog Company Details
Table 141. Graylog Business Overview
Table 142. Graylog Security Operations (SecOps) Software Product
Table 143. Graylog Revenue in Security Operations (SecOps) Software Business (US$ Million), 2021–2026
Table 144. Graylog Recent Development
Table 145. Microsoft Company Details
Table 146. Microsoft Business Overview
Table 147. Microsoft Security Operations (SecOps) Software Product
Table 148. Microsoft Revenue in Security Operations (SecOps) Software Business (US$ Million), 2021–2026
Table 149. Microsoft Recent Development
Table 150. Sumo Logic Company Details
Table 151. Sumo Logic Business Overview
Table 152. Sumo Logic Security Operations (SecOps) Software Product
Table 153. Sumo Logic Revenue in Security Operations (SecOps) Software Business (US$ Million), 2021–2026
Table 154. Sumo Logic Recent Development
Table 155. BMC Software Company Details
Table 156. BMC Software Business Overview
Table 157. BMC Software Security Operations (SecOps) Software Product
Table 158. BMC Software Revenue in Security Operations (SecOps) Software Business (US$ Million), 2021–2026
Table 159. BMC Software Recent Development
Table 160. ServiceNow Company Details
Table 161. ServiceNow Business Overview
Table 162. ServiceNow Security Operations (SecOps) Software Product
Table 163. ServiceNow Revenue in Security Operations (SecOps) Software Business (US$ Million), 2021–2026
Table 164. ServiceNow Recent Development
Table 165. Neusoft Company Details
Table 166. Neusoft Business Overview
Table 167. Neusoft Security Operations (SecOps) Software Product
Table 168. Neusoft Revenue in Security Operations (SecOps) Software Business (US$ Million), 2021–2026
Table 169. Neusoft Recent Development
Table 170. Motorola Solutions Company Details
Table 171. Motorola Solutions Business Overview
Table 172. Motorola Solutions Security Operations (SecOps) Software Product
Table 173. Motorola Solutions Revenue in Security Operations (SecOps) Software Business (US$ Million), 2021–2026
Table 174. Motorola Solutions Recent Development
Table 175. IBM Company Details
Table 176. IBM Business Overview
Table 177. IBM Security Operations (SecOps) Software Product
Table 178. IBM Revenue in Security Operations (SecOps) Software Business (US$ Million), 2021–2026
Table 179. IBM Recent Development
Table 180. SONDA Company Details
Table 181. SONDA Business Overview
Table 182. SONDA Security Operations (SecOps) Software Product
Table 183. SONDA Revenue in Security Operations (SecOps) Software Business (US$ Million), 2021–2026
Table 184. SONDA Recent Development
Table 185. QualiTest Company Details
Table 186. QualiTest Business Overview
Table 187. QualiTest Security Operations (SecOps) Software Product
Table 188. QualiTest Revenue in Security Operations (SecOps) Software Business (US$ Million), 2021–2026
Table 189. QualiTest Recent Development
Table 190. Dark Matter Company Details
Table 191. Dark Matter Business Overview
Table 192. Dark Matter Security Operations (SecOps) Software Product
Table 193. Dark Matter Revenue in Security Operations (SecOps) Software Business (US$ Million), 2021–2026
Table 194. Dark Matter Recent Development
Table 195. Splunk Company Details
Table 196. Splunk Business Overview
Table 197. Splunk Security Operations (SecOps) Software Product
Table 198. Splunk Revenue in Security Operations (SecOps) Software Business (US$ Million), 2021–2026
Table 199. Splunk Recent Development
Table 200. Capita Company Details
Table 201. Capita Business Overview
Table 202. Capita Security Operations (SecOps) Software Product
Table 203. Capita Revenue in Security Operations (SecOps) Software Business (US$ Million), 2021–2026
Table 204. Capita Recent Development
Table 205. D3 Security Company Details
Table 206. D3 Security Business Overview
Table 207. D3 Security Security Operations (SecOps) Software Product
Table 208. D3 Security Revenue in Security Operations (SecOps) Software Business (US$ Million), 2021–2026
Table 209. D3 Security Recent Development
Table 210. Research Programs/Design for This Report
Table 211. Key Data Information from Secondary Sources
Table 212. Key Data Information from Primary Sources
Table 213. Authors List of This Report
List of Figures
Figure 1. Security Operations (SecOps) Software Picture
Figure 2. Global Security Operations (SecOps) Software Market Size Comparison by Type (US$ Million), 2021–2032
Figure 3. Global Security Operations (SecOps) Software Market Share by Type: 2025 vs 2032
Figure 4. Cloud Based Features
Figure 5. On-premises Features
Figure 6. Global Security Operations (SecOps) Software Market Size Comparison by Pricing Model (US$ Million), 2021–2032
Figure 7. Data Volume Features
Figure 8. Endpoint Count Features
Figure 9. Feature Bundles Features
Figure 10. Data Retention Period Features
Figure 11. Global Security Operations (SecOps) Software Market Size Comparison by Target Environment (US$ Million), 2021–2032
Figure 12. Cloud-Centric Features
Figure 13. Network & Perimeter Features
Figure 14. Hybrid and Multi-Cloud Features
Figure 15. Global Security Operations (SecOps) Software Market Size Comparison by Automation Level (US$ Million), 2021–2032
Figure 16. Manual Operations Features
Figure 17. Augmented Analysis Features
Figure 18. Automated Response Features
Figure 19. Predictive & Autonomous Features
Figure 20. Global Security Operations (SecOps) Software Market Size by Application (US$ Million), 2021–2032
Figure 21. Global Security Operations (SecOps) Software Market Share by Application: 2025 vs 2032
Figure 22. SMEs Case Studies
Figure 23. Large Enterprises Case Studies
Figure 24. Security Operations (SecOps) Software Report Years Considered
Figure 25. Global Security Operations (SecOps) Software Market Size (US$ Million), Year-over-Year: 2021–2032
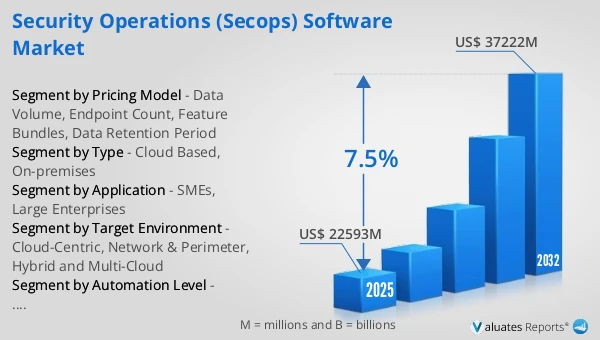
Figure 26. Global Security Operations (SecOps) Software Market Size, (US$ Million), 2021 vs 2025 vs 2032
Figure 27. Global Security Operations (SecOps) Software Market Share by Region: 2025 vs 2032
Figure 28. Global Security Operations (SecOps) Software Market Share by Players in 2025
Figure 29. Global Security Operations (SecOps) Software Market Share by Company Type (Tier 1, Tier 2, and Tier 3)
Figure 30. The Top 10 and 5 Players Market Share by Security Operations (SecOps) Software Revenue in 2025
Figure 31. North America Security Operations (SecOps) Software Market Size YoY Growth (US$ Million), 2021–2032
Figure 32. North America Security Operations (SecOps) Software Market Share by Country (2021–2032)
Figure 33. United States Security Operations (SecOps) Software Market Size YoY Growth (US$ Million), 2021–2032
Figure 34. Canada Security Operations (SecOps) Software Market Size YoY Growth (US$ Million), 2021–2032
Figure 35. Europe Security Operations (SecOps) Software Market Size YoY Growth (US$ Million), 2021–2032
Figure 36. Europe Security Operations (SecOps) Software Market Share by Country (2021–2032)
Figure 37. Germany Security Operations (SecOps) Software Market Size YoY Growth (US$ Million), 2021–2032
Figure 38. France Security Operations (SecOps) Software Market Size YoY Growth (US$ Million), 2021–2032
Figure 39. U.K. Security Operations (SecOps) Software Market Size YoY Growth (US$ Million), 2021–2032
Figure 40. Italy Security Operations (SecOps) Software Market Size YoY Growth (US$ Million), 2021–2032
Figure 41. Russia Security Operations (SecOps) Software Market Size YoY Growth (US$ Million), 2021–2032
Figure 42. Ireland Security Operations (SecOps) Software Market Size YoY Growth (US$ Million), 2021–2032
Figure 43. Asia-Pacific Security Operations (SecOps) Software Market Size YoY Growth (US$ Million), 2021–2032
Figure 44. Asia-Pacific Security Operations (SecOps) Software Market Share by Region (2021–2032)
Figure 45. China Security Operations (SecOps) Software Market Size YoY Growth (US$ Million), 2021–2032
Figure 46. Japan Security Operations (SecOps) Software Market Size YoY Growth (US$ Million), 2021–2032
Figure 47. South Korea Security Operations (SecOps) Software Market Size YoY Growth (US$ Million), 2021–2032
Figure 48. Southeast Asia Security Operations (SecOps) Software Market Size YoY Growth (US$ Million), 2021–2032
Figure 49. India Security Operations (SecOps) Software Market Size YoY Growth (US$ Million), 2021–2032
Figure 50. Australia & New Zealand Security Operations (SecOps) Software Market Size YoY Growth (US$ Million), 2021–2032
Figure 51. Latin America Security Operations (SecOps) Software Market Size YoY Growth (US$ Million), 2021–2032
Figure 52. Latin America Security Operations (SecOps) Software Market Share by Country (2021–2032)
Figure 53. Mexico Security Operations (SecOps) Software Market Size YoY Growth (US$ Million), 2021–2032
Figure 54. Brazil Security Operations (SecOps) Software Market Size YoY Growth (US$ Million), 2021–2032
Figure 55. Middle East & Africa Security Operations (SecOps) Software Market Size YoY Growth (US$ Million), 2021–2032
Figure 56. Middle East & Africa Security Operations (SecOps) Software Market Share by Country (2021–2032)
Figure 57. Israel Security Operations (SecOps) Software Market Size YoY Growth (US$ Million), 2021–2032
Figure 58. Saudi Arabia Security Operations (SecOps) Software Market Size YoY Growth (US$ Million), 2021–2032
Figure 59. UAE Security Operations (SecOps) Software Market Size YoY Growth (US$ Million), 2021–2032
Figure 60. Broadcom Revenue Growth Rate in Security Operations (SecOps) Software Business (2021–2026)
Figure 61. Cisco Revenue Growth Rate in Security Operations (SecOps) Software Business (2021–2026)
Figure 62. Trend Micro Revenue Growth Rate in Security Operations (SecOps) Software Business (2021–2026)
Figure 63. McAfee Revenue Growth Rate in Security Operations (SecOps) Software Business (2021–2026)
Figure 64. ESET Revenue Growth Rate in Security Operations (SecOps) Software Business (2021–2026)
Figure 65. OpenText Revenue Growth Rate in Security Operations (SecOps) Software Business (2021–2026)
Figure 66. Fortinet Revenue Growth Rate in Security Operations (SecOps) Software Business (2021–2026)
Figure 67. Exabeam Revenue Growth Rate in Security Operations (SecOps) Software Business (2021–2026)
Figure 68. Trellix Revenue Growth Rate in Security Operations (SecOps) Software Business (2021–2026)
Figure 69. Securonix Revenue Growth Rate in Security Operations (SecOps) Software Business (2021–2026)
Figure 70. Elastic Revenue Growth Rate in Security Operations (SecOps) Software Business (2021–2026)
Figure 71. Logpoint Revenue Growth Rate in Security Operations (SecOps) Software Business (2021–2026)
Figure 72. Rapid7 Revenue Growth Rate in Security Operations (SecOps) Software Business (2021–2026)
Figure 73. CrowdStrike Revenue Growth Rate in Security Operations (SecOps) Software Business (2021–2026)
Figure 74. SolarWinds Revenue Growth Rate in Security Operations (SecOps) Software Business (2021–2026)
Figure 75. ManageEngine Revenue Growth Rate in Security Operations (SecOps) Software Business (2021–2026)
Figure 76. Graylog Revenue Growth Rate in Security Operations (SecOps) Software Business (2021–2026)
Figure 77. Microsoft Revenue Growth Rate in Security Operations (SecOps) Software Business (2021–2026)
Figure 78. Sumo Logic Revenue Growth Rate in Security Operations (SecOps) Software Business (2021–2026)
Figure 79. BMC Software Revenue Growth Rate in Security Operations (SecOps) Software Business (2021–2026)
Figure 80. ServiceNow Revenue Growth Rate in Security Operations (SecOps) Software Business (2021–2026)
Figure 81. Neusoft Revenue Growth Rate in Security Operations (SecOps) Software Business (2021–2026)
Figure 82. Motorola Solutions Revenue Growth Rate in Security Operations (SecOps) Software Business (2021–2026)
Figure 83. IBM Revenue Growth Rate in Security Operations (SecOps) Software Business (2021–2026)
Figure 84. SONDA Revenue Growth Rate in Security Operations (SecOps) Software Business (2021–2026)
Figure 85. QualiTest Revenue Growth Rate in Security Operations (SecOps) Software Business (2021–2026)
Figure 86. Dark Matter Revenue Growth Rate in Security Operations (SecOps) Software Business (2021–2026)
Figure 87. Splunk Revenue Growth Rate in Security Operations (SecOps) Software Business (2021–2026)
Figure 88. Capita Revenue Growth Rate in Security Operations (SecOps) Software Business (2021–2026)
Figure 89. D3 Security Revenue Growth Rate in Security Operations (SecOps) Software Business (2021–2026)
Figure 90. Bottom-up and Top-down Approaches for This Report
Figure 91. Data Triangulation
Figure 92. Key Executives Interviewed