List of Tables
Table 1. Global Continuous Flow Photochemical Reactors Market Value by Type, (US$ Million) & (2024 VS 2031)
Table 2. Global Continuous Flow Photochemical Reactors Market Value by Reaction Type, (US$ Million) & (2024 VS 2031)
Table 3. Global Continuous Flow Photochemical Reactors Market Value by Applied Chemistry Reaction, (US$ Million) & (2024 VS 2031)
Table 4. Global Continuous Flow Photochemical Reactors Market Value by Industry, (US$ Million) & (2024 VS 2031)
Table 5. Global Continuous Flow Photochemical Reactors Production Capacity (Units) by Manufacturers in 2024
Table 6. Global Continuous Flow Photochemical Reactors Production by Manufacturers (2020-2025) & (Units)
Table 7. Global Continuous Flow Photochemical Reactors Production Market Share by Manufacturers (2020-2025)
Table 8. Global Continuous Flow Photochemical Reactors Production Value by Manufacturers (2020-2025) & (US$ Million)
Table 9. Global Continuous Flow Photochemical Reactors Production Value Share by Manufacturers (2020-2025)
Table 10. Global Key Players of Continuous Flow Photochemical Reactors, Industry Ranking, 2023 VS 2024
Table 11. Company Type (Tier 1, Tier 2, and Tier 3) & (based on the Production Value in Continuous Flow Photochemical Reactors as of 2024)
Table 12. Global Market Continuous Flow Photochemical Reactors Average Price by Manufacturers (US$/Unit) & (2020-2025)
Table 13. Global Key Manufacturers of Continuous Flow Photochemical Reactors, Manufacturing Base Distribution and Headquarters
Table 14. Global Key Manufacturers of Continuous Flow Photochemical Reactors, Product Offered and Application
Table 15. Global Key Manufacturers of Continuous Flow Photochemical Reactors, Date of Enter into This Industry
Table 16. Global Continuous Flow Photochemical Reactors Manufacturers Market Concentration Ratio (CR5 and HHI)
Table 17. Mergers & Acquisitions, Expansion Plans
Table 18. Global Continuous Flow Photochemical Reactors Production Value by Region: 2020 VS 2024 VS 2031 (US$ Million)
Table 19. Global Continuous Flow Photochemical Reactors Production Value (US$ Million) by Region (2020-2025)
Table 20. Global Continuous Flow Photochemical Reactors Production Value Market Share by Region (2020-2025)
Table 21. Global Continuous Flow Photochemical Reactors Production Value (US$ Million) Forecast by Region (2026-2031)
Table 22. Global Continuous Flow Photochemical Reactors Production Value Market Share Forecast by Region (2026-2031)
Table 23. Global Continuous Flow Photochemical Reactors Production Comparison by Region: 2020 VS 2024 VS 2031 (Units)
Table 24. Global Continuous Flow Photochemical Reactors Production (Units) by Region (2020-2025)
Table 25. Global Continuous Flow Photochemical Reactors Production Market Share by Region (2020-2025)
Table 26. Global Continuous Flow Photochemical Reactors Production (Units) Forecast by Region (2026-2031)
Table 27. Global Continuous Flow Photochemical Reactors Production Market Share Forecast by Region (2026-2031)
Table 28. Global Continuous Flow Photochemical Reactors Market Average Price (US$/Unit) by Region (2020-2025)
Table 29. Global Continuous Flow Photochemical Reactors Market Average Price (US$/Unit) by Region (2026-2031)
Table 30. Global Continuous Flow Photochemical Reactors Consumption Growth Rate by Region: 2020 VS 2024 VS 2031 (Units)
Table 31. Global Continuous Flow Photochemical Reactors Consumption by Region (2020-2025) & (Units)
Table 32. Global Continuous Flow Photochemical Reactors Consumption Market Share by Region (2020-2025)
Table 33. Global Continuous Flow Photochemical Reactors Forecasted Consumption by Region (2026-2031) & (Units)
Table 34. Global Continuous Flow Photochemical Reactors Forecasted Consumption Market Share by Region (2026-2031)
Table 35. North America Continuous Flow Photochemical Reactors Consumption Growth Rate by Country: 2020 VS 2024 VS 2031 (Units)
Table 36. North America Continuous Flow Photochemical Reactors Consumption by Country (2020-2025) & (Units)
Table 37. North America Continuous Flow Photochemical Reactors Consumption by Country (2026-2031) & (Units)
Table 38. Europe Continuous Flow Photochemical Reactors Consumption Growth Rate by Country: 2020 VS 2024 VS 2031 (Units)
Table 39. Europe Continuous Flow Photochemical Reactors Consumption by Country (2020-2025) & (Units)
Table 40. Europe Continuous Flow Photochemical Reactors Consumption by Country (2026-2031) & (Units)
Table 41. Asia Pacific Continuous Flow Photochemical Reactors Consumption Growth Rate by Region: 2020 VS 2024 VS 2031 (Units)
Table 42. Asia Pacific Continuous Flow Photochemical Reactors Consumption by Region (2020-2025) & (Units)
Table 43. Asia Pacific Continuous Flow Photochemical Reactors Consumption by Region (2026-2031) & (Units)
Table 44. Latin America, Middle East & Africa Continuous Flow Photochemical Reactors Consumption Growth Rate by Country: 2020 VS 2024 VS 2031 (Units)
Table 45. Latin America, Middle East & Africa Continuous Flow Photochemical Reactors Consumption by Country (2020-2025) & (Units)
Table 46. Latin America, Middle East & Africa Continuous Flow Photochemical Reactors Consumption by Country (2026-2031) & (Units)
Table 47. Global Continuous Flow Photochemical Reactors Production (Units) by Type (2020-2025)
Table 48. Global Continuous Flow Photochemical Reactors Production (Units) by Type (2026-2031)
Table 49. Global Continuous Flow Photochemical Reactors Production Market Share by Type (2020-2025)
Table 50. Global Continuous Flow Photochemical Reactors Production Market Share by Type (2026-2031)
Table 51. Global Continuous Flow Photochemical Reactors Production Value (US$ Million) by Type (2020-2025)
Table 52. Global Continuous Flow Photochemical Reactors Production Value (US$ Million) by Type (2026-2031)
Table 53. Global Continuous Flow Photochemical Reactors Production Value Market Share by Type (2020-2025)
Table 54. Global Continuous Flow Photochemical Reactors Production Value Market Share by Type (2026-2031)
Table 55. Global Continuous Flow Photochemical Reactors Price (US$/Unit) by Type (2020-2025)
Table 56. Global Continuous Flow Photochemical Reactors Price (US$/Unit) by Type (2026-2031)
Table 57. Global Continuous Flow Photochemical Reactors Production (Units) by Industry (2020-2025)
Table 58. Global Continuous Flow Photochemical Reactors Production (Units) by Industry (2026-2031)
Table 59. Global Continuous Flow Photochemical Reactors Production Market Share by Industry (2020-2025)
Table 60. Global Continuous Flow Photochemical Reactors Production Market Share by Industry (2026-2031)
Table 61. Global Continuous Flow Photochemical Reactors Production Value (US$ Million) by Industry (2020-2025)
Table 62. Global Continuous Flow Photochemical Reactors Production Value (US$ Million) by Industry (2026-2031)
Table 63. Global Continuous Flow Photochemical Reactors Production Value Market Share by Industry (2020-2025)
Table 64. Global Continuous Flow Photochemical Reactors Production Value Market Share by Industry (2026-2031)
Table 65. Global Continuous Flow Photochemical Reactors Price (US$/Unit) by Industry (2020-2025)
Table 66. Global Continuous Flow Photochemical Reactors Price (US$/Unit) by Industry (2026-2031)
Table 67. Corning Incorporated Continuous Flow Photochemical Reactors Company Information
Table 68. Corning Incorporated Continuous Flow Photochemical Reactors Specification and Application
Table 69. Corning Incorporated Continuous Flow Photochemical Reactors Production (Units), Value (US$ Million), Price (US$/Unit) and Gross Margin (2020-2025)
Table 70. Corning Incorporated Main Business and Markets Served
Table 71. Corning Incorporated Recent Developments/Updates
Table 72. Creaflow Continuous Flow Photochemical Reactors Company Information
Table 73. Creaflow Continuous Flow Photochemical Reactors Specification and Application
Table 74. Creaflow Continuous Flow Photochemical Reactors Production (Units), Value (US$ Million), Price (US$/Unit) and Gross Margin (2020-2025)
Table 75. Creaflow Main Business and Markets Served
Table 76. Creaflow Recent Developments/Updates
Table 77. Halen Technologies Continuous Flow Photochemical Reactors Company Information
Table 78. Halen Technologies Continuous Flow Photochemical Reactors Specification and Application
Table 79. Halen Technologies Continuous Flow Photochemical Reactors Production (Units), Value (US$ Million), Price (US$/Unit) and Gross Margin (2020-2025)
Table 80. Halen Technologies Main Business and Markets Served
Table 81. Halen Technologies Recent Developments/Updates
Table 82. Vapourtec Continuous Flow Photochemical Reactors Company Information
Table 83. Vapourtec Continuous Flow Photochemical Reactors Specification and Application
Table 84. Vapourtec Continuous Flow Photochemical Reactors Production (Units), Value (US$ Million), Price (US$/Unit) and Gross Margin (2020-2025)
Table 85. Vapourtec Main Business and Markets Served
Table 86. Vapourtec Recent Developments/Updates
Table 87. Syrris Continuous Flow Photochemical Reactors Company Information
Table 88. Syrris Continuous Flow Photochemical Reactors Specification and Application
Table 89. Syrris Continuous Flow Photochemical Reactors Production (Units), Value (US$ Million), Price (US$/Unit) and Gross Margin (2020-2025)
Table 90. Syrris Main Business and Markets Served
Table 91. Syrris Recent Developments/Updates
Table 92. Uniqsis Continuous Flow Photochemical Reactors Company Information
Table 93. Uniqsis Continuous Flow Photochemical Reactors Specification and Application
Table 94. Uniqsis Continuous Flow Photochemical Reactors Production (Units), Value (US$ Million), Price (US$/Unit) and Gross Margin (2020-2025)
Table 95. Uniqsis Main Business and Markets Served
Table 96. Uniqsis Recent Developments/Updates
Table 97. 3S Tech Continuous Flow Photochemical Reactors Company Information
Table 98. 3S Tech Continuous Flow Photochemical Reactors Specification and Application
Table 99. 3S Tech Continuous Flow Photochemical Reactors Production (Units), Value (US$ Million), Price (US$/Unit) and Gross Margin (2020-2025)
Table 100. 3S Tech Main Business and Markets Served
Table 101. 3S Tech Recent Developments/Updates
Table 102. ThalesNano Continuous Flow Photochemical Reactors Company Information
Table 103. ThalesNano Continuous Flow Photochemical Reactors Specification and Application
Table 104. ThalesNano Continuous Flow Photochemical Reactors Production (Units), Value (US$ Million), Price (US$/Unit) and Gross Margin (2020-2025)
Table 105. ThalesNano Main Business and Markets Served
Table 106. ThalesNano Recent Developments/Updates
Table 107. Hepatochem Continuous Flow Photochemical Reactors Company Information
Table 108. Hepatochem Continuous Flow Photochemical Reactors Specification and Application
Table 109. Hepatochem Continuous Flow Photochemical Reactors Production (Units), Value (US$ Million), Price (US$/Unit) and Gross Margin (2020-2025)
Table 110. Hepatochem Main Business and Markets Served
Table 111. Hepatochem Recent Developments/Updates
Table 112. IKA Continuous Flow Photochemical Reactors Company Information
Table 113. IKA Continuous Flow Photochemical Reactors Specification and Application
Table 114. IKA Continuous Flow Photochemical Reactors Production (Units), Value (US$ Million), Price (US$/Unit) and Gross Margin (2020-2025)
Table 115. IKA Main Business and Markets Served
Table 116. IKA Recent Developments/Updates
Table 117. Asynt Continuous Flow Photochemical Reactors Company Information
Table 118. Asynt Continuous Flow Photochemical Reactors Specification and Application
Table 119. Asynt Continuous Flow Photochemical Reactors Production (Units), Value (US$ Million), Price (US$/Unit) and Gross Margin (2020-2025)
Table 120. Asynt Main Business and Markets Served
Table 121. Asynt Recent Developments/Updates
Table 122. Analytical Sales and Services Continuous Flow Photochemical Reactors Company Information
Table 123. Analytical Sales and Services Continuous Flow Photochemical Reactors Specification and Application
Table 124. Analytical Sales and Services Continuous Flow Photochemical Reactors Production (Units), Value (US$ Million), Price (US$/Unit) and Gross Margin (2020-2025)
Table 125. Analytical Sales and Services Main Business and Markets Served
Table 126. Analytical Sales and Services Recent Developments/Updates
Table 127. Beijing Zhong Ke Microfluidics(ZKWL) Continuous Flow Photochemical Reactors Company Information
Table 128. Beijing Zhong Ke Microfluidics(ZKWL) Continuous Flow Photochemical Reactors Specification and Application
Table 129. Beijing Zhong Ke Microfluidics(ZKWL) Continuous Flow Photochemical Reactors Production (Units), Value (US$ Million), Price (US$/Unit) and Gross Margin (2020-2025)
Table 130. Beijing Zhong Ke Microfluidics(ZKWL) Main Business and Markets Served
Table 131. Beijing Zhong Ke Microfluidics(ZKWL) Recent Developments/Updates
Table 132. Microflu Microfluidics Technology (Changzhou)Co.,Ltd Continuous Flow Photochemical Reactors Company Information
Table 133. Microflu Microfluidics Technology (Changzhou)Co.,Ltd Continuous Flow Photochemical Reactors Specification and Application
Table 134. Microflu Microfluidics Technology (Changzhou)Co.,Ltd Continuous Flow Photochemical Reactors Production (Units), Value (US$ Million), Price (US$/Unit) and Gross Margin (2020-2025)
Table 135. Microflu Microfluidics Technology (Changzhou)Co.,Ltd Main Business and Markets Served
Table 136. Microflu Microfluidics Technology (Changzhou)Co.,Ltd Recent Developments/Updates
Table 137. Key Raw Materials Lists
Table 138. Raw Materials Key Suppliers Lists
Table 139. Continuous Flow Photochemical Reactors Distributors List
Table 140. Continuous Flow Photochemical Reactors Customers List
Table 141. Continuous Flow Photochemical Reactors Market Trends
Table 142. Continuous Flow Photochemical Reactors Market Drivers
Table 143. Continuous Flow Photochemical Reactors Market Challenges
Table 144. Continuous Flow Photochemical Reactors Market Restraints
Table 145. Research Programs/Design for This Report
Table 146. Key Data Information from Secondary Sources
Table 147. Key Data Information from Primary Sources
Table 148. Authors List of This Report
List of Figures
Figure 1. Product Picture of Continuous Flow Photochemical Reactors
Figure 2. Global Continuous Flow Photochemical Reactors Market Value by Type, (US$ Million) & (2020-2031)
Figure 3. Global Continuous Flow Photochemical Reactors Market Share by Type: 2024 VS 2031
Figure 4. Tube/Tubular Reactor (Straight‐tube, Coiled‐tube, Annular, Falling-film) Product Picture
Figure 5. Plate Flow Reactor (Flat Bed Mixing, Microfluidic Chip, Falling‑film Plate) Product Picture
Figure 6. Photonic‑Optimized Flow CSTR Product Picture
Figure 7. Packed‑Bed/Fixed‑Film Reactor Product Picture
Figure 8. Membrane‑Photoreactor Product Picture
Figure 9. Other Product Picture
Figure 10. Global Continuous Flow Photochemical Reactors Market Value by Reaction Type, (US$ Million) & (2020-2031)
Figure 11. Global Continuous Flow Photochemical Reactors Market Share by Reaction Type: 2024 VS 2031
Figure 12. Homogeneous Systems Product Picture
Figure 13. Heterogeneous Systems Product Picture
Figure 14. Gas-Liquid Reactions Product Picture
Figure 15. Liquid-Solid Reactions Product Picture
Figure 16. Gas-Liquid-Solid Three‑Phase Reactions Product Picture
Figure 17. Global Continuous Flow Photochemical Reactors Market Value by Applied Chemistry Reaction, (US$ Million) & (2020-2031)
Figure 18. Global Continuous Flow Photochemical Reactors Market Share by Applied Chemistry Reaction: 2024 VS 2031
Figure 19. Synthetic Organic Photochemistry Product Picture
Figure 20. Environmental Photocatalysis Product Picture
Figure 21. Energy Conversion Photochemistry Product Picture
Figure 22. Photopolymerization & Materials (Photolithography/Microfabrication, Free‑Radical/Cationic Photopolymerization) Product Picture
Figure 23. Photobiocatalysis Product Picture
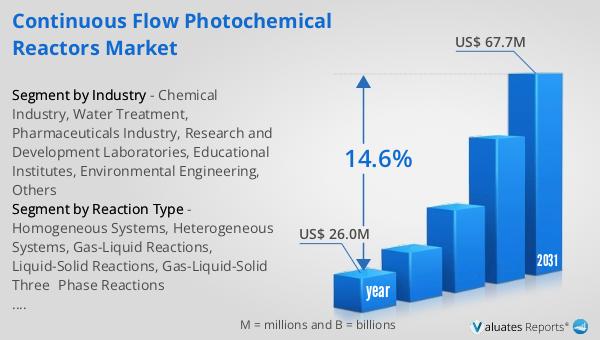
Figure 24. Global Continuous Flow Photochemical Reactors Market Value by Industry, (US$ Million) & (2020-2031)
Figure 25. Global Continuous Flow Photochemical Reactors Market Share by Industry: 2024 VS 2031
Figure 26. Chemical Industry
Figure 27. Water Treatment
Figure 28. Pharmaceuticals Industry
Figure 29. Research and Development Laboratories
Figure 30. Educational Institutes
Figure 31. Environmental Engineering
Figure 32. Others
Figure 33. Global Continuous Flow Photochemical Reactors Production Value (US$ Million), 2020 VS 2024 VS 2031
Figure 34. Global Continuous Flow Photochemical Reactors Production Value (US$ Million) & (2020-2031)
Figure 35. Global Continuous Flow Photochemical Reactors Production Capacity (Units) & (2020-2031)
Figure 36. Global Continuous Flow Photochemical Reactors Production (Units) & (2020-2031)
Figure 37. Global Continuous Flow Photochemical Reactors Average Price (US$/Unit) & (2020-2031)
Figure 38. Continuous Flow Photochemical Reactors Report Years Considered
Figure 39. Continuous Flow Photochemical Reactors Production Share by Manufacturers in 2024
Figure 40. Global Continuous Flow Photochemical Reactors Production Value Share by Manufacturers (2024)
Figure 41. Continuous Flow Photochemical Reactors Market Share by Company Type (Tier 1, Tier 2, and Tier 3): 2020 VS 2024
Figure 42. The Global 5 and 10 Largest Players: Market Share by Continuous Flow Photochemical Reactors Revenue in 2024
Figure 43. Global Continuous Flow Photochemical Reactors Production Value by Region: 2020 VS 2024 VS 2031 (US$ Million)
Figure 44. Global Continuous Flow Photochemical Reactors Production Value Market Share by Region: 2020 VS 2024 VS 2031
Figure 45. Global Continuous Flow Photochemical Reactors Production Comparison by Region: 2020 VS 2024 VS 2031 (Units)
Figure 46. Global Continuous Flow Photochemical Reactors Production Market Share by Region: 2020 VS 2024 VS 2031
Figure 47. North America Continuous Flow Photochemical Reactors Production Value (US$ Million) Growth Rate (2020-2031)
Figure 48. Europe Continuous Flow Photochemical Reactors Production Value (US$ Million) Growth Rate (2020-2031)
Figure 49. China Continuous Flow Photochemical Reactors Production Value (US$ Million) Growth Rate (2020-2031)
Figure 50. Japan Continuous Flow Photochemical Reactors Production Value (US$ Million) Growth Rate (2020-2031)
Figure 51. India Continuous Flow Photochemical Reactors Production Value (US$ Million) Growth Rate (2020-2031)
Figure 52. Global Continuous Flow Photochemical Reactors Consumption by Region: 2020 VS 2024 VS 2031 (Units)
Figure 53. Global Continuous Flow Photochemical Reactors Consumption Market Share by Region: 2020 VS 2024 VS 2031
Figure 54. North America Continuous Flow Photochemical Reactors Consumption and Growth Rate (2020-2031) & (Units)
Figure 55. North America Continuous Flow Photochemical Reactors Consumption Market Share by Country (2020-2031)
Figure 56. U.S. Continuous Flow Photochemical Reactors Consumption and Growth Rate (2020-2031) & (Units)
Figure 57. Canada Continuous Flow Photochemical Reactors Consumption and Growth Rate (2020-2031) & (Units)
Figure 58. Europe Continuous Flow Photochemical Reactors Consumption and Growth Rate (2020-2031) & (Units)
Figure 59. Europe Continuous Flow Photochemical Reactors Consumption Market Share by Country (2020-2031)
Figure 60. Germany Continuous Flow Photochemical Reactors Consumption and Growth Rate (2020-2031) & (Units)
Figure 61. France Continuous Flow Photochemical Reactors Consumption and Growth Rate (2020-2031) & (Units)
Figure 62. U.K. Continuous Flow Photochemical Reactors Consumption and Growth Rate (2020-2031) & (Units)
Figure 63. Italy Continuous Flow Photochemical Reactors Consumption and Growth Rate (2020-2031) & (Units)
Figure 64. Netherlands Continuous Flow Photochemical Reactors Consumption and Growth Rate (2020-2031) & (Units)
Figure 65. Asia Pacific Continuous Flow Photochemical Reactors Consumption and Growth Rate (2020-2031) & (Units)
Figure 66. Asia Pacific Continuous Flow Photochemical Reactors Consumption Market Share by Region (2020-2031)
Figure 67. China Continuous Flow Photochemical Reactors Consumption and Growth Rate (2020-2031) & (Units)
Figure 68. Japan Continuous Flow Photochemical Reactors Consumption and Growth Rate (2020-2031) & (Units)
Figure 69. South Korea Continuous Flow Photochemical Reactors Consumption and Growth Rate (2020-2031) & (Units)
Figure 70. China Taiwan Continuous Flow Photochemical Reactors Consumption and Growth Rate (2020-2031) & (Units)
Figure 71. Southeast Asia Continuous Flow Photochemical Reactors Consumption and Growth Rate (2020-2031) & (Units)
Figure 72. India Continuous Flow Photochemical Reactors Consumption and Growth Rate (2020-2031) & (Units)
Figure 73. Latin America, Middle East & Africa Continuous Flow Photochemical Reactors Consumption and Growth Rate (2020-2031) & (Units)
Figure 74. Latin America, Middle East & Africa Continuous Flow Photochemical Reactors Consumption Market Share by Country (2020-2031)
Figure 75. Mexico Continuous Flow Photochemical Reactors Consumption and Growth Rate (2020-2031) & (Units)
Figure 76. Brazil Continuous Flow Photochemical Reactors Consumption and Growth Rate (2020-2031) & (Units)
Figure 77. Turkey Continuous Flow Photochemical Reactors Consumption and Growth Rate (2020-2031) & (Units)
Figure 78. GCC Countries Continuous Flow Photochemical Reactors Consumption and Growth Rate (2020-2031) & (Units)
Figure 79. Global Production Market Share of Continuous Flow Photochemical Reactors by Type (2020-2031)
Figure 80. Global Production Value Market Share of Continuous Flow Photochemical Reactors by Type (2020-2031)
Figure 81. Global Continuous Flow Photochemical Reactors Price (US$/Unit) by Type (2020-2031)
Figure 82. Global Production Market Share of Continuous Flow Photochemical Reactors by Industry (2020-2031)
Figure 83. Global Production Value Market Share of Continuous Flow Photochemical Reactors by Industry (2020-2031)
Figure 84. Global Continuous Flow Photochemical Reactors Price (US$/Unit) by Industry (2020-2031)
Figure 85. Continuous Flow Photochemical Reactors Value Chain
Figure 86. Channels of Distribution (Direct Vs Distribution)
Figure 87. Bottom-up and Top-down Approaches for This Report
Figure 88. Data Triangulation