FEATURED COMPANIES
ADT
Hangzhou Hikvision Digital Technology
Secom
Johnson Controls (Tyco)
Anixter
Cisco
Genetec
Honeywell
BOSCH Security
STANLEY
Senstar
China
India
Tyco
Honeywell INC
Physical Security Market Trends, outlook - 2028
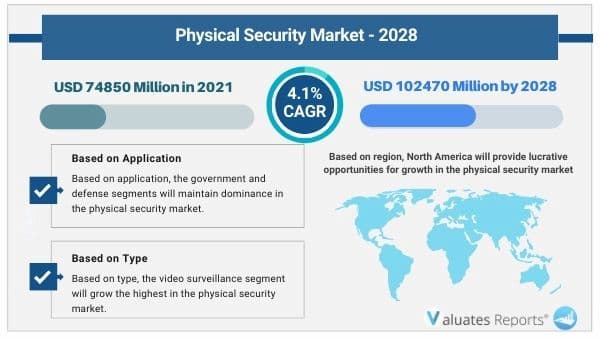
The global Physical Security market size is projected to reach USD 102470 million by 2028, from USD 74850 million in 2021, at a CAGR of 4.1% during 2022-2028.
Key drivers of the physical security market include the rising need for securing areas around government buildings, offices, and the defense sector.
Transportation and logistics systems are the prime targets for carrying out terrorism, vandalism, or shipping illegal goods. This will boost the need for physical security thereby driving the growth of the market during the forecast period. The expanding telecommunication industry will positively impact the physical security market trends in the coming years.The growing incidences of bank robberies, security breaches, and cyber-attacks potentially harm the critical assets of financial institutions. This will spur market expansion in the future. Physical security systems are paramount for schools, and colleges to enhance the safety of their working staff, teachers, and students. This increases the demand for the physical security system market. The rapidly changing retail landscape will witness significant adoption of physical security systems thereby spurring the market ahead in the upcoming years. Geopolitical issues and high-risk locations provide a real threat to the oil, gas, and energy industry. This will augment the growth of the market in the coming years. There are several security challenges in the residential and hospitality industry that will fuel the demand for the market during the forecast period.
Trends Influencing Physical Security Market
Public, defense, and government sector
Government agencies have properties of their own. There is an urgent need to protect the premises and crucial assets inside these buildings. Integration of video surveillance, and access control systems enable 360-degree monitoring from a wide range of cameras. The video feeds are shared from doors and gate controllers, biometrics systems, card, and fob readers. Video analytics can be converted into software footage for strong evidence of a person leaving or entering the building. It is extremely helpful in perimeter security detection, loitering, unknown object identification, and motion sensing. Video management systems can be easily stored in the cloud and can lead to faster retrieval of videos during forensic searches. This is extremely beneficial in the defense space as well. These factors will augment the growth of the physical security market in the near future.
Transportation industry and logistical issues
Many transport hubs, terminals, maritime ports, and freight shipping trucks are investing heavily into physical security solutions as they are the centers for terrorist attacks, cargo thefts, and smuggling of illegal items like drugs, contraband, precious antiques, piracy, etc. Stringent access controls like CCTV cameras at crucial checkpoints, and loading and unloading sites can help reduce the number of break-ins. Airports and railway stations require robust screening processes to manage the huge inflow of crowds every day. Moreover, event-based monitoring filters out the extra noise in screen footage thereby eliminating the need for security personnel to watch live feeds all day. This provides actionable intelligence. This is going to drive the growth of the physical security market during the forecast period.
Need for securing telecom sector
On-site cell tower threats and copper cable thefts are recurring issues faced by mobile operators. Smart access management controls are put in place to protect the shared network access of cell stations. A smart key is created which is tough to duplicate and is reprogrammable. It can be locked, unlocked, and quickly disabled in case of any unknown intrusion or vandalism. There is no requirement for any power, cables, or battery. The advanced software provides key analysis on authorization and auditing practices. This proves highly effective for telecom operators to monitor their cell tower infrastructure. Such factors will augment the growth of the physical security market in the subsequent years.
BFSI sector
Banks and credit unions are seeking to minimize the losses incurred due to robberies, thefts, larceny, burglaries, etc. Online security measures are equally important as important customer data is stored in the banking networks for seamless mobile banking transactions. Employee training, security checks, and automated access controls are put into place to protect critical assets. Auto relocking devices, video surveillance like CCTV cameras, security scanning, and metal detectors are some of the measures undertaken to prepare for the worst-case scenarios. This is going to surge the growth of the physical security market in the forthcoming years.
Security measures in the education industry
Educational institutions like schools and colleges are prime locations for cases of victimization, bullying, gang violence, and shooting incidences, especially in developed countries. This requires a security audit assessment. Furthermore, CCTV cameras have become a common thing in many schools to monitor the in-house property, staff, and students. Cameras are placed in strategic locations like dumpsters, parking areas, main perimeter, playground, lobby, hallways, corridors, classrooms, libraries, staff offices, intersections, cafe registers, bus pickup, etc. Additionally, motion sensing, card access, security alarm systems, and metal detectors are deployed. These factors will surge the demand for the physical security market in the subsequent years.
Retail
As businesses transition to the digital world cases of cyberattacks and ransomware are increasing relentlessly. The consequences are reduced downtime and frequent interruptions in online service delivery to consumers. Physical threats and shoplifting cases are on a rise across the globe. Measures such as AI-powered video analytics analyze a huge amount of data to detect any unwanted patterns and along with remote monitoring help in intruder identification, people counting and sharing images of the entire perimeter, and fence lines without the need for on-site presence. Remote sensing will allow retailers to maintain round-the-clock surveillance. This in turn will propel the physical security market forward during the forecast period.
Oil and gas industry
There are a host of challenges in the oil and gas industry as the onsite drilling and extraction plants are situated in faraway remote locations. These places are usually inaccessible and present several workplace hazards. Apart from the accidental risks, there is loss of physical equipment, financial loss, increasing geopolitical tension, strikes, or terrorist attacks that hamper a country’s financial and environmental capacity. Cybercrimes can lead to a complete shut down of the plant or trigger a full-blown explosion. There are solutions like full-time network monitoring, on-time alert systems for cyber attacks, etc. These factors will propel the growth of the physical security market in the forthcoming years.
Hospitality sector
The hotel industry is prone to major terrorist attacks, thefts, and unauthorized access of people with potential risk. As the industry is always open to people from all over the world it becomes essential to provide complete security, comfort, and convenience to your guests. Crowd management is necessary. There are a couple of tools to handle these situations like installing CCTV cameras, fire and life safety systems, smoke detectors, access controls through smart cards and intrusion alarms, etc. All these factors will boost the growth prospects of the physical security market in the upcoming years.
Physical Security
Physical security is the protection of software, personnel, hardware, data, and networks from events that can cause damage to an organization. It helps enterprises by safeguarding them against fire, terrorism, vandalism, and theft. It can be done by using various physical security devices such as CCTV surveillance, access control protocols, intruder alarms, Video Surveillance as a Service (VSaaS), Access Control as a Service (ACaaS), and other similar techniques.
Physical Security Market Size and Share
Based on type, the video surveillance segment will grow the highest in the physical security market share as high definition CCTVs, and IP cameras are installed in crucial infrastructural facilities such as government offices, retail stores, commercial spaces, banks, etc to prevent security threats and monitor any illegal activities.
Based on application, the government and defense segments will maintain dominance in the physical security market share owing to a rising need for securing government facilities from security intrusion and cyber threats, etc. Authorities around the world are deploying security measures to protect their crucial infrastructure.
Based on region, North America will provide lucrative opportunities for growth in the physical security market share due to technological advancements, strict regulatory compliance, and the increasing need to counter cases of terrorism, illegal immigration, cybersecurity threats, etc.
Physical Security Market Segments
Physical Security market is segmented by players, region (country), by Type and by Application. Players, stakeholders, and other participants in the global Physical Security market will be able to gain the upper hand as they use the report as a powerful resource. The segmental analysis focuses on revenue and forecast by Type and by Application for the period 2017-2028.
Physical Security Market Segment by Type
- Access Control System
- Video Surveillance
- Physical Security Information Management
- Perimeter Intrusion Detection & Prevention
- Security Scanning, Imaging & Metal Detection
- Fire & Life Safety
Physical Security Market Segment by Application
- Government, Defense & Public Sector
- Transportation & Logistics
- Telecom & IT
- BFSI
- Education
- Retail
- Oil, Gas & Energy
- Hospitality & Residential
- Others
By Company
- ADT
- Hangzhou Hikvision Digital Technology
- SECOM
- Johnson Controls (Tyco)
- Anixter
- Cisco
- Genetec
- Honeywell
- Bosch Security
- Stanley
- Senstar
By Region
- North America
- United States
- Canada
- Europe
- Germany
- France
- UK
- Italy
- Russia
- Nordic Countries
- Rest of Europe
- Asia-Pacific
- China
- Japan
- South Korea
- Southeast Asia
- India
- Australia
- Rest of Asia
- Latin America
- Mexico
- Brazil
- Rest of Latin America
- Middle East & Africa
- Turkey
- Saudi Arabia
- UAE
- Rest of MEA
Physical Security market Report Coverage
|
Report Metric |
Details |
|
Base Year: |
2021 |
|
Market Size in 2021: |
USD 74850 Million |
|
Forecast Period: |
2022 to 2028 |
|
Forecast Period 2021 to 2028 CAGR: |
4.1% |
|
2028 Value Projection: |
USD 102470 Million |
|
No. of Pages: |
110 |
|
Tables & Figures |
134 |
|
Segments covered: |
Type, Application, Region, Company |
Frequently Asked Questions About This Report
1. How big is the Physical Security market?
Ans. The market size of Physical Security market surpassed USD 4.1% million by 2028 with a CAGR of 4.1%.
2. What will be the market value of Physical Security market by the end of 2028?
Ans. The Physical Security market is projected to reach USD 4.1% million by 2028.
3. What are the segments of Physical Security market?
Ans. Physical Security market is segmented by Type, Application, Region, Company.
1 Report Business Overview
1.1 Study Scope
1.2 Market Analysis by Type
1.2.1 Global Physical Security Market Size Growth Rate by Type, 2017 VS 2021 VS 2028
1.2.2 Access Control System
1.2.3 Video Surveillance
1.2.4 Physical Security Information Management
1.2.5 Perimeter Intrusion Detection & Prevention
1.2.6 Security Scanning, Imaging & Metal Detection
1.2.7 Fire & Life Safety
1.3 Market by Application
1.3.1 Global Physical Security Market Size Growth Rate by Application, 2017 VS 2021 VS 2028
1.3.2 Government, Defense & Public Sector
1.3.3 Transportation & Logistics
1.3.4 Telecom & IT
1.3.5 BFSI
1.3.6 Education
1.3.7 Retail
1.3.8 Oil, Gas & Energy
1.3.9 Hospitality & Residential
1.3.10 Others
1.4 Study Objectives
1.5 Years Considered
2 Global Growth Trends
2.1 Global Physical Security Market Perspective (2017-2028)
2.2 Physical Security Growth Trends by Region
2.2.1 Physical Security Market Size by Region: 2017 VS 2021 VS 2028
2.2.2 Physical Security Historic Market Size by Region (2017-2022)
2.2.3 Physical Security Forecasted Market Size by Region (2023-2028)
2.3 Physical Security Market Dynamics
2.3.1 Physical Security Industry Trends
2.3.2 Physical Security Market Drivers
2.3.3 Physical Security Market Challenges
2.3.4 Physical Security Market Restraints
3 Competition Landscape by Key Players
3.1 Global Top Physical Security Players by Revenue
3.1.1 Global Top Physical Security Players by Revenue (2017-2022)
3.1.2 Global Physical Security Revenue Market Share by Players (2017-2022)
3.2 Global Physical Security Market Share by Company Type (Tier 1, Tier 2, and Tier 3)
3.3 Players Covered: Ranking by Physical Security Revenue
3.4 Global Physical Security Market Concentration Ratio
3.4.1 Global Physical Security Market Concentration Ratio (CR5 and HHI)
3.4.2 Global Top 10 and Top 5 Companies by Physical Security Revenue in 2021
3.5 Physical Security Key Players Head office and Area Served
3.6 Key Players Physical Security Product Solution and Service
3.7 Date of Enter into Physical Security Market
3.8 Mergers & Acquisitions, Expansion Plans
4 Physical Security Breakdown Data by Type
4.1 Global Physical Security Historic Market Size by Type (2017-2022)
4.2 Global Physical Security Forecasted Market Size by Type (2023-2028)
5 Physical Security Breakdown Data by Application
5.1 Global Physical Security Historic Market Size by Application (2017-2022)
5.2 Global Physical Security Forecasted Market Size by Application (2023-2028)
6 North America
6.1 North America Physical Security Market Size (2017-2028)
6.2 North America Physical Security Market Size by Type
6.2.1 North America Physical Security Market Size by Type (2017-2022)
6.2.2 North America Physical Security Market Size by Type (2023-2028)
6.2.3 North America Physical Security Market Share by Type (2017-2028)
6.3 North America Physical Security Market Size by Application
6.3.1 North America Physical Security Market Size by Application (2017-2022)
6.3.2 North America Physical Security Market Size by Application (2023-2028)
6.3.3 North America Physical Security Market Share by Application (2017-2028)
6.4 North America Physical Security Market Size by Country
6.4.1 North America Physical Security Market Size by Country (2017-2022)
6.4.2 North America Physical Security Market Size by Country (2023-2028)
6.4.3 U.S.
6.4.4 Canada
7 Europe
7.1 Europe Physical Security Market Size (2017-2028)
7.2 Europe Physical Security Market Size by Type
7.2.1 Europe Physical Security Market Size by Type (2017-2022)
7.2.2 Europe Physical Security Market Size by Type (2023-2028)
7.2.3 Europe Physical Security Market Share by Type (2017-2028)
7.3 Europe Physical Security Market Size by Application
7.3.1 Europe Physical Security Market Size by Application (2017-2022)
7.3.2 Europe Physical Security Market Size by Application (2023-2028)
7.3.3 Europe Physical Security Market Share by Application (2017-2028)
7.4 Europe Physical Security Market Size by Country
7.4.1 Europe Physical Security Market Size by Country (2017-2022)
7.4.2 Europe Physical Security Market Size by Country (2023-2028)
7.4.3 Germany
7.4.4 France
7.4.5 U.K.
7.4.6 Italy
7.4.7 Russia
7.4.8 Nordic Countries
8 Asia-Pacific
8.1 Asia-Pacific Physical Security Market Size (2017-2028)
8.2 Asia-Pacific Physical Security Market Size by Type
8.2.1 Asia-Pacific Physical Security Market Size by Type (2017-2022)
8.2.2 Asia-Pacific Physical Security Market Size by Type (2023-2028)
8.2.3 Asia-Pacific Physical Security Market Share by Type (2017-2028)
8.3 Asia-Pacific Physical Security Market Size by Application
8.3.1 Asia-Pacific Physical Security Market Size by Application (2017-2022)
8.3.2 Asia-Pacific Physical Security Market Size by Application (2023-2028)
8.3.3 Asia-Pacific Physical Security Market Share by Application (2017-2028)
8.4 Asia-Pacific Physical Security Market Size by Region
8.4.1 Asia-Pacific Physical Security Market Size by Region (2017-2022)
8.4.2 Asia-Pacific Physical Security Market Size by Region (2023-2028)
8.4.3 China
8.4.4 Japan
8.4.5 South Korea
8.4.6 Southeast Asia
8.4.7 India
8.4.8 Australia
9 Latin America
9.1 Latin America Physical Security Market Size (2017-2028)
9.2 Latin America Physical Security Market Size by Type
9.2.1 Latin America Physical Security Market Size by Type (2017-2022)
9.2.2 Latin America Physical Security Market Size by Type (2023-2028)
9.2.3 Latin America Physical Security Market Share by Type (2017-2028)
9.3 Latin America Physical Security Market Size by Application
9.3.1 Latin America Physical Security Market Size by Application (2017-2022)
9.3.2 Latin America Physical Security Market Size by Application (2023-2028)
9.3.3 Latin America Physical Security Market Share by Application (2017-2028)
9.4 Latin America Physical Security Market Size by Country
9.4.1 Latin America Physical Security Market Size by Country (2017-2022)
9.4.2 Latin America Physical Security Market Size by Country (2023-2028)
9.4.3 Mexico
9.4.4 Brazil
10 Middle East & Africa
10.1 Middle East & Africa Physical Security Market Size (2017-2028)
10.2 Middle East & Africa Physical Security Market Size by Type
10.2.1 Middle East & Africa Physical Security Market Size by Type (2017-2022)
10.2.2 Middle East & Africa Physical Security Market Size by Type (2023-2028)
10.2.3 Middle East & Africa Physical Security Market Share by Type (2017-2028)
10.3 Middle East & Africa Physical Security Market Size by Application
10.3.1 Middle East & Africa Physical Security Market Size by Application (2017-2022)
10.3.2 Middle East & Africa Physical Security Market Size by Application (2023-2028)
10.3.3 Middle East & Africa Physical Security Market Share by Application (2017-2028)
10.4 Middle East & Africa Physical Security Market Size by Country
10.4.1 Middle East & Africa Physical Security Market Size by Country (2017-2022)
10.4.2 Middle East & Africa Physical Security Market Size by Country (2023-2028)
10.4.3 Turkey
10.4.4 Saudi Arabia
10.4.5 UAE
11 Key Players Profiles
11.1 ADT
11.1.1 ADT Company Details
11.1.2 ADT Business Overview
11.1.3 ADT Physical Security Introduction
11.1.4 ADT Revenue in Physical Security Business (2017-2022)
11.1.5 ADT Recent Developments
11.2 Hangzhou Hikvision Digital Technology
11.2.1 Hangzhou Hikvision Digital Technology Company Details
11.2.2 Hangzhou Hikvision Digital Technology Business Overview
11.2.3 Hangzhou Hikvision Digital Technology Physical Security Introduction
11.2.4 Hangzhou Hikvision Digital Technology Revenue in Physical Security Business (2017-2022)
11.2.5 Hangzhou Hikvision Digital Technology Recent Developments
11.3 SECOM
11.3.1 SECOM Company Details
11.3.2 SECOM Business Overview
11.3.3 SECOM Physical Security Introduction
11.3.4 SECOM Revenue in Physical Security Business (2017-2022)
11.3.5 SECOM Recent Developments
11.4 Johnson Controls (Tyco)
11.4.1 Johnson Controls (Tyco) Company Details
11.4.2 Johnson Controls (Tyco) Business Overview
11.4.3 Johnson Controls (Tyco) Physical Security Introduction
11.4.4 Johnson Controls (Tyco) Revenue in Physical Security Business (2017-2022)
11.4.5 Johnson Controls (Tyco) Recent Developments
11.5 Anixter
11.5.1 Anixter Company Details
11.5.2 Anixter Business Overview
11.5.3 Anixter Physical Security Introduction
11.5.4 Anixter Revenue in Physical Security Business (2017-2022)
11.5.5 Anixter Recent Developments
11.6 Cisco
11.6.1 Cisco Company Details
11.6.2 Cisco Business Overview
11.6.3 Cisco Physical Security Introduction
11.6.4 Cisco Revenue in Physical Security Business (2017-2022)
11.6.5 Cisco Recent Developments
11.7 Genetec
11.7.1 Genetec Company Details
11.7.2 Genetec Business Overview
11.7.3 Genetec Physical Security Introduction
11.7.4 Genetec Revenue in Physical Security Business (2017-2022)
11.7.5 Genetec Recent Developments
11.8 Honeywell
11.8.1 Honeywell Company Details
11.8.2 Honeywell Business Overview
11.8.3 Honeywell Physical Security Introduction
11.8.4 Honeywell Revenue in Physical Security Business (2017-2022)
11.8.5 Honeywell Recent Developments
11.9 Bosch Security
11.9.1 Bosch Security Company Details
11.9.2 Bosch Security Business Overview
11.9.3 Bosch Security Physical Security Introduction
11.9.4 Bosch Security Revenue in Physical Security Business (2017-2022)
11.9.5 Bosch Security Recent Developments
11.10 Stanley
11.10.1 Stanley Company Details
11.10.2 Stanley Business Overview
11.10.3 Stanley Physical Security Introduction
11.10.4 Stanley Revenue in Physical Security Business (2017-2022)
11.10.5 Stanley Recent Developments
11.11 Senstar
11.11.1 Senstar Company Details
11.11.2 Senstar Business Overview
11.11.3 Senstar Physical Security Introduction
11.11.4 Senstar Revenue in Physical Security Business (2017-2022)
11.11.5 Senstar Recent Developments
12 Analyst's Viewpoints/Conclusions
13 Appendix
13.1 Research Methodology
13.1.1 Methodology/Research Approach
13.1.2 Data Source
13.2 Author Details
13.3 Disclaimer
FEATURED COMPANIES
ADT
Hangzhou Hikvision Digital Technology
Secom
Johnson Controls (Tyco)
Anixter
Cisco
Genetec
Honeywell
BOSCH Security
STANLEY
Senstar
China
India
Tyco
Honeywell INC
List of Tables
Table 1. Global Physical Security Market Size Growth Rate by Type (US$ Million), 2017 VS 2021 VS 2028
Table 2. Key Players of Access Control System
Table 3. Key Players of Video Surveillance
Table 4. Key Players of Physical Security Information Management
Table 5. Key Players of Perimeter Intrusion Detection & Prevention
Table 6. Key Players of Security Scanning, Imaging & Metal Detection
Table 7. Key Players of Fire & Life Safety
Table 8. Global Physical Security Market Size Growth Rate by Application (US$ Million), 2017 VS 2021 VS 2028
Table 9. Global Physical Security Market Size by Region (US$ Million): 2017 VS 2021 VS 2028
Table 10. Global Physical Security Market Size by Region (2017-2022) & (US$ Million)
Table 11. Global Physical Security Market Share by Region (2017-2022)
Table 12. Global Physical Security Forecasted Market Size by Region (2023-2028) & (US$ Million)
Table 13. Global Physical Security Market Share by Region (2023-2028)
Table 14. Physical Security Market Trends
Table 15. Physical Security Market Drivers
Table 16. Physical Security Market Challenges
Table 17. Physical Security Market Restraints
Table 18. Global Physical Security Revenue by Players (2017-2022) & (US$ Million)
Table 19. Global Physical Security Revenue Share by Players (2017-2022)
Table 20. Global Top Physical Security by Company Type (Tier 1, Tier 2, and Tier 3) & (based on the Revenue in Physical Security as of 2021)
Table 21. Ranking of Global Top Physical Security Companies by Revenue (US$ Million) in 2021
Table 22. Global 5 Largest Players Market Share by Physical Security Revenue (CR5 and HHI) & (2017-2022)
Table 23. Key Players Headquarters and Area Served
Table 24. Key Players Physical Security Product Solution and Service
Table 25. Date of Enter into Physical Security Market
Table 26. Mergers & Acquisitions, Expansion Plans
Table 27. Global Physical Security Market Size by Type (2017-2022) & (US$ Million)
Table 28. Global Physical Security Revenue Market Share by Type (2017-2022)
Table 29. Global Physical Security Forecasted Market Size by Type (2023-2028) & (US$ Million)
Table 30. Global Physical Security Revenue Market Share by Type (2023-2028)
Table 31. Global Physical Security Market Size by Application (2017-2022) & (US$ Million)
Table 32. Global Physical Security Revenue Share by Application (2017-2022)
Table 33. Global Physical Security Forecasted Market Size by Application (2023-2028) & (US$ Million)
Table 34. Global Physical Security Revenue Share by Application (2023-2028)
Table 35. North America Physical Security Market Size by Type (2017-2022) & (US$ Million)
Table 36. North America Physical Security Market Size by Type (2023-2028) & (US$ Million)
Table 37. North America Physical Security Market Size by Application (2017-2022) & (US$ Million)
Table 38. North America Physical Security Market Size by Application (2023-2028) & (US$ Million)
Table 39. North America Physical Security Market Size by Country (2017-2022) & (US$ Million)
Table 40. North America Physical Security Market Size by Country (2023-2028) & (US$ Million)
Table 41. Europe Physical Security Market Size by Type (2017-2022) & (US$ Million)
Table 42. Europe Physical Security Market Size by Type (2023-2028) & (US$ Million)
Table 43. Europe Physical Security Market Size by Application (2017-2022) & (US$ Million)
Table 44. Europe Physical Security Market Size by Application (2023-2028) & (US$ Million)
Table 45. Europe Physical Security Market Size by Country (2017-2022) & (US$ Million)
Table 46. Europe Physical Security Market Size by Country (2023-2028) & (US$ Million)
Table 47. Asia Pacific Physical Security Market Size by Type (2017-2022) & (US$ Million)
Table 48. Asia Pacific Physical Security Market Size by Type (2023-2028) & (US$ Million)
Table 49. Asia Pacific Physical Security Market Size by Application (2017-2022) & (US$ Million)
Table 50. Asia Pacific Physical Security Market Size by Application (2023-2028) & (US$ Million)
Table 51. Asia Pacific Physical Security Market Size by Region (2017-2022) & (US$ Million)
Table 52. Asia Pacific Physical Security Market Size by Region (2023-2028) & (US$ Million)
Table 53. Latin America Physical Security Market Size by Type (2017-2022) & (US$ Million)
Table 54. Latin America Physical Security Market Size by Type (2023-2028) & (US$ Million)
Table 55. Latin America Physical Security Market Size by Application (2017-2022) & (US$ Million)
Table 56. Latin America Physical Security Market Size by Application (2023-2028) & (US$ Million)
Table 57. Latin America Physical Security Market Size by Country (2017-2022) & (US$ Million)
Table 58. Latin America Physical Security Market Size by Country (2023-2028) & (US$ Million)
Table 59. Middle East and Africa Physical Security Market Size by Type (2017-2022) & (US$ Million)
Table 60. Middle East and Africa Physical Security Market Size by Type (2023-2028) & (US$ Million)
Table 61. Middle East and Africa Physical Security Market Size by Application (2017-2022) & (US$ Million)
Table 62. Middle East and Africa Physical Security Market Size by Application (2023-2028) & (US$ Million)
Table 63. Middle East and Africa Physical Security Market Size by Country (2017-2022) & (US$ Million)
Table 64. Middle East and Africa Physical Security Market Size by Country (2023-2028) & (US$ Million)
Table 65. ADT Company Details
Table 66. ADT Business Overview
Table 67. ADT Physical Security Product
Table 68. ADT Revenue in Physical Security Business (2017-2022) & (US$ Million)
Table 69. ADT Recent Developments
Table 70. Hangzhou Hikvision Digital Technology Company Details
Table 71. Hangzhou Hikvision Digital Technology Business Overview
Table 72. Hangzhou Hikvision Digital Technology Physical Security Product
Table 73. Hangzhou Hikvision Digital Technology Revenue in Physical Security Business (2017-2022) & (US$ Million)
Table 74. Hangzhou Hikvision Digital Technology Recent Developments
Table 75. SECOM Company Details
Table 76. SECOM Business Overview
Table 77. SECOM Physical Security Product
Table 78. SECOM Revenue in Physical Security Business (2017-2022) & (US$ Million)
Table 79. SECOM Recent Developments
Table 80. Johnson Controls (Tyco) Company Details
Table 81. Johnson Controls (Tyco) Business Overview
Table 82. Johnson Controls (Tyco) Physical Security Product
Table 83. Johnson Controls (Tyco) Revenue in Physical Security Business (2017-2022) & (US$ Million)
Table 84. Johnson Controls (Tyco) Recent Developments
Table 85. Anixter Company Details
Table 86. Anixter Business Overview
Table 87. Anixter Physical Security Product
Table 88. Anixter Revenue in Physical Security Business (2017-2022) & (US$ Million)
Table 89. Anixter Recent Developments
Table 90. Cisco Company Details
Table 91. Cisco Business Overview
Table 92. Cisco Physical Security Product
Table 93. Cisco Revenue in Physical Security Business (2017-2022) & (US$ Million)
Table 94. Cisco Recent Developments
Table 95. Genetec Company Details
Table 96. Genetec Business Overview
Table 97. Genetec Physical Security Product
Table 98. Genetec Revenue in Physical Security Business (2017-2022) & (US$ Million)
Table 99. Genetec Recent Developments
Table 100. Honeywell Company Details
Table 101. Honeywell Business Overview
Table 102. Honeywell Physical Security Product
Table 103. Honeywell Revenue in Physical Security Business (2017-2022) & (US$ Million)
Table 104. Honeywell Recent Developments
Table 105. Bosch Security Company Details
Table 106. Bosch Security Business Overview
Table 107. Bosch Security Physical Security Product
Table 108. Bosch Security Revenue in Physical Security Business (2017-2022) & (US$ Million)
Table 109. Bosch Security Recent Developments
Table 110. Stanley Company Details
Table 111. Stanley Business Overview
Table 112. Stanley Physical Security Product
Table 113. Stanley Revenue in Physical Security Business (2017-2022) & (US$ Million)
Table 114. Stanley Recent Developments
Table 115. Senstar Company Details
Table 116. Senstar Business Overview
Table 117. Senstar Physical Security Product
Table 118. Senstar Revenue in Physical Security Business (2017-2022) & (US$ Million)
Table 119. Senstar Recent Developments
Table 120. Research Programs/Design for This Report
Table 121. Key Data Information from Secondary Sources
Table 122. Key Data Information from Primary Sources
List of Figures
Figure 1. Global Physical Security Market Share by Type: 2021 VS 2028
Figure 2. Access Control System Features
Figure 3. Video Surveillance Features
Figure 4. Physical Security Information Management Features
Figure 5. Perimeter Intrusion Detection & Prevention Features
Figure 6. Security Scanning, Imaging & Metal Detection Features
Figure 7. Fire & Life Safety Features
Figure 8. Global Physical Security Market Share by Application: 2021 VS 2028
Figure 9. Government, Defense & Public Sector Case Studies
Figure 10. Transportation & Logistics Case Studies
Figure 11. Telecom & IT Case Studies
Figure 12. BFSI Case Studies
Figure 13. Education Case Studies
Figure 14. Retail Case Studies
Figure 15. Oil, Gas & Energy Case Studies
Figure 16. Hospitality & Residential Case Studies
Figure 17. Others Case Studies
Figure 18. Physical Security Report Years Considered
Figure 19. Global Physical Security Market Size (US$ Million), Year-over-Year: 2017-2028
Figure 20. Global Physical Security Market Size, (US$ Million), 2017 VS 2021 VS 2028
Figure 21. Global Physical Security Market Share by Region: 2021 VS 2028
Figure 22. Global Physical Security Market Share by Players in 2021
Figure 23. Global Top Physical Security Players by Company Type (Tier 1, Tier 2, and Tier 3) & (based on the Revenue in Physical Security as of 2021)
Figure 24. The Top 10 and 5 Players Market Share by Physical Security Revenue in 2021
Figure 25. North America Physical Security Market Size YoY (2017-2028) & (US$ Million)
Figure 26. North America Physical Security Market Size Market Share by Type (2017-2028)
Figure 27. North America Physical Security Market Size Market Share by Application (2017-2028)
Figure 28. North America Physical Security Market Size Share by Country (2017-2028)
Figure 29. United States Physical Security Market Size YoY Growth (2017-2028) & (US$ Million)
Figure 30. Canada Physical Security Market Size YoY Growth (2017-2028) & (US$ Million)
Figure 31. Europe Physical Security Market Size YoY (2017-2028) & (US$ Million)
Figure 32. Europe Physical Security Market Size Market Share by Type (2017-2028)
Figure 33. Europe Physical Security Market Size Market Share by Application (2017-2028)
Figure 34. Europe Physical Security Market Size Share by Country (2017-2028)
Figure 35. Germany Physical Security Market Size YoY Growth (2017-2028) & (US$ Million)
Figure 36. France Physical Security Market Size YoY Growth (2017-2028) & (US$ Million)
Figure 37. U.K. Physical Security Market Size YoY Growth (2017-2028) & (US$ Million)
Figure 38. Italy Physical Security Market Size YoY Growth (2017-2028) & (US$ Million)
Figure 39. Russia Physical Security Market Size YoY Growth (2017-2028) & (US$ Million)
Figure 40. Nordic Countries Physical Security Market Size YoY Growth (2017-2028) & (US$ Million)
Figure 41. Asia-Pacific Physical Security Market Size YoY (2017-2028) & (US$ Million)
Figure 42. Asia Pacific Physical Security Market Size Market Share by Type (2017-2028)
Figure 43. Asia Pacific Physical Security Market Size Market Share by Application (2017-2028)
Figure 44. Asia Pacific Physical Security Market Size Share by Region (2017-2028)
Figure 45. China Physical Security Market Size YoY Growth (2017-2028) & (US$ Million)
Figure 46. Japan Physical Security Market Size YoY Growth (2017-2028) & (US$ Million)
Figure 47. South Korea Physical Security Market Size YoY Growth (2017-2028) & (US$ Million)
Figure 48. Southeast Asia Physical Security Market Size YoY Growth (2017-2028) & (US$ Million)
Figure 49. India Physical Security Market Size YoY Growth (2017-2028) & (US$ Million)
Figure 50. Australia Physical Security Market Size YoY Growth (2017-2028) & (US$ Million)
List of Figures
Figure 51. Latin America Physical Security Market Size YoY (2017-2028) & (US$ Million)
Figure 52. Latin America Physical Security Market Size Market Share by Type (2017-2028)
Figure 53. Latin America Physical Security Market Size Market Share by Application (2017-2028)
Figure 54. Latin America Physical Security Market Size Share by Country (2017-2028)
Figure 55. Mexico Physical Security Market Size YoY Growth (2017-2028) & (US$ Million)
Figure 56. Brazil Physical Security Market Size YoY Growth (2017-2028) & (US$ Million)
Figure 57. Middle East & Africa Physical Security Market Size YoY (2017-2028) & (US$ Million)
Figure 58. Middle East and Africa Physical Security Market Size Market Share by Type (2017-2028)
Figure 59. Middle East and Africa Physical Security Market Size Market Share by Application (2017-2028)
Figure 60. Middle East and Africa Physical Security Market Size Share by Country (2017-2028)
Figure 61. Turkey Physical Security Market Size YoY Growth (2017-2028) & (US$ Million)
Figure 62. Saudi Arabia Physical Security Market Size YoY Growth (2017-2028) & (US$ Million)
Figure 63. UAE Physical Security Market Size YoY Growth (2017-2028) & (US$ Million)
Figure 64. ADT Revenue Growth Rate in Physical Security Business (2017-2022)
Figure 65. Hangzhou Hikvision Digital Technology Revenue Growth Rate in Physical Security Business (2017-2022)
Figure 66. SECOM Revenue Growth Rate in Physical Security Business (2017-2022)
Figure 67. Johnson Controls (Tyco) Revenue Growth Rate in Physical Security Business (2017-2022)
Figure 68. Anixter Revenue Growth Rate in Physical Security Business (2017-2022)
Figure 69. Cisco Revenue Growth Rate in Physical Security Business (2017-2022)
Figure 70. Genetec Revenue Growth Rate in Physical Security Business (2017-2022)
Figure 71. Honeywell Revenue Growth Rate in Physical Security Business (2017-2022)
Figure 72. Bosch Security Revenue Growth Rate in Physical Security Business (2017-2022)
Figure 73. Stanley Revenue Growth Rate in Physical Security Business (2017-2022)
Figure 74. Senstar Revenue Growth Rate in Physical Security Business (2017-2022)
Figure 75. Bottom-up and Top-down Approaches for This Report
Figure 76. Data Triangulation
Figure 77. Key Executives Interviewed

