
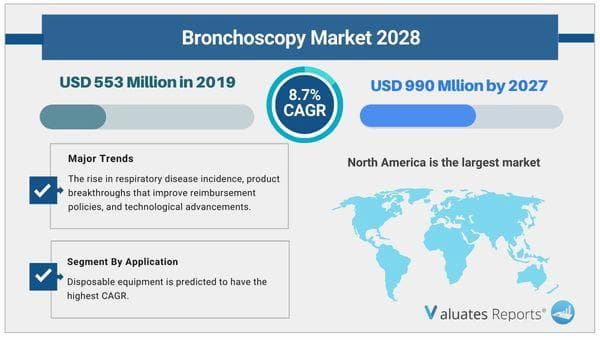
Due to the COVID-19 pandemic, the global bronchoscopy market size is estimated to be worth 553 million USD in 2021 and is forecast to a readjusted size of 990 million USD by 2028 with a CAGR of 8.7% (2022-2028) during the review period. Due to reasons such as the rise in the prevalence of respiratory diseases, new products that enhance reimbursement procedures, and technical improvements, the bronchoscopy market will keep growing.
As a result, there might be a greater demand for minimally invasive operations, which would drive the bronchoscope market's growth.
Lung cancer, asthma, COPD, and emphysema are among the respiratory illnesses that are more prevalent globally. In the entire world, asthma and chronic obstructive pulmonary disease are the most prevalent respiratory disorders (COPD). According to the WHO, COPD is predicted to be the third biggest health concern in the world by 2030. Some of the main causes of COPD are chronic asthma, prolonged tobacco use, indoor and outdoor air pollution, occupational gases, and dust. The prevalence of hazardous occupational, environmental, and behavioral inhalation exposures is a major factor in why chronic respiratory diseases are among the non-communicable diseases that are most common worldwide. The bronchoscopy market is anticipated to increase as a result of these causes.
The increasing number of elderly people worldwide is one of the major factors contributing to the rising prevalence of respiratory illnesses. According to the CDC, one in seven older persons has a lung condition. Due to a rise in life expectancy, the elderly population has increased dramatically over time. Bronchoscopy is still essential for diagnosing and staging patients with central airway obstruction and early central airway malignancy. As a result, it is projected that as these chronic respiratory illnesses become more common, bronchoscope demand will rise. As a result, the bronchoscopy market will expand.
The appeal of minimally invasive medical procedures is another reason fueling the expansion of the bronchoscopy industry, particularly in industrialized nations. Over the coming years, the need for minimally invasive procedures is anticipated to rise, which will benefit the bronchoscope market. Quick recovery, fewer surgical complications, successful post-surgical pain management, and shorter hospital stays are all advantages of minimally invasive procedures.
By usability during the anticipated period, disposable equipment is predicted to have the highest CAGR in the bronchoscopy market. The risk of infection associated with the use of reusable equipment has drawn attention to disposable equipment and is the main factor fueling market growth in this segment, especially given the rising demand for minimally invasive techniques in light of the threat of multidrug antibiotic resistance. The segment's highest CAGR can be attributed to this risk of infection.
The significant market share of North America can be attributed to the rising incidence and prevalence of chronic respiratory diseases, the favorable reimbursement environment in the US, the rising incidence of lung cancer in Canada, the quick rise in healthcare spending, the ease of access to cutting-edge technologies, and the dominance of market players in the region.
Chapter Outline
Chapter 1: Introduces the report scope of the report, executive summary of different market segments (by Type, and by Application, etc), including the market size of each market segment, future development potential, and so on. It offers a high-level view of the current state of the market and its likely evolution in the short to mid-term, and long term.
Chapter 2: Sales (consumption), revenue of Bronchoscopy in global, regional level and country level. It provides a quantitative analysis of the market size and development potential of each region and its main countries and introduces the market development, future development prospects, market space, and capacity of each country in the world.
Chapter 3: Detailed analysis of Bronchoscopy manufacturers competitive landscape, price, sales, revenue, market share and industry ranking, latest development plan, merger, and acquisition information, etc.
Chapter 4: Provides the analysis of various market segments by Type, covering the sales, revenue, average price, and development potential of each market segment, to help readers find the blue ocean market in different market segments.
Chapter 5: Provides the analysis of various market segments by Application, covering the sales, revenue, average price, and development potential of each market segment, to help readers find the blue ocean market in different downstream markets.
Chapter 6: North America by Type, by Application and by country, sales and revenue for each segment.
Chapter 7: Europe by Type, by Application and by country, sales and revenue for each segment.
Chapter 8: Asia Pacific by Type, by Application and by country, sales and revenue for each segment.
Chapter 9: Latin America by Type, by Application and by country, sales and revenue for each segment.
Chapter 10: Middle East and Africa by Type, by Application and by country, sales and revenue for each segment.
Chapter 11: Provides profiles of key manufacturers, introducing the basic situation of the main companies in the market in detail, including product descriptions and specifications, Bronchoscopy sales, revenue, price, gross margin, and recent development, etc.
Chapter 12: Analysis of industrial chain, sales channel, key raw materials, distributors and customers.
Chapter 13: Introduces the market dynamics, latest developments of the market, the driving factors and restrictive factors of the market, the challenges and risks faced by manufacturers in the industry, and the analysis of relevant policies in the industry.
Chapter 14: The main points and conclusions of the report.
|
Report Metric |
Details |
|
Report Name |
Bronchoscopy Market |
|
The market size in 2021 |
USD 553 Million |
|
The revenue forecast in 2028 |
USD 990 Million |
|
Growth Rate |
Compound Annual Growth Rate (CAGR) of 8.7% from 2022 to 2028 |
|
Market size available for years |
2022-2028 |
|
Forecast units |
Value (USD) |
|
Segments covered |
By Type, Application, and Region |
|
Report coverage |
Revenue & volume forecast, company share, competitive landscape, growth factors, and trends |
|
Geographic regions covered |
North America, Europe, Asia Pacific, Latin America, Middle East & Africa |
Ans. The global bronchoscopy market size is estimated to be worth 553 million USD in 2021 and is forecast to a readjusted size of 990 million USD by 2028 with a CAGR of 8.7% (2022-2028) during the review period.
Ans. The global bronchoscopy market size is expected to grow at a compound annual growth rate of 8.7% from 2022 to 2028.
Ans. The global major global players, including Olympus, HOYA, Fujifilm, Richard Wolf, SonoScape, Aohua, Ambu, Boston Scientific, and Karl Storz, etc.
Tables & Figures :
Table 1. Global Bronchoscopy Market Size Growth Rate by Type, 2017 VS 2021 VS 2028 (US$ Million) 1
Table 2. Major Manufacturers of Reusable Bronchoscopy 3
Table 3. Global Bronchoscopy Market Size Growth Rate by Application, 2017 VS 2021 VS 2028 (US$ Million) 7
Table 4. Global Bronchoscopy Revenue by Region: 2017 VS 2021 VS 2028 (US$ Million) 14
Table 5. Global Bronchoscopy Sales by Region (2017-2022) & (MT) 15
Table 6. Global Bronchoscopy Sales Market Share by Region (2017-2022) 15
Table 7. Global Bronchoscopy Sales by Region (2023-2028) & (MT) 16
Table 8. Global Bronchoscopy Sales Market Share by Region (2023-2028) 16
Table 9. Global Bronchoscopy Revenue by Region (2017-2022) & (US$ Million) 17
Table 10. Global Bronchoscopy Revenue Market Share by Region (2017-2022) 17
Table 11. Global Bronchoscopy Revenue by Region (2023-2028) & (US$ Million) 18
Table 12. Global Bronchoscopy Revenue Market Share by Region (2023-2028) 18
Table 13. Global Bronchoscopy Sales by Manufacturers (2017-2022) & (MT) 24
Table 14. Global Bronchoscopy Sales Share by Manufacturers (2017-2022) 26
Table 15. Global Bronchoscopy Revenue by Manufacturers (2017-2022) & (US$ Million) 28
Table 16. Global Bronchoscopy Revenue Market Share by Manufacturers (2017-2022) 30
Table 17. Bronchoscopy Price by Manufacturers (2017-2022) & (US$/Kg) 33
Table 18. Global Bronchoscopy Manufacturers Market Concentration Ratio (CR5 and HHI) 35
Table 19. Global Bronchoscopy by Company Type (Tier 1, Tier 2, and Tier 3) & (based on the Revenue in Bronchoscopy as of 2021) 35
Table 20. Bronchoscopy Manufacturing Base Distribution and Headquarters 37
Table 21. Manufacturers Bronchoscopy Product Offered 39
Table 22. Date of Manufacturers Enter into Bronchoscopy Market 41
Table 23. Mergers & Acquisitions, Expansion Plans 42
Table 24. Global Bronchoscopy Sales by Type (2017-2022) & (MT) 44
Table 25. Global Bronchoscopy Sales by Type (2023-2028) & (MT) 44
Table 26. Global Bronchoscopy Sales Share by Type (2017-2022) 45
Table 27. Global Bronchoscopy Sales Share by Type (2023-2028) 45
Table 28. Global Bronchoscopy Revenue by Type (2017-2022) & (US$ Million) 46
Table 29. Global Bronchoscopy Revenue by Type (2023-2028) & (US$ Million) 47
Table 30. Global Bronchoscopy Revenue Share by Type (2017-2022) 47
Table 31. Global Bronchoscopy Revenue Share by Type (2023-2028) 47
Table 32. Bronchoscopy Price by Type (2017-2022) & (US$/Kg) 48
Table 33. Global Bronchoscopy Price Forecast by Type (2023-2028) & (US$/Kg) 49
Table 34. Global Bronchoscopy Sales by Application (2017-2022) & (MT) 50
Table 35. Global Bronchoscopy Sales by Application (2023-2028) & (MT) 50
Table 36. Global Bronchoscopy Sales Share by Application (2017-2022) 51
Table 37. Global Bronchoscopy Sales Share by Application (2023-2028) 51
Table 38. Global Bronchoscopy Revenue by Application (2017-2022) & (US$ Million) 52
Table 39. Global Bronchoscopy Revenue by Application (2023-2028) & (US$ Million) 53
Table 40. Global Bronchoscopy Revenue Share by Application (2017-2022) 53
Table 41. Global Bronchoscopy Revenue Share by Application (2023-2028) 54
Table 42. Bronchoscopy Price by Application (2017-2022) & (US$/Kg) 54
Table 43. Global Bronchoscopy Price Forecast by Application (2023-2028) & (US$/Kg) 55
Table 44. North America Bronchoscopy Sales by Type (2017-2022) & (MT) 56
Table 45. North America Bronchoscopy Sales by Type (2023-2028) & (MT) 56
Table 46. North America Bronchoscopy Revenue by Type (2017-2022) & (US$ Million) 57
Table 47. North America Bronchoscopy Revenue by Type (2023-2028) & (US$ Million) 57
Table 48. North America Bronchoscopy Sales by Application (2017-2022) & (MT) 58
Table 49. North America Bronchoscopy Sales by Application (2023-2028) & (MT) 59
Table 50. North America Bronchoscopy Revenue by Application (2017-2022) & (US$ Million) 60
Table 51. North America Bronchoscopy Revenue by Application (2023-2028) & (US$ Million) 60
Table 52. North America Bronchoscopy Sales by Country (2017-2022) & (MT) 61
Table 53. North America Bronchoscopy Sales by Country (2023-2028) & (MT) 61
Table 54. North America Bronchoscopy Revenue by Country (2017-2022) & (US$ Million) 62
Table 55. North America Bronchoscopy Revenue by Country (2023-2028) & (US$ Million) 62
Table 56. Europe Bronchoscopy Sales by Type (2017-2022) & (MT) 65
Table 57. Europe Bronchoscopy Sales by Type (2023-2028) & (MT) 65
Table 58. Europe Bronchoscopy Revenue by Type (2017-2022) & (US$ Million) 66
Table 59. Europe Bronchoscopy Revenue by Type (2023-2028) & (US$ Million) 66
Table 60. Europe Bronchoscopy Sales by Application (2017-2022) & (MT) 67
Table 61. Europe Bronchoscopy Sales by Application (2023-2028) & (MT) 68
Table 62. Europe Bronchoscopy Revenue by Application (2017-2022) & (US$ Million) 69
Table 63. Europe Bronchoscopy Revenue by Application (2023-2028) & (US$ Million) 69
Table 64. Europe Bronchoscopy Sales by Country (2017-2022) & (MT) 70
Table 65. Europe Bronchoscopy Sales by Country (2023-2028) & (MT) 71
Table 66. Europe Bronchoscopy Revenue by Country (2017-2022) & (US$ Million) 71
Table 67. Europe Bronchoscopy Revenue by Country (2023-2028) & (US$ Million) 72
Table 68. Asia Pacific Bronchoscopy Sales by Type (2017-2022) & (MT) 76
Table 69. Asia Pacific Bronchoscopy Sales by Type (2023-2028) & (MT) 76
Table 70. Asia Pacific Bronchoscopy Revenue by Type (2017-2022) & (US$ Million) 77
Table 71. Asia Pacific Bronchoscopy Revenue by Type (2023-2028) & (US$ Million) 77
Table 72. Asia Pacific Bronchoscopy Sales by Application (2017-2022) & (MT) 78
Table 73. Asia Pacific Bronchoscopy Sales by Application (2023-2028) & (MT) 79
Table 74. Asia Pacific Bronchoscopy Revenue by Application (2017-2022) & (US$ Million) 80
Table 75. Asia Pacific Bronchoscopy Revenue by Application (2023-2028) & (US$ Million) 80
Table 76. Asia Pacific Bronchoscopy Sales by Region (2017-2022) & (MT) 81
Table 77. Asia Pacific Bronchoscopy Sales by Region (2023-2028) & (MT) 82
Table 78. Asia Pacific Bronchoscopy Revenue by Region (2017-2022) & (US$ Million) 82
Table 79. Asia Pacific Bronchoscopy Revenue by Region (2023-2028) & (US$ Million) 83
Table 80. Latin America Bronchoscopy Sales by Type (2017-2022) & (MT) 88
Table 81. Latin America Bronchoscopy Sales by Type (2023-2028) & (MT) 88
Table 82. Latin America Bronchoscopy Revenue by Type (2017-2022) & (US$ Million) 89
Table 83. Latin America Bronchoscopy Revenue by Type (2023-2028) & (US$ Million) 89
Table 84. Latin America Bronchoscopy Sales by Application (2017-2022) & (MT) 90
Table 85. Latin America Bronchoscopy Sales by Application (2023-2028) & (MT) 91
Table 86. Latin America Bronchoscopy Revenue by Application (2017-2022) & (US$ Million) 92
Table 87. Latin America Bronchoscopy Revenue by Application (2023-2028) & (US$ Million) 92
Table 88. Latin America Bronchoscopy Sales by Country (2017-2022) & (MT) 93
Table 89. Latin America Bronchoscopy Sales by Country (2023-2028) & (MT) 93
Table 90. Latin America Bronchoscopy Revenue by Country (2017-2022) & (US$ Million) 94
Table 91. Latin America Bronchoscopy Revenue by Country (2023-2028) & (US$ Million) 95
Table 92. Middle East and Africa Bronchoscopy Sales by Type (2017-2022) & (MT) 98
Table 93. Middle East and Africa Bronchoscopy Sales by Type (2023-2028) & (MT) 98
Table 94. Middle East and Africa Bronchoscopy Revenue by Type (2017-2022) & (US$ Million) 99
Table 95. Middle East and Africa Bronchoscopy Revenue by Type (2023-2028) & (US$ Million) 100
Table 96. Middle East and Africa Bronchoscopy Sales by Application (2017-2022) & (MT) 101
Table 97. Middle East and Africa Bronchoscopy Sales by Application (2023-2028) & (MT) 101
Table 98. Middle East and Africa Bronchoscopy Revenue by Application (2017-2022) & (US$ Million) 102
Table 99. Middle East and Africa Bronchoscopy Revenue by Application (2023-2028) & (US$ Million) 103
Table 100. Middle East and Africa Bronchoscopy Sales by Country (2017-2022) & (MT) 104
Table 101. Middle East and Africa Bronchoscopy Sales by Country (2023-2028) & (MT) 104
Table 102. Middle East and Africa Bronchoscopy Revenue by Country (2017-2022) & (US$ Million) 105
Table 103. Middle East and Africa Bronchoscopy Revenue by Country (2023-2028) & (US$ Million) 105
Table 104. Olympus Corporation Information 109
Table 105. Olympus Description and Major Businesses 109
Table 106. Olympus Bronchoscopy Sales (MT), Revenue (US$ Million), Price (US$/Kg) and Gross Margin (2017-2022) 110
Table 107. Olympus Bronchoscopy Product Model Numbers, Pictures, Descriptions and Specifications 110
Table 108. Olympus Recent Developments 110
Table 109. HOYA Corporation Information 111
Table 110. HOYA Description and Major Businesses 111
Table 111. HOYA Bronchoscopy Sales (MT), Revenue (US$ Million), Price (US$/Kg) and Gross Margin (2017-2022) 111
Table 112. HOYA Bronchoscopy Product Model Numbers, Pictures, Descriptions and Specifications 112
Table 113. HOYA Recent Developments 112
Table 114. Fujifilm Corporation Information 112
Table 115. Fujifilm Description and Major Businesses 113
Table 116. Fujifilm Bronchoscopy Sales (MT), Revenue (US$ Million), Price (US$/Kg) and Gross Margin (2017-2022) 113
Table 117. Fujifilm Bronchoscopy Product Model Numbers, Pictures, Descriptions and Specifications 113
Table 118. Fujifilm Recent Developments 114
Table 119. Richard Wolf Corporation Information 114
Table 120. Richard Wolf Description and Major Businesses 114
Table 121. Richard Wolf Bronchoscopy Sales (MT), Revenue (US$ Million), Price (US$/Kg) and Gross Margin (2017-2022) 115
Table 122. Richard Wolf Bronchoscopy Product Model Numbers, Pictures, Descriptions and Specifications 115
Table 123. Richard Wolf Recent Developments 115
Table 124. SonoScape Corporation Information 116
Table 125. SonoScape Description and Major Businesses 116
Table 126. SonoScape Bronchoscopy Sales (MT), Revenue (US$ Million), Price (US$/Kg) and Gross Margin (2017-2022) 116
Table 127. SonoScape Bronchoscopy Product Model Numbers, Pictures, Descriptions and Specifications 117
Table 128. SonoScape Recent Developments 117
Table 129. Aohua Corporation Information 117
Table 130. Aohua Description and Major Businesses 118
Table 131. Aohua Bronchoscopy Sales (MT), Revenue (US$ Million), Price (US$/Kg) and Gross Margin (2017-2022) 118
Table 132. Aohua Bronchoscopy Product Model Numbers, Pictures, Descriptions and Specifications 119
Table 133. Aohua Recent Developments 119
Table 134. Ambu Corporation Information 119
Table 135. Ambu Description and Major Businesses 120
Table 136. Ambu Bronchoscopy Sales (MT), Revenue (US$ Million), Price (US$/Kg) and Gross Margin (2017-2022) 120
Table 137. Ambu Bronchoscopy Product Model Numbers, Pictures, Descriptions and Specifications 120
Table 138. Ambu Recent Developments 121
Table 139. Boston Scientific Corporation Information 121
Table 140. Boston Scientific Description and Major Businesses 121
Table 141. Boston Scientific Bronchoscopy Sales (MT), Revenue (US$ Million), Price (US$/Kg) and Gross Margin (2017-2022) 122
Table 142. Boston Scientific Bronchoscopy Product Model Numbers, Pictures, Descriptions and Specifications 122
Table 143. Boston Scientific Recent Developments 122
Table 144. Karl Storz Corporation Information 123
Table 145. Karl Storz Description and Major Businesses 123
Table 146. Karl Storz Bronchoscopy Sales (MT), Revenue (US$ Million), Price (US$/Kg) and Gross Margin (2017-2022) 123
Table 147. Karl Storz Bronchoscopy Product Model Numbers, Pictures, Descriptions and Specifications 124
Table 148. Karl Storz Recent Developments 124
Table 149. Verathon Corporation Information 124
Table 150. Verathon Description and Major Businesses 125
Table 151. Verathon Bronchoscopy Sales (MT), Revenue (US$ Million), Price (US$/Kg) and Gross Margin (2017-2022) 125
Table 152. Verathon Bronchoscopy Product Model Numbers, Pictures, Descriptions and Specifications 125
Table 153. Verathon Recent Developments 126
Table 154. The Surgical Company Corporation Information 126
Table 155. The Surgical Company Description and Major Businesses 126
Table 156. The Surgical Company Bronchoscopy Sales (MT), Revenue (US$ Million), Price (US$/Kg) and Gross Margin (2017-2022) 127
Table 157. The Surgical Company Bronchoscopy Product Model Numbers, Pictures, Descriptions and Specifications 127
Table 158. The Surgical Company Recent Developments 127
Table 159. Key Raw Materials Lists 178
Table 160. Raw Materials Key Suppliers Lists 179
Table 161. Bronchoscopy Distributors List 180
Table 162. Bronchoscopy Customers List 181
Table 163. Bronchoscopy Market Trends 182
Table 164. Bronchoscopy Market Drivers 182
Table 165. Bronchoscopy Market Challenges 183
Table 166. Bronchoscopy Market Restraints 183
Table 167. Research Programs/Design for This Report 185
Table 168. Key Data Information from Secondary Sources 188
Table 169. Key Data Information from Primary Sources 189
List of FIGUREs
Figure 1. Bronchoscopy Product Picture 1
Figure 2. Global Bronchoscopy Market Size Growth Rate by Type, 2017 VS 2021 VS 2028 (US$ Million) 2
Figure 3. Global Bronchoscopy Market Share by Type: 2021 & 2028 2
Figure 4. Disposable Bronchoscopy Product Picture 3
Figure 5. Major Manufacturers of Disposable Bronchoscopy 3
Figure 6. Reusable Bronchoscopy Product Picture 3
Figure 7. Global Bronchoscopy Market Size Growth Rate by Application, 2017 VS 2021 VS 2028 (US$ Million) 7
Figure 8. Global Bronchoscopy Market Share by Application: 2021 & 2028 8
Figure 9. Hospital & Clinic 8
Figure 10. Diagnostic Center 8
Figure 11. Others 9
Figure 12. Bronchoscopy Report Years Considered 11
Figure 13. Global Bronchoscopy Sales 2017-2028 (MT) 12
Figure 14. Global Bronchoscopy Revenue, (US$ Million), 2017 VS 2021 VS 2028 13
Figure 15. Global Bronchoscopy Revenue 2017-2028 (US$ Million) 13
Figure 16. Global Bronchoscopy Revenue Market Share by Region in Percentage: 2021 Versus 2028 14
Figure 17. Global Bronchoscopy Sales Market Share by Region (2017-2022) 16
Figure 18. Global Bronchoscopy Sales Market Share by Region (2023-2028) 17
Figure 19. North America Bronchoscopy Sales YoY (2017-2028) & (MT) 19
Figure 20. North America Bronchoscopy Revenue YoY (2017-2028) & (US$ Million) 19
Figure 21. Europe Bronchoscopy Sales YoY (2017-2028) & (MT) 20
Figure 22. Europe Bronchoscopy Revenue YoY (2017-2028) & (US$ Million) 20
Figure 23. Asia-Pacific Bronchoscopy Sales YoY (2017-2028) & (MT) 21
Figure 24. Asia-Pacific Bronchoscopy Revenue YoY (2017-2028) & (US$ Million) 21
Figure 25. Latin America Bronchoscopy Sales YoY (2017-2028) & (MT) 22
Figure 26. Latin America Bronchoscopy Revenue YoY (2017-2028) & (US$ Million) 22
Figure 27. Middle East & Africa Bronchoscopy Sales YoY (2017-2028) & (MT) 23
Figure 28. Middle East & Africa Bronchoscopy Revenue YoY (2017-2028) & (US$ Million) 23
Figure 29. The Bronchoscopy Market Share of Top 10 and Top 5 Largest Manufacturers Around the World in 2021 28
Figure 30. The Top 5 and 10 Largest Manufacturers of Bronchoscopy in the World: Market Share by Bronchoscopy Revenue in 2021 32
Figure 31. Global Bronchoscopy Market Share by Company Type (Tier 1, Tier 2, and Tier 3): 2017 VS 2021 37
Figure 32. Global Bronchoscopy Sales Market Share by Type (2017-2028) 46
Figure 33. Global Bronchoscopy Revenue Market Share by Type (2017-2028) 48
Figure 34. Global Bronchoscopy Sales Market Share by Application (2017-2028) 52
Figure 35. Global Bronchoscopy Revenue Market Share by Application (2017-2028) 54
Figure 36. North America Bronchoscopy Sales Market Share by Type (2017-2028) 57
Figure 37. North America Bronchoscopy Revenue Market Share by Type (2017-2028) 58
Figure 38. North America Bronchoscopy Sales Market Share by Application (2017-2028) 59
Figure 39. North America Bronchoscopy Revenue Market Share by Application (2017-2028) 61
Figure 40. North America Bronchoscopy Sales Share by Country (2017-2028) 62
Figure 41. North America Bronchoscopy Revenue Share by Country (2017-2028) 62
Figure 42. United States Bronchoscopy Revenue (2017-2028) & (US$ Million) 63
Figure 43. Canada Bronchoscopy Revenue (2017-2028) & (US$ Million) 63
Figure 44. Mexico Bronchoscopy Revenue (2017-2028) & (US$ Million) 64
Figure 45. Europe Bronchoscopy Sales Market Share by Type (2017-2028) 66
Figure 46. Europe Bronchoscopy Revenue Market Share by Type (2017-2028) 67
Figure 47. Europe Bronchoscopy Sales Market Share by Application (2017-2028) 68
Figure 48. Europe Bronchoscopy Revenue Market Share by Application (2017-2028) 70
Figure 49. Europe Bronchoscopy Sales Share by Country (2017-2028) 71
Figure 50. Europe Bronchoscopy Revenue Share by Country (2017-2028) 72
Figure 51. Germany Bronchoscopy Revenue (2017-2028) & (US$ Million) 73
Figure 52. France Bronchoscopy Revenue (2017-2028) & (US$ Million) 73
Figure 53. U.K. Bronchoscopy Revenue (2017-2028) & (US$ Million) 74
Figure 54. Italy Bronchoscopy Revenue (2017-2028) & (US$ Million) 74
Figure 55. Russia Bronchoscopy Revenue (2017-2028) & (US$ Million) 75
Figure 56. Asia Pacific Bronchoscopy Sales Market Share by Type (2017-2028) 77
Figure 57. Asia Pacific Bronchoscopy Revenue Market Share by Type (2017-2028) 78
Figure 58. Asia Pacific Bronchoscopy Sales Market Share by Application (2017-2028) 79
Figure 59. Asia Pacific Bronchoscopy Revenue Market Share by Application (2017-2028) 81
Figure 60. Asia Pacific Bronchoscopy Sales Share by Region (2017-2028) 82
Figure 61. Asia Pacific Bronchoscopy Revenue Share by Region (2017-2028) 84
Figure 62. China Bronchoscopy Revenue (2017-2028) & (US$ Million) 84
Figure 63. Japan Bronchoscopy Revenue (2017-2028) & (US$ Million) 85
Figure 64. South Korea Bronchoscopy Revenue (2017-2028) & (US$ Million) 85
Figure 65. India Bronchoscopy Revenue (2017-2028) & (US$ Million) 86
Figure 66. Australia Bronchoscopy Revenue (2017-2028) & (US$ Million) 86
Figure 67. Southeast Asia Bronchoscopy Revenue (2017-2028) & (US$ Million) 87
Figure 68. Latin America Bronchoscopy Sales Market Share by Type (2017-2028) 89
Figure 69. Latin America Bronchoscopy Revenue Market Share by Type (2017-2028) 90
Figure 70. Latin America Bronchoscopy Sales Market Share by Application (2017-2028) 91
Figure 71. Latin America Bronchoscopy Revenue Market Share by Application (2017-2028) 93
Figure 72. Latin America Bronchoscopy Sales Share by Country (2017-2028) 94
Figure 73. Latin America Bronchoscopy Revenue Share by Country (2017-2028) 95
Figure 74. Brazil Bronchoscopy Revenue (2017-2028) & (US$ Million) 96
Figure 75. Middle East and Africa Bronchoscopy Sales Market Share by Type (2017-2028) 99
Figure 76. Middle East and Africa Bronchoscopy Revenue Market Share by Type (2017-2028) 100
Figure 77. Middle East and Africa Bronchoscopy Sales Market Share by Application (2017-2028) 102
Figure 78. Middle East and Africa Bronchoscopy Revenue Market Share by Application (2017-2028) 103
Figure 79. Middle East and Africa Bronchoscopy Sales Share by Country (2017-2028) 105
Figure 80. Middle East and Africa Bronchoscopy Revenue Share by Country (2017-2028) 106
Figure 81. Middle East Bronchoscopy Revenue (2017-2028) & (US$ Million) 107
Figure 82. Africa Bronchoscopy Revenue (2017-2028) & (US$ Million) 107
Figure 83. Bronchoscopy Value Chain 178
Figure 84. Bronchoscopy Production Process 179
Figure 85. Channels of Distribution (Direct Vs Distribution) 180
Figure 86. Distributors Profiles 181
Figure 87. Bottom-up and Top-down Approaches for This Report 187
Figure 88. Data Triangulation 188
Figure 89. Key Executives Interviewed 190
$4900
$7350
$9800
HAVE A QUERY?
OUR CUSTOMER

SIMILAR REPORTS