Table of Contents
1 Electric Car Market Overview
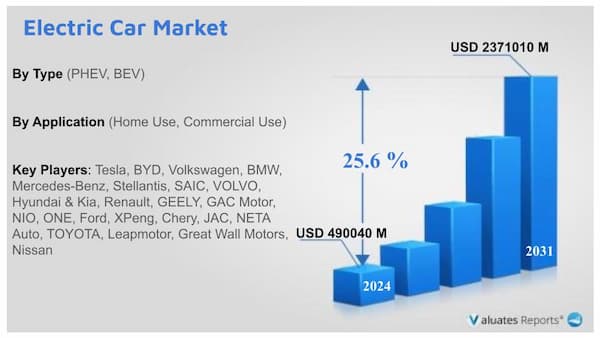
1.1 Product Definition
1.2 Electric Car by Type
1.2.1 Global Electric Car Market Value Growth Rate Analysis by Type: 2024 VS 2031
1.2.2 PHEV
1.2.3 BEV
1.3 Electric Car by Application
1.3.1 Global Electric Car Market Value Growth Rate Analysis by Application: 2024 VS 2031
1.3.2 Home Use
1.3.3 Commercial Use
1.4 Global Market Growth Prospects
1.4.1 Global Electric Car Production Value Estimates and Forecasts (2020-2031)
1.4.2 Global Electric Car Production Capacity Estimates and Forecasts (2020-2031)
1.4.3 Global Electric Car Production Estimates and Forecasts (2020-2031)
1.4.4 Global Electric Car Market Average Price Estimates and Forecasts (2020-2031)
1.5 Assumptions and Limitations
2 Market Competition by Manufacturers
2.1 Global Electric Car Production Market Share by Manufacturers (2020-2025)
2.2 Global Electric Car Production Value Market Share by Manufacturers (2020-2025)
2.3 Global Key Players of Electric Car, Industry Ranking, 2023 VS 2024
2.4 Global Electric Car Market Share by Company Type (Tier 1, Tier 2, and Tier 3)
2.5 Global Electric Car Average Price by Manufacturers (2020-2025)
2.6 Global Key Manufacturers of Electric Car, Manufacturing Base Distribution and Headquarters
2.7 Global Key Manufacturers of Electric Car, Product Offered and Application
2.8 Global Key Manufacturers of Electric Car, Date of Enter into This Industry
2.9 Electric Car Market Competitive Situation and Trends
2.9.1 Electric Car Market Concentration Rate
2.9.2 Global 5 and 10 Largest Electric Car Players Market Share by Revenue
2.10 Mergers & Acquisitions, Expansion
3 Electric Car Production by Region
3.1 Global Electric Car Production Value Estimates and Forecasts by Region: 2020 VS 2024 VS 2031
3.2 Global Electric Car Production Value by Region (2020-2031)
3.2.1 Global Electric Car Production Value by Region (2020-2025)
3.2.2 Global Forecasted Production Value of Electric Car by Region (2026-2031)
3.3 Global Electric Car Production Estimates and Forecasts by Region: 2020 VS 2024 VS 2031
3.4 Global Electric Car Production Volume by Region (2020-2031)
3.4.1 Global Electric Car Production by Region (2020-2025)
3.4.2 Global Forecasted Production of Electric Car by Region (2026-2031)
3.5 Global Electric Car Market Price Analysis by Region (2020-2025)
3.6 Global Electric Car Production and Value, Year-over-Year Growth
3.6.1 North America Electric Car Production Value Estimates and Forecasts (2020-2031)
3.6.2 Europe Electric Car Production Value Estimates and Forecasts (2020-2031)
3.6.3 China Electric Car Production Value Estimates and Forecasts (2020-2031)
3.6.4 Japan Electric Car Production Value Estimates and Forecasts (2020-2031)
3.6.5 South Korea Electric Car Production Value Estimates and Forecasts (2020-2031)
3.6.6 India Electric Car Production Value Estimates and Forecasts (2020-2031)
4 Electric Car Consumption by Region
4.1 Global Electric Car Consumption Estimates and Forecasts by Region: 2020 VS 2024 VS 2031
4.2 Global Electric Car Consumption by Region (2020-2031)
4.2.1 Global Electric Car Consumption by Region (2020-2025)
4.2.2 Global Electric Car Forecasted Consumption by Region (2026-2031)
4.3 North America
4.3.1 North America Electric Car Consumption Growth Rate by Country: 2020 VS 2024 VS 2031
4.3.2 North America Electric Car Consumption by Country (2020-2031)
4.3.3 U.S.
4.3.4 Canada
4.4 Europe
4.4.1 Europe Electric Car Consumption Growth Rate by Country: 2020 VS 2024 VS 2031
4.4.2 Europe Electric Car Consumption by Country (2020-2031)
4.4.3 Germany
4.4.4 France
4.4.5 U.K.
4.4.6 Italy
4.4.7 Netherlands
4.5 Asia Pacific
4.5.1 Asia Pacific Electric Car Consumption Growth Rate by Region: 2020 VS 2024 VS 2031
4.5.2 Asia Pacific Electric Car Consumption by Region (2020-2031)
4.5.3 China
4.5.4 Japan
4.5.5 South Korea
4.5.6 China Taiwan
4.5.7 Southeast Asia
4.5.8 India
4.6 Latin America, Middle East & Africa
4.6.1 Latin America, Middle East & Africa Electric Car Consumption Growth Rate by Country: 2020 VS 2024 VS 2031
4.6.2 Latin America, Middle East & Africa Electric Car Consumption by Country (2020-2031)
4.6.3 Mexico
4.6.4 Brazil
4.6.5 Turkey
4.6.6 GCC Countries
5 Segment by Type
5.1 Global Electric Car Production by Type (2020-2031)
5.1.1 Global Electric Car Production by Type (2020-2025)
5.1.2 Global Electric Car Production by Type (2026-2031)
5.1.3 Global Electric Car Production Market Share by Type (2020-2031)
5.2 Global Electric Car Production Value by Type (2020-2031)
5.2.1 Global Electric Car Production Value by Type (2020-2025)
5.2.2 Global Electric Car Production Value by Type (2026-2031)
5.2.3 Global Electric Car Production Value Market Share by Type (2020-2031)
5.3 Global Electric Car Price by Type (2020-2031)
6 Segment by Application
6.1 Global Electric Car Production by Application (2020-2031)
6.1.1 Global Electric Car Production by Application (2020-2025)
6.1.2 Global Electric Car Production by Application (2026-2031)
6.1.3 Global Electric Car Production Market Share by Application (2020-2031)
6.2 Global Electric Car Production Value by Application (2020-2031)
6.2.1 Global Electric Car Production Value by Application (2020-2025)
6.2.2 Global Electric Car Production Value by Application (2026-2031)
6.2.3 Global Electric Car Production Value Market Share by Application (2020-2031)
6.3 Global Electric Car Price by Application (2020-2031)
7 Key Companies Profiled
7.1 Tesla
7.1.1 Tesla Electric Car Company Information
7.1.2 Tesla Electric Car Product Portfolio
7.1.3 Tesla Electric Car Production, Value, Price and Gross Margin (2020-2025)
7.1.4 Tesla Main Business and Markets Served
7.1.5 Tesla Recent Developments/Updates
7.2 BYD
7.2.1 BYD Electric Car Company Information
7.2.2 BYD Electric Car Product Portfolio
7.2.3 BYD Electric Car Production, Value, Price and Gross Margin (2020-2025)
7.2.4 BYD Main Business and Markets Served
7.2.5 BYD Recent Developments/Updates
7.3 Volkswagen
7.3.1 Volkswagen Electric Car Company Information
7.3.2 Volkswagen Electric Car Product Portfolio
7.3.3 Volkswagen Electric Car Production, Value, Price and Gross Margin (2020-2025)
7.3.4 Volkswagen Main Business and Markets Served
7.3.5 Volkswagen Recent Developments/Updates
7.4 BMW
7.4.1 BMW Electric Car Company Information
7.4.2 BMW Electric Car Product Portfolio
7.4.3 BMW Electric Car Production, Value, Price and Gross Margin (2020-2025)
7.4.4 BMW Main Business and Markets Served
7.4.5 BMW Recent Developments/Updates
7.5 Mercedes-Benz
7.5.1 Mercedes-Benz Electric Car Company Information
7.5.2 Mercedes-Benz Electric Car Product Portfolio
7.5.3 Mercedes-Benz Electric Car Production, Value, Price and Gross Margin (2020-2025)
7.5.4 Mercedes-Benz Main Business and Markets Served
7.5.5 Mercedes-Benz Recent Developments/Updates
7.6 Stellantis
7.6.1 Stellantis Electric Car Company Information
7.6.2 Stellantis Electric Car Product Portfolio
7.6.3 Stellantis Electric Car Production, Value, Price and Gross Margin (2020-2025)
7.6.4 Stellantis Main Business and Markets Served
7.6.5 Stellantis Recent Developments/Updates
7.7 SAIC
7.7.1 SAIC Electric Car Company Information
7.7.2 SAIC Electric Car Product Portfolio
7.7.3 SAIC Electric Car Production, Value, Price and Gross Margin (2020-2025)
7.7.4 SAIC Main Business and Markets Served
7.7.5 SAIC Recent Developments/Updates
7.8 VOLVO
7.8.1 VOLVO Electric Car Company Information
7.8.2 VOLVO Electric Car Product Portfolio
7.8.3 VOLVO Electric Car Production, Value, Price and Gross Margin (2020-2025)
7.8.4 VOLVO Main Business and Markets Served
7.8.5 VOLVO Recent Developments/Updates
7.9 Hyundai & Kia
7.9.1 Hyundai & Kia Electric Car Company Information
7.9.2 Hyundai & Kia Electric Car Product Portfolio
7.9.3 Hyundai & Kia Electric Car Production, Value, Price and Gross Margin (2020-2025)
7.9.4 Hyundai & Kia Main Business and Markets Served
7.9.5 Hyundai & Kia Recent Developments/Updates
7.10 Renault
7.10.1 Renault Electric Car Company Information
7.10.2 Renault Electric Car Product Portfolio
7.10.3 Renault Electric Car Production, Value, Price and Gross Margin (2020-2025)
7.10.4 Renault Main Business and Markets Served
7.10.5 Renault Recent Developments/Updates
7.11 GEELY
7.11.1 GEELY Electric Car Company Information
7.11.2 GEELY Electric Car Product Portfolio
7.11.3 GEELY Electric Car Production, Value, Price and Gross Margin (2020-2025)
7.11.4 GEELY Main Business and Markets Served
7.11.5 GEELY Recent Developments/Updates
7.12 GAC Motor
7.12.1 GAC Motor Electric Car Company Information
7.12.2 GAC Motor Electric Car Product Portfolio
7.12.3 GAC Motor Electric Car Production, Value, Price and Gross Margin (2020-2025)
7.12.4 GAC Motor Main Business and Markets Served
7.12.5 GAC Motor Recent Developments/Updates
7.13 NIO
7.13.1 NIO Electric Car Company Information
7.13.2 NIO Electric Car Product Portfolio
7.13.3 NIO Electric Car Production, Value, Price and Gross Margin (2020-2025)
7.13.4 NIO Main Business and Markets Served
7.13.5 NIO Recent Developments/Updates
7.14 ONE
7.14.1 ONE Electric Car Company Information
7.14.2 ONE Electric Car Product Portfolio
7.14.3 ONE Electric Car Production, Value, Price and Gross Margin (2020-2025)
7.14.4 ONE Main Business and Markets Served
7.14.5 ONE Recent Developments/Updates
7.15 Ford
7.15.1 Ford Electric Car Company Information
7.15.2 Ford Electric Car Product Portfolio
7.15.3 Ford Electric Car Production, Value, Price and Gross Margin (2020-2025)
7.15.4 Ford Main Business and Markets Served
7.15.5 Ford Recent Developments/Updates
7.16 XPeng
7.16.1 XPeng Electric Car Company Information
7.16.2 XPeng Electric Car Product Portfolio
7.16.3 XPeng Electric Car Production, Value, Price and Gross Margin (2020-2025)
7.16.4 XPeng Main Business and Markets Served
7.16.5 XPeng Recent Developments/Updates
7.17 Chery
7.17.1 Chery Electric Car Company Information
7.17.2 Chery Electric Car Product Portfolio
7.17.3 Chery Electric Car Production, Value, Price and Gross Margin (2020-2025)
7.17.4 Chery Main Business and Markets Served
7.17.5 Chery Recent Developments/Updates
7.18 JAC
7.18.1 JAC Electric Car Company Information
7.18.2 JAC Electric Car Product Portfolio
7.18.3 JAC Electric Car Production, Value, Price and Gross Margin (2020-2025)
7.18.4 JAC Main Business and Markets Served
7.18.5 JAC Recent Developments/Updates
7.19 NETA Auto
7.19.1 NETA Auto Electric Car Company Information
7.19.2 NETA Auto Electric Car Product Portfolio
7.19.3 NETA Auto Electric Car Production, Value, Price and Gross Margin (2020-2025)
7.19.4 NETA Auto Main Business and Markets Served
7.19.5 NETA Auto Recent Developments/Updates
7.20 TOYOTA
7.20.1 TOYOTA Electric Car Company Information
7.20.2 TOYOTA Electric Car Product Portfolio
7.20.3 TOYOTA Electric Car Production, Value, Price and Gross Margin (2020-2025)
7.20.4 TOYOTA Main Business and Markets Served
7.20.5 TOYOTA Recent Developments/Updates
7.21 Leapmotor
7.21.1 Leapmotor Electric Car Company Information
7.21.2 Leapmotor Electric Car Product Portfolio
7.21.3 Leapmotor Electric Car Production, Value, Price and Gross Margin (2020-2025)
7.21.4 Leapmotor Main Business and Markets Served
7.21.5 Leapmotor Recent Developments/Updates
7.22 Great Wall Motors
7.22.1 Great Wall Motors Electric Car Company Information
7.22.2 Great Wall Motors Electric Car Product Portfolio
7.22.3 Great Wall Motors Electric Car Production, Value, Price and Gross Margin (2020-2025)
7.22.4 Great Wall Motors Main Business and Markets Served
7.22.5 Great Wall Motors Recent Developments/Updates
7.23 Nissan
7.23.1 Nissan Electric Car Company Information
7.23.2 Nissan Electric Car Product Portfolio
7.23.3 Nissan Electric Car Production, Value, Price and Gross Margin (2020-2025)
7.23.4 Nissan Main Business and Markets Served
7.23.5 Nissan Recent Developments/Updates
8 Industry Chain and Sales Channels Analysis
8.1 Electric Car Industry Chain Analysis
8.2 Electric Car Raw Material Supply Analysis
8.2.1 Key Raw Materials
8.2.2 Raw Materials Key Suppliers
8.3 Electric Car Production Mode & Process Analysis
8.4 Electric Car Sales and Marketing
8.4.1 Electric Car Sales Channels
8.4.2 Electric Car Distributors
8.5 Electric Car Customer Analysis
9 Electric Car Market Dynamics
9.1 Electric Car Industry Trends
9.2 Electric Car Market Drivers
9.3 Electric Car Market Challenges
9.4 Electric Car Market Restraints
10 Research Findings and Conclusion
11 Methodology and Data Source
11.1 Methodology/Research Approach
11.1.1 Research Programs/Design
11.1.2 Market Size Estimation
11.1.3 Market Breakdown and Data Triangulation
11.2 Data Source
11.2.1 Secondary Sources
11.2.2 Primary Sources
11.3 Author List
11.4 Disclaimer
FEATURED COMPANIES
BYD
Geely
BAIC
Tesla
Renault-Nissan
BMW
GM
VW
Toyota
SAIC
Zotye
Daimler
Chery
JMCG
Changan
JAC
Hyundai
Mitsubishi
Yutong
Ford
Table of Figures
List of Tables
Table 1. Global Electric Car Market Value by Type, (US$ Million) & (2024 VS 2031)
Table 2. Global Electric Car Market Value by Application, (US$ Million) & (2024 VS 2031)
Table 3. Global Electric Car Production Capacity (K Units) by Manufacturers in 2024
Table 4. Global Electric Car Production by Manufacturers (2020-2025) & (K Units)
Table 5. Global Electric Car Production Market Share by Manufacturers (2020-2025)
Table 6. Global Electric Car Production Value by Manufacturers (2020-2025) & (US$ Million)
Table 7. Global Electric Car Production Value Share by Manufacturers (2020-2025)
Table 8. Global Key Players of Electric Car, Industry Ranking, 2023 VS 2024
Table 9. Company Type (Tier 1, Tier 2, and Tier 3) & (based on the Production Value in Electric Car as of 2024)
Table 10. Global Market Electric Car Average Price by Manufacturers (USD/Unit) & (2020-2025)
Table 11. Global Key Manufacturers of Electric Car, Manufacturing Base Distribution and Headquarters
Table 12. Global Key Manufacturers of Electric Car, Product Offered and Application
Table 13. Global Key Manufacturers of Electric Car, Date of Enter into This Industry
Table 14. Global Electric Car Manufacturers Market Concentration Ratio (CR5 and HHI)
Table 15. Mergers & Acquisitions, Expansion Plans
Table 16. Global Electric Car Production Value by Region: 2020 VS 2024 VS 2031 (US$ Million)
Table 17. Global Electric Car Production Value (US$ Million) by Region (2020-2025)
Table 18. Global Electric Car Production Value Market Share by Region (2020-2025)
Table 19. Global Electric Car Production Value (US$ Million) Forecast by Region (2026-2031)
Table 20. Global Electric Car Production Value Market Share Forecast by Region (2026-2031)
Table 21. Global Electric Car Production Comparison by Region: 2020 VS 2024 VS 2031 (K Units)
Table 22. Global Electric Car Production (K Units) by Region (2020-2025)
Table 23. Global Electric Car Production Market Share by Region (2020-2025)
Table 24. Global Electric Car Production (K Units) Forecast by Region (2026-2031)
Table 25. Global Electric Car Production Market Share Forecast by Region (2026-2031)
Table 26. Global Electric Car Market Average Price (USD/Unit) by Region (2020-2025)
Table 27. Global Electric Car Market Average Price (USD/Unit) by Region (2026-2031)
Table 28. Global Electric Car Consumption Growth Rate by Region: 2020 VS 2024 VS 2031 (K Units)
Table 29. Global Electric Car Consumption by Region (2020-2025) & (K Units)
Table 30. Global Electric Car Consumption Market Share by Region (2020-2025)
Table 31. Global Electric Car Forecasted Consumption by Region (2026-2031) & (K Units)
Table 32. Global Electric Car Forecasted Consumption Market Share by Region (2026-2031)
Table 33. North America Electric Car Consumption Growth Rate by Country: 2020 VS 2024 VS 2031 (K Units)
Table 34. North America Electric Car Consumption by Country (2020-2025) & (K Units)
Table 35. North America Electric Car Consumption by Country (2026-2031) & (K Units)
Table 36. Europe Electric Car Consumption Growth Rate by Country: 2020 VS 2024 VS 2031 (K Units)
Table 37. Europe Electric Car Consumption by Country (2020-2025) & (K Units)
Table 38. Europe Electric Car Consumption by Country (2026-2031) & (K Units)
Table 39. Asia Pacific Electric Car Consumption Growth Rate by Region: 2020 VS 2024 VS 2031 (K Units)
Table 40. Asia Pacific Electric Car Consumption by Region (2020-2025) & (K Units)
Table 41. Asia Pacific Electric Car Consumption by Region (2026-2031) & (K Units)
Table 42. Latin America, Middle East & Africa Electric Car Consumption Growth Rate by Country: 2020 VS 2024 VS 2031 (K Units)
Table 43. Latin America, Middle East & Africa Electric Car Consumption by Country (2020-2025) & (K Units)
Table 44. Latin America, Middle East & Africa Electric Car Consumption by Country (2026-2031) & (K Units)
Table 45. Global Electric Car Production (K Units) by Type (2020-2025)
Table 46. Global Electric Car Production (K Units) by Type (2026-2031)
Table 47. Global Electric Car Production Market Share by Type (2020-2025)
Table 48. Global Electric Car Production Market Share by Type (2026-2031)
Table 49. Global Electric Car Production Value (US$ Million) by Type (2020-2025)
Table 50. Global Electric Car Production Value (US$ Million) by Type (2026-2031)
Table 51. Global Electric Car Production Value Market Share by Type (2020-2025)
Table 52. Global Electric Car Production Value Market Share by Type (2026-2031)
Table 53. Global Electric Car Price (USD/Unit) by Type (2020-2025)
Table 54. Global Electric Car Price (USD/Unit) by Type (2026-2031)
Table 55. Global Electric Car Production (K Units) by Application (2020-2025)
Table 56. Global Electric Car Production (K Units) by Application (2026-2031)
Table 57. Global Electric Car Production Market Share by Application (2020-2025)
Table 58. Global Electric Car Production Market Share by Application (2026-2031)
Table 59. Global Electric Car Production Value (US$ Million) by Application (2020-2025)
Table 60. Global Electric Car Production Value (US$ Million) by Application (2026-2031)
Table 61. Global Electric Car Production Value Market Share by Application (2020-2025)
Table 62. Global Electric Car Production Value Market Share by Application (2026-2031)
Table 63. Global Electric Car Price (USD/Unit) by Application (2020-2025)
Table 64. Global Electric Car Price (USD/Unit) by Application (2026-2031)
Table 65. Tesla Electric Car Company Information
Table 66. Tesla Electric Car Specification and Application
Table 67. Tesla Electric Car Production (K Units), Value (US$ Million), Price (USD/Unit) and Gross Margin (2020-2025)
Table 68. Tesla Main Business and Markets Served
Table 69. Tesla Recent Developments/Updates
Table 70. BYD Electric Car Company Information
Table 71. BYD Electric Car Specification and Application
Table 72. BYD Electric Car Production (K Units), Value (US$ Million), Price (USD/Unit) and Gross Margin (2020-2025)
Table 73. BYD Main Business and Markets Served
Table 74. BYD Recent Developments/Updates
Table 75. Volkswagen Electric Car Company Information
Table 76. Volkswagen Electric Car Specification and Application
Table 77. Volkswagen Electric Car Production (K Units), Value (US$ Million), Price (USD/Unit) and Gross Margin (2020-2025)
Table 78. Volkswagen Main Business and Markets Served
Table 79. Volkswagen Recent Developments/Updates
Table 80. BMW Electric Car Company Information
Table 81. BMW Electric Car Specification and Application
Table 82. BMW Electric Car Production (K Units), Value (US$ Million), Price (USD/Unit) and Gross Margin (2020-2025)
Table 83. BMW Main Business and Markets Served
Table 84. BMW Recent Developments/Updates
Table 85. Mercedes-Benz Electric Car Company Information
Table 86. Mercedes-Benz Electric Car Specification and Application
Table 87. Mercedes-Benz Electric Car Production (K Units), Value (US$ Million), Price (USD/Unit) and Gross Margin (2020-2025)
Table 88. Mercedes-Benz Main Business and Markets Served
Table 89. Mercedes-Benz Recent Developments/Updates
Table 90. Stellantis Electric Car Company Information
Table 91. Stellantis Electric Car Specification and Application
Table 92. Stellantis Electric Car Production (K Units), Value (US$ Million), Price (USD/Unit) and Gross Margin (2020-2025)
Table 93. Stellantis Main Business and Markets Served
Table 94. Stellantis Recent Developments/Updates
Table 95. SAIC Electric Car Company Information
Table 96. SAIC Electric Car Specification and Application
Table 97. SAIC Electric Car Production (K Units), Value (US$ Million), Price (USD/Unit) and Gross Margin (2020-2025)
Table 98. SAIC Main Business and Markets Served
Table 99. SAIC Recent Developments/Updates
Table 100. VOLVO Electric Car Company Information
Table 101. VOLVO Electric Car Specification and Application
Table 102. VOLVO Electric Car Production (K Units), Value (US$ Million), Price (USD/Unit) and Gross Margin (2020-2025)
Table 103. VOLVO Main Business and Markets Served
Table 104. VOLVO Recent Developments/Updates
Table 105. Hyundai & Kia Electric Car Company Information
Table 106. Hyundai & Kia Electric Car Specification and Application
Table 107. Hyundai & Kia Electric Car Production (K Units), Value (US$ Million), Price (USD/Unit) and Gross Margin (2020-2025)
Table 108. Hyundai & Kia Main Business and Markets Served
Table 109. Hyundai & Kia Recent Developments/Updates
Table 110. Renault Electric Car Company Information
Table 111. Renault Electric Car Specification and Application
Table 112. Renault Electric Car Production (K Units), Value (US$ Million), Price (USD/Unit) and Gross Margin (2020-2025)
Table 113. Renault Main Business and Markets Served
Table 114. Renault Recent Developments/Updates
Table 115. GEELY Electric Car Company Information
Table 116. GEELY Electric Car Specification and Application
Table 117. GEELY Electric Car Production (K Units), Value (US$ Million), Price (USD/Unit) and Gross Margin (2020-2025)
Table 118. GEELY Main Business and Markets Served
Table 119. GEELY Recent Developments/Updates
Table 120. GAC Motor Electric Car Company Information
Table 121. GAC Motor Electric Car Specification and Application
Table 122. GAC Motor Electric Car Production (K Units), Value (US$ Million), Price (USD/Unit) and Gross Margin (2020-2025)
Table 123. GAC Motor Main Business and Markets Served
Table 124. GAC Motor Recent Developments/Updates
Table 125. NIO Electric Car Company Information
Table 126. NIO Electric Car Specification and Application
Table 127. NIO Electric Car Production (K Units), Value (US$ Million), Price (USD/Unit) and Gross Margin (2020-2025)
Table 128. NIO Main Business and Markets Served
Table 129. NIO Recent Developments/Updates
Table 130. ONE Electric Car Company Information
Table 131. ONE Electric Car Specification and Application
Table 132. ONE Electric Car Production (K Units), Value (US$ Million), Price (USD/Unit) and Gross Margin (2020-2025)
Table 133. ONE Main Business and Markets Served
Table 134. ONE Recent Developments/Updates
Table 135. Ford Electric Car Company Information
Table 136. Ford Electric Car Specification and Application
Table 137. Ford Electric Car Production (K Units), Value (US$ Million), Price (USD/Unit) and Gross Margin (2020-2025)
Table 138. Ford Main Business and Markets Served
Table 139. Ford Recent Developments/Updates
Table 140. XPeng Electric Car Company Information
Table 141. XPeng Electric Car Specification and Application
Table 142. XPeng Electric Car Production (K Units), Value (US$ Million), Price (USD/Unit) and Gross Margin (2020-2025)
Table 143. XPeng Main Business and Markets Served
Table 144. XPeng Recent Developments/Updates
Table 145. Chery Electric Car Company Information
Table 146. Chery Electric Car Specification and Application
Table 147. Chery Electric Car Production (K Units), Value (US$ Million), Price (USD/Unit) and Gross Margin (2020-2025)
Table 148. Chery Main Business and Markets Served
Table 149. Chery Recent Developments/Updates
Table 150. JAC Electric Car Company Information
Table 151. JAC Electric Car Specification and Application
Table 152. JAC Electric Car Production (K Units), Value (US$ Million), Price (USD/Unit) and Gross Margin (2020-2025)
Table 153. JAC Main Business and Markets Served
Table 154. JAC Recent Developments/Updates
Table 155. NETA Auto Electric Car Company Information
Table 156. NETA Auto Electric Car Specification and Application
Table 157. NETA Auto Electric Car Production (K Units), Value (US$ Million), Price (USD/Unit) and Gross Margin (2020-2025)
Table 158. NETA Auto Main Business and Markets Served
Table 159. NETA Auto Recent Developments/Updates
Table 160. TOYOTA Electric Car Company Information
Table 161. TOYOTA Electric Car Specification and Application
Table 162. TOYOTA Electric Car Production (K Units), Value (US$ Million), Price (USD/Unit) and Gross Margin (2020-2025)
Table 163. TOYOTA Main Business and Markets Served
Table 164. TOYOTA Recent Developments/Updates
Table 165. Leapmotor Electric Car Company Information
Table 166. Leapmotor Electric Car Specification and Application
Table 167. Leapmotor Electric Car Production (K Units), Value (US$ Million), Price (USD/Unit) and Gross Margin (2020-2025)
Table 168. Leapmotor Main Business and Markets Served
Table 169. Leapmotor Recent Developments/Updates
Table 170. Great Wall Motors Electric Car Company Information
Table 171. Great Wall Motors Electric Car Specification and Application
Table 172. Great Wall Motors Electric Car Production (K Units), Value (US$ Million), Price (USD/Unit) and Gross Margin (2020-2025)
Table 173. Great Wall Motors Main Business and Markets Served
Table 174. Great Wall Motors Recent Developments/Updates
Table 175. Nissan Electric Car Company Information
Table 176. Nissan Electric Car Specification and Application
Table 177. Nissan Electric Car Production (K Units), Value (US$ Million), Price (USD/Unit) and Gross Margin (2020-2025)
Table 178. Nissan Main Business and Markets Served
Table 179. Nissan Recent Developments/Updates
Table 180. Key Raw Materials Lists
Table 181. Raw Materials Key Suppliers Lists
Table 182. Electric Car Distributors List
Table 183. Electric Car Customers List
Table 184. Electric Car Market Trends
Table 185. Electric Car Market Drivers
Table 186. Electric Car Market Challenges
Table 187. Electric Car Market Restraints
Table 188. Research Programs/Design for This Report
Table 189. Key Data Information from Secondary Sources
Table 190. Key Data Information from Primary Sources
Table 191. Authors List of This Report
List of Figures
Figure 1. Product Picture of Electric Car
Figure 2. Global Electric Car Market Value by Type, (US$ Million) & (2020-2031)
Figure 3. Global Electric Car Market Share by Type: 2024 VS 2031
Figure 4. PHEV Product Picture
Figure 5. BEV Product Picture
Figure 6. Global Electric Car Market Value by Application, (US$ Million) & (2020-2031)
Figure 7. Global Electric Car Market Share by Application: 2024 VS 2031
Figure 8. Home Use
Figure 9. Commercial Use
Figure 10. Global Electric Car Production Value (US$ Million), 2020 VS 2024 VS 2031
Figure 11. Global Electric Car Production Value (US$ Million) & (2020-2031)
Figure 12. Global Electric Car Production Capacity (K Units) & (2020-2031)
Figure 13. Global Electric Car Production (K Units) & (2020-2031)
Figure 14. Global Electric Car Average Price (USD/Unit) & (2020-2031)
Figure 15. Electric Car Report Years Considered
Figure 16. Electric Car Production Share by Manufacturers in 2024
Figure 17. Global Electric Car Production Value Share by Manufacturers (2024)
Figure 18. Electric Car Market Share by Company Type (Tier 1, Tier 2, and Tier 3): 2020 VS 2024
Figure 19. The Global 5 and 10 Largest Players: Market Share by Electric Car Revenue in 2024
Figure 20. Global Electric Car Production Value by Region: 2020 VS 2024 VS 2031 (US$ Million)
Figure 21. Global Electric Car Production Value Market Share by Region: 2020 VS 2024 VS 2031
Figure 22. Global Electric Car Production Comparison by Region: 2020 VS 2024 VS 2031 (K Units)
Figure 23. Global Electric Car Production Market Share by Region: 2020 VS 2024 VS 2031
Figure 24. North America Electric Car Production Value (US$ Million) Growth Rate (2020-2031)
Figure 25. Europe Electric Car Production Value (US$ Million) Growth Rate (2020-2031)
Figure 26. China Electric Car Production Value (US$ Million) Growth Rate (2020-2031)
Figure 27. Japan Electric Car Production Value (US$ Million) Growth Rate (2020-2031)
Figure 28. South Korea Electric Car Production Value (US$ Million) Growth Rate (2020-2031)
Figure 29. India Electric Car Production Value (US$ Million) Growth Rate (2020-2031)
Figure 30. Global Electric Car Consumption by Region: 2020 VS 2024 VS 2031 (K Units)
Figure 31. Global Electric Car Consumption Market Share by Region: 2020 VS 2024 VS 2031
Figure 32. North America Electric Car Consumption and Growth Rate (2020-2031) & (K Units)
Figure 33. North America Electric Car Consumption Market Share by Country (2020-2031)
Figure 34. U.S. Electric Car Consumption and Growth Rate (2020-2031) & (K Units)
Figure 35. Canada Electric Car Consumption and Growth Rate (2020-2031) & (K Units)
Figure 36. Europe Electric Car Consumption and Growth Rate (2020-2031) & (K Units)
Figure 37. Europe Electric Car Consumption Market Share by Country (2020-2031)
Figure 38. Germany Electric Car Consumption and Growth Rate (2020-2031) & (K Units)
Figure 39. France Electric Car Consumption and Growth Rate (2020-2031) & (K Units)
Figure 40. U.K. Electric Car Consumption and Growth Rate (2020-2031) & (K Units)
Figure 41. Italy Electric Car Consumption and Growth Rate (2020-2031) & (K Units)
Figure 42. Netherlands Electric Car Consumption and Growth Rate (2020-2031) & (K Units)
Figure 43. Asia Pacific Electric Car Consumption and Growth Rate (2020-2031) & (K Units)
Figure 44. Asia Pacific Electric Car Consumption Market Share by Region (2020-2031)
Figure 45. China Electric Car Consumption and Growth Rate (2020-2031) & (K Units)
Figure 46. Japan Electric Car Consumption and Growth Rate (2020-2031) & (K Units)
Figure 47. South Korea Electric Car Consumption and Growth Rate (2020-2031) & (K Units)
Figure 48. China Taiwan Electric Car Consumption and Growth Rate (2020-2031) & (K Units)
Figure 49. Southeast Asia Electric Car Consumption and Growth Rate (2020-2031) & (K Units)
Figure 50. India Electric Car Consumption and Growth Rate (2020-2031) & (K Units)
Figure 51. Latin America, Middle East & Africa Electric Car Consumption and Growth Rate (2020-2031) & (K Units)
Figure 52. Latin America, Middle East & Africa Electric Car Consumption Market Share by Country (2020-2031)
Figure 53. Mexico Electric Car Consumption and Growth Rate (2020-2031) & (K Units)
Figure 54. Brazil Electric Car Consumption and Growth Rate (2020-2031) & (K Units)
Figure 55. Turkey Electric Car Consumption and Growth Rate (2020-2031) & (K Units)
Figure 56. GCC Countries Electric Car Consumption and Growth Rate (2020-2031) & (K Units)
Figure 57. Global Production Market Share of Electric Car by Type (2020-2031)
Figure 58. Global Production Value Market Share of Electric Car by Type (2020-2031)
Figure 59. Global Electric Car Price (USD/Unit) by Type (2020-2031)
Figure 60. Global Production Market Share of Electric Car by Application (2020-2031)
Figure 61. Global Production Value Market Share of Electric Car by Application (2020-2031)
Figure 62. Global Electric Car Price (USD/Unit) by Application (2020-2031)
Figure 63. Electric Car Value Chain
Figure 64. Channels of Distribution (Direct Vs Distribution)
Figure 65. Bottom-up and Top-down Approaches for This Report
Figure 66. Data Triangulation