
The global Bioinformatics Services market size is projected to reach USD 2967.1 Million by 2027, from USD 1468.2 Million in 2020, at a CAGR of 10.1% during 2021-2027. The growing applications of bioinformatics in various industries, as well as the recent COVID-19 outbreak, are expected to fuel the bioinformatics service market.
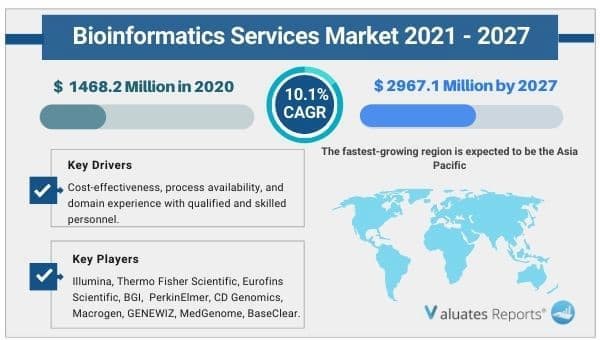
Cost-effectiveness, process availability, and domain experience with qualified and skilled personnel are also expected to drive the bioinformatics market forward.
The global bioinformatics services market is expected to grow as a result of the recent COVID-19 outbreak. One of the major focus areas for each country during the COVID-19 pandemic has been to study and understand how to stop the virus's spread. To develop vaccines and gain a better understanding of the virus's mechanism and how it works in the human body, the genome of the novel coronavirus had to be decoded. As a result, several studies were conducted to better understand the virus's genetic combination, with bioinformatics assisting these studies. In this context, outsourcing of bioinformatics services has increased during the pandemic.
Food, bioremediation, agriculture, forensics, and consumer goods are among the industries that use bioinformatics services to improve the quality of their products and supply chain processes. Bioinformatics services such as data integration, manipulation, lead discovery, data management, in silico analysis, and advanced knowledge discovery are increasingly being used by companies in a variety of industries. This broadening of bioinformatics services' application areas is expected to generate new revenue streams for market participants, resulting in increased adoption of these services and overall market growth for bioinformatics services.
Outsourcing data management and analytics can save pharma companies a lot of money. This factor will accelerate the growth of the bioinformatics market. Furthermore, rising bioinformatics adoption in research centers and laboratories, increased research funding, and pharmaceutical companies' increasing reliance on bioinformatics and high capital investments are all contributing to the growth of the Bioinformatics services market.
Due to falling sequencing costs, the sequencing service is expected to be the most profitable.
The genomics sector is predicted to be the most profitable. The genomics segment is expected to grow as a result of the growing use of pharmacogenomic research for precision medicine development, favorable funding scenarios for genomic research, and partnerships and collaborations between various life sciences and informatics companies for the development of advanced bioinformatics solutions and services.
The fastest-growing region is expected to be the Asia Pacific. The rising prevalence of genetic diseases, the increasing number of bioinformatics-based research studies, and the growing demand for bioinformatics services from a variety of end-users are all contributing to market growth in the Asia Pacific.
|
Report Metric |
Details |
|
Report Name |
Bioinformatics Services Market |
|
Market size value in 2020 |
USD 1468.2 Million |
|
Revenue forecast in 2027 |
USD 2967.1 Million |
|
Growth Rate |
10.1% |
|
Base year considered |
2020 |
|
Forecast Period |
2021-2027 |
|
By Type |
Sequencing Services, Data Analysis, Drug Discovery Services, Differential |
|
By Application |
Chemoinformatics and Drug Design, Genomics, Proteomics, Transcriptomics, Metabolomics |
|
Report Coverage |
Revenue & volume forecast, company share, competitive landscape, growth factors, and trends |
|
Segments Covered |
By Type, Application, and Region |
|
Geographic Regions Covered |
North America, Europe, Asia Pacific, Latin America, Middle East & Africa |
Ans. The global Bioinformatics Services market size is projected to reach US$ 2967.1 million by 2027, from US$ 1468.2 million in 2020, at a CAGR of 10.1% during 2021-2027.
Ans. Some of the major companies are Illumina, Thermo Fisher Scientific, Eurofins Scientific, BGI, PerkinElmer, CD Genomics, Macrogen, GENEWIZ, MedGenome, BaseClear.
Ans. Yes, the report includes a COVID-19 impact analysis. Also, it is further extended into every individual segment of the report.
1 Report Overview
1.1 Study Scope
1.2 Market Analysis by Type
1.2.1 Global Bioinformatics Services Market Size Growth Rate by Type: 2016 VS 2021 VS 2027
1.2.2 Sequencing Services
1.2.3 Data Analysis
1.2.4 Drug Discovery Services
1.2.5 Differential
1.2.6 Others
1.3 Market by Application
1.3.1 Global Bioinformatics Services Market Share by Application: 2016 VS 2021 VS 2027
1.3.2 Genomics
1.3.3 Chemoinformatics and Drug Design
1.3.4 Proteomics
1.3.5 Transcriptomics
1.3.6 Metabolomics
1.3.7 Others
1.4 Study Objectives
1.5 Years Considered
2 Global Growth Trends
2.1 Global Bioinformatics Services Market Perspective (2016-2027)
2.2 Bioinformatics Services Growth Trends by Regions
2.2.1 Bioinformatics Services Market Size by Regions: 2016 VS 2021 VS 2027
2.2.2 Bioinformatics Services Historic Market Share by Regions (2016-2021)
2.2.3 Bioinformatics Services Forecasted Market Size by Regions (2022-2027)
2.3 Bioinformatics Services Industry Dynamic
2.3.1 Bioinformatics Services Market Trends
2.3.2 Bioinformatics Services Market Drivers
2.3.3 Bioinformatics Services Market Challenges
2.3.4 Bioinformatics Services Market Restraints
3 Competition Landscape by Key Players
3.1 Global Top Bioinformatics Services Players by Revenue
3.1.1 Global Top Bioinformatics Services Players by Revenue (2016-2021)
3.1.2 Global Bioinformatics Services Revenue Market Share by Players (2016-2021)
3.2 Global Bioinformatics Services Market Share by Company Type (Tier 1, Tier 2 and Tier 3)
3.3 Players Covered: Ranking by Bioinformatics Services Revenue
3.4 Global Bioinformatics Services Market Concentration Ratio
3.4.1 Global Bioinformatics Services Market Concentration Ratio (CR5 and HHI)
3.4.2 Global Top 10 and Top 5 Companies by Bioinformatics Services Revenue in 2020
3.5 Bioinformatics Services Key Players Head office and Area Served
3.6 Key Players Bioinformatics Services Product Solution and Service
3.7 Date of Enter into Bioinformatics Services Market
3.8 Mergers & Acquisitions, Expansion Plans
4 Bioinformatics Services Breakdown Data by Type
4.1 Global Bioinformatics Services Historic Market Size by Type (2016-2021)
4.2 Global Bioinformatics Services Forecasted Market Size by Type (2022-2027)
5 Bioinformatics Services Breakdown Data by Application
5.1 Global Bioinformatics Services Historic Market Size by Application (2016-2021)
5.2 Global Bioinformatics Services Forecasted Market Size by Application (2022-2027)
6 North America
6.1 North America Bioinformatics Services Market Size (2016-2027)
6.2 North America Bioinformatics Services Market Size by Type
6.2.1 North America Bioinformatics Services Market Size by Type (2016-2021)
6.2.2 North America Bioinformatics Services Market Size by Type (2022-2027)
6.2.3 North America Bioinformatics Services Market Size by Type (2016-2027)
6.3 North America Bioinformatics Services Market Size by Application
6.3.1 North America Bioinformatics Services Market Size by Application (2016-2021)
6.3.2 North America Bioinformatics Services Market Size by Application (2022-2027)
6.3.3 North America Bioinformatics Services Market Size by Application (2016-2027)
6.4 North America Bioinformatics Services Market Size by Country
6.4.1 North America Bioinformatics Services Market Size by Country (2016-2021)
6.4.2 North America Bioinformatics Services Market Size by Country (2022-2027)
6.4.3 United States
6.4.4 Canada
7 Europe
7.1 Europe Bioinformatics Services Market Size (2016-2027)
7.2 Europe Bioinformatics Services Market Size by Type
7.2.1 Europe Bioinformatics Services Market Size by Type (2016-2021)
7.2.2 Europe Bioinformatics Services Market Size by Type (2022-2027)
7.2.3 Europe Bioinformatics Services Market Size by Type (2016-2027)
7.3 Europe Bioinformatics Services Market Size by Application
7.3.1 Europe Bioinformatics Services Market Size by Application (2016-2021)
7.3.2 Europe Bioinformatics Services Market Size by Application (2022-2027)
7.3.3 Europe Bioinformatics Services Market Size by Application (2016-2027)
7.4 Europe Bioinformatics Services Market Size by Country
7.4.1 Europe Bioinformatics Services Market Size by Country (2016-2021)
7.4.2 Europe Bioinformatics Services Market Size by Country (2022-2027)
7.4.3 Germany
7.4.4 France
7.4.5 U.K.
7.4.6 Italy
7.4.7 Russia
7.4.8 Nordic
8 Asia-Pacific
8.1 Asia-Pacific Bioinformatics Services Market Size (2016-2027)
8.2 Asia-Pacific Bioinformatics Services Market Size by Type
8.2.1 Asia-Pacific Bioinformatics Services Market Size by Type (2016-2021)
8.2.2 Asia-Pacific Bioinformatics Services Market Size by Type (2022-2027)
8.2.3 Asia-Pacific Bioinformatics Services Market Size by Type (2016-2027)
8.3 Asia-Pacific Bioinformatics Services Market Size by Application
8.3.1 Asia-Pacific Bioinformatics Services Market Size by Application (2016-2021)
8.3.2 Asia-Pacific Bioinformatics Services Market Size by Application (2022-2027)
8.3.3 Asia-Pacific Bioinformatics Services Market Size by Application (2016-2027)
8.4 Asia-Pacific Bioinformatics Services Market Size by Region
8.4.1 Asia-Pacific Bioinformatics Services Market Size by Region (2016-2021)
8.4.2 Asia-Pacific Bioinformatics Services Market Size by Region (2022-2027)
8.4.3 China
8.4.4 Japan
8.4.5 South Korea
8.4.6 Southeast Asia
8.4.7 India
8.4.8 Australia
9 Latin America
9.1 Latin America Bioinformatics Services Market Size (2016-2027)
9.2 Latin America Bioinformatics Services Market Size by Type
9.2.1 Latin America Bioinformatics Services Market Size by Type (2016-2021)
9.2.2 Latin America Bioinformatics Services Market Size by Type (2022-2027)
9.2.3 Latin America Bioinformatics Services Market Size by Type (2016-2027)
9.3 Latin America Bioinformatics Services Market Size by Application
9.3.1 Latin America Bioinformatics Services Market Size by Application (2016-2021)
9.3.2 Latin America Bioinformatics Services Market Size by Application (2022-2027)
9.3.3 Latin America Bioinformatics Services Market Size by Application (2016-2027)
9.4 Latin America Bioinformatics Services Market Size by Country
9.4.1 Latin America Bioinformatics Services Market Size by Country (2016-2021)
9.4.2 Latin America Bioinformatics Services Market Size by Country (2022-2027)
9.4.3 Mexico
9.4.4 Brazil
10 Middle East & Africa
10.1 Middle East & Africa Bioinformatics Services Market Size (2016-2027)
10.2 Middle East & Africa Bioinformatics Services Market Size by Type
10.2.1 Middle East & Africa Bioinformatics Services Market Size by Type (2016-2021)
10.2.2 Middle East & Africa Bioinformatics Services Market Size by Type (2022-2027)
10.2.3 Middle East & Africa Bioinformatics Services Market Size by Type (2016-2027)
10.3 Middle East & Africa Bioinformatics Services Market Size by Application
10.3.1 Middle East & Africa Bioinformatics Services Market Size by Application (2016-2021)
10.3.2 Middle East & Africa Bioinformatics Services Market Size by Application (2022-2027)
10.3.3 Middle East & Africa Bioinformatics Services Market Size by Application (2016-2027)
10.4 Middle East & Africa Bioinformatics Services Market Size by Country
10.4.1 Middle East & Africa Bioinformatics Services Market Size by Country (2016-2021)
10.4.2 Middle East & Africa Bioinformatics Services Market Size by Country (2022-2027)
10.4.3 Turkey
10.4.4 Saudi Arabia
10.4.5 UAE
11 Key Players Profiles
11.1 Illumina
11.1.1 Illumina Company Details
11.1.2 Illumina Business Overview
11.1.3 Illumina Bioinformatics Services Introduction
11.1.4 Illumina Revenue in Bioinformatics Services Business (2016-2021)
11.1.5 Illumina Recent Development
11.2 Thermo Fisher Scientific
11.2.1 Thermo Fisher Scientific Company Details
11.2.2 Thermo Fisher Scientific Business Overview
11.2.3 Thermo Fisher Scientific Bioinformatics Services Introduction
11.2.4 Thermo Fisher Scientific Revenue in Bioinformatics Services Business (2016-2021)
11.2.5 Thermo Fisher Scientific Recent Development
11.3 Eurofins Scientific
11.3.1 Eurofins Scientific Company Details
11.3.2 Eurofins Scientific Business Overview
11.3.3 Eurofins Scientific Bioinformatics Services Introduction
11.3.4 Eurofins Scientific Revenue in Bioinformatics Services Business (2016-2021)
11.3.5 Eurofins Scientific Recent Development
11.4 BGI
11.4.1 BGI Company Details
11.4.2 BGI Business Overview
11.4.3 BGI Bioinformatics Services Introduction
11.4.4 BGI Revenue in Bioinformatics Services Business (2016-2021)
11.4.5 BGI Recent Development
11.5 NeoGenomics
11.5.1 NeoGenomics Company Details
11.5.2 NeoGenomics Business Overview
11.5.3 NeoGenomics Bioinformatics Services Introduction
11.5.4 NeoGenomics Revenue in Bioinformatics Services Business (2016-2021)
11.5.5 NeoGenomics Recent Development
11.6 PerkinElmer
11.6.1 PerkinElmer Company Details
11.6.2 PerkinElmer Business Overview
11.6.3 PerkinElmer Bioinformatics Services Introduction
11.6.4 PerkinElmer Revenue in Bioinformatics Services Business (2016-2021)
11.6.5 PerkinElmer Recent Development
11.7 CD Genomics
11.7.1 CD Genomics Company Details
11.7.2 CD Genomics Business Overview
11.7.3 CD Genomics Bioinformatics Services Introduction
11.7.4 CD Genomics Revenue in Bioinformatics Services Business (2016-2021)
11.7.5 CD Genomics Recent Development
11.8 Macrogen
11.8.1 Macrogen Company Details
11.8.2 Macrogen Business Overview
11.8.3 Macrogen Bioinformatics Services Introduction
11.8.4 Macrogen Revenue in Bioinformatics Services Business (2016-2021)
11.8.5 Macrogen Recent Development
11.9 QIAGEN
11.9.1 QIAGEN Company Details
11.9.2 QIAGEN Business Overview
11.9.3 QIAGEN Bioinformatics Services Introduction
11.9.4 QIAGEN Revenue in Bioinformatics Services Business (2016-2021)
11.9.5 QIAGEN Recent Development
11.10 GENEWIZ
11.10.1 GENEWIZ Company Details
11.10.2 GENEWIZ Business Overview
11.10.3 GENEWIZ Bioinformatics Services Introduction
11.10.4 GENEWIZ Revenue in Bioinformatics Services Business (2016-2021)
11.10.5 GENEWIZ Recent Development
11.11 Source BioScience
11.11.1 Source BioScience Company Details
11.11.2 Source BioScience Business Overview
11.11.3 Source BioScience Bioinformatics Services Introduction
11.11.4 Source BioScience Revenue in Bioinformatics Services Business (2016-2021)
11.11.5 Source BioScience Recent Development
11.12 Microsynth
11.12.1 Microsynth Company Details
11.12.2 Microsynth Business Overview
11.12.3 Microsynth Bioinformatics Services Introduction
11.12.4 Microsynth Revenue in Bioinformatics Services Business (2016-2021)
11.12.5 Microsynth Recent Development
11.13 MedGenome
11.13.1 MedGenome Company Details
11.13.2 MedGenome Business Overview
11.13.3 MedGenome Bioinformatics Services Introduction
11.13.4 MedGenome Revenue in Bioinformatics Services Business (2016-2021)
11.13.5 MedGenome Recent Development
11.14 Fios Genomics
11.14.1 Fios Genomics Company Details
11.14.2 Fios Genomics Business Overview
11.14.3 Fios Genomics Bioinformatics Services Introduction
11.14.4 Fios Genomics Revenue in Bioinformatics Services Business (2016-2021)
11.14.5 Fios Genomics Recent Development
11.15 BaseClear
11.15.1 BaseClear Company Details
11.15.2 BaseClear Business Overview
11.15.3 BaseClear Bioinformatics Services Introduction
11.15.4 BaseClear Revenue in Bioinformatics Services Business (2016-2021)
11.15.5 BaseClear Recent Development
12 Analyst's Viewpoints/Conclusions
13 Appendix
13.1 Research Methodology
13.1.1 Methodology/Research Approach
13.1.2 Data Source
13.2 Disclaimer
13.3 Author Details
List of Tables
Table 1. Global Bioinformatics Services Market Size Growth Rate by Type (US$ Million):2016 VS 2021 VS 2027
Table 2. Key Players of Sequencing Services
Table 3. Key Players of Data Analysis
Table 4. Key Players of Drug Discovery Services
Table 5. Key Players of Differential
Table 6. Key Players of Others
Table 7. Global Bioinformatics Services Market Size Growth by Application (US$ Million): 2016 VS 2021 VS 2027
Table 8. Global Bioinformatics Services Market Size by Regions (US$ Million): 2016 VS 2021 VS 2027
Table 9. Global Bioinformatics Services Market Size by Regions (2016-2021) & (US$ Million)
Table 10. Global Bioinformatics Services Market Share by Regions (2016-2021)
Table 11. Global Bioinformatics Services Forecasted Market Size by Regions (2022-2027) & (US$ Million)
Table 12. Global Bioinformatics Services Market Share by Regions (2022-2027)
Table 13. Bioinformatics Services Market Trends
Table 14. Bioinformatics Services Market Drivers
Table 15. Bioinformatics Services Market Challenges
Table 16. Bioinformatics Services Market Restraints
Table 17. Global Bioinformatics Services Revenue by Players (2016-2021) & (US$ Million)
Table 18. Global Bioinformatics Services Market Share by Players (2016-2021)
Table 19. Global Top Bioinformatics Services Players by Company Type (Tier 1, Tier 2 and Tier 3) (based on the Revenue in Bioinformatics Services as of 2020)
Table 20. Ranking of Global Top Bioinformatics Services Companies by Revenue (US$ Million) in 2020
Table 21. Global 5 Largest Players Market Share by Bioinformatics Services Revenue (CR5 and HHI) & (2016-2021)
Table 22. Key Players Headquarters and Area Served
Table 23. Key Players Bioinformatics Services Product Solution and Service
Table 24. Date of Enter into Bioinformatics Services Market
Table 25. Mergers & Acquisitions, Expansion Plans
Table 26. Global Bioinformatics Services Market Size by Type (2016-2021) (US$ Million)
Table 27. Global Bioinformatics Services Revenue Market Share by Type (2016-2021)
Table 28. Global Bioinformatics Services Forecasted Market Size by Type (2022-2027) (US$ Million)
Table 29. Global Bioinformatics Services Revenue Market Share by Type (2022-2027) & (US$ Million)
Table 30. Global Bioinformatics Services Market Size Share by Application (2016-2021) & (US$ Million)
Table 31. Global Bioinformatics Services Revenue Market Share by Application (2016-2021)
Table 32. Global Bioinformatics Services Forecasted Market Size by Application (2022-2027) (US$ Million)
Table 33. Global Bioinformatics Services Revenue Market Share by Application (2022-2027) & (US$ Million)
Table 34. North America Bioinformatics Services Market Size by Type (2016-2021) (US$ Million)
Table 35. North America Bioinformatics Services Market Size by Type (2022-2027) & (US$ Million)
Table 36. North America Bioinformatics Services Market Size by Application (2016-2021) (US$ Million)
Table 37. North America Bioinformatics Services Market Size by Application (2022-2027) & (US$ Million)
Table 38. North America Bioinformatics Services Market Size by Country (2016-2021) & (US$ Million)
Table 39. North America Bioinformatics Services Market Size by Country (2022-2027) & (US$ Million)
Table 40. Europe Bioinformatics Services Market Size by Type (2016-2021) (US$ Million)
Table 41. Europe Bioinformatics Services Market Size by Type (2022-2027) & (US$ Million)
Table 42. Europe Bioinformatics Services Market Size by Application (2016-2021) (US$ Million)
Table 43. Europe Bioinformatics Services Market Size by Application (2022-2027) & (US$ Million)
Table 44. Europe Bioinformatics Services Market Size by Country (2016-2021) & (US$ Million)
Table 45. Europe Bioinformatics Services Market Size by Country (2022-2027) & (US$ Million)
Table 46. Asia-Pacific Bioinformatics Services Market Size by Type (2016-2021) (US$ Million)
Table 47. Asia-Pacific Bioinformatics Services Market Size by Type (2022-2027) & (US$ Million)
Table 48. Asia-Pacific Bioinformatics Services Market Size by Application (2016-2021) (US$ Million)
Table 49. Asia-Pacific Bioinformatics Services Market Size by Application (2022-2027) & (US$ Million)
Table 50. Asia-Pacific Bioinformatics Services Market Size by Region (2016-2021) & (US$ Million)
Table 51. Asia-Pacific Bioinformatics Services Market Size by Region (2022-2027) & (US$ Million)
Table 52. Latin America Bioinformatics Services Market Size by Type (2016-2021) (US$ Million)
Table 53. Latin America Bioinformatics Services Market Size by Type (2022-2027) & (US$ Million)
Table 54. Latin America Bioinformatics Services Market Size by Application (2016-2021) (US$ Million)
Table 55. Latin America Bioinformatics Services Market Size by Application (2022-2027) & (US$ Million)
Table 56. Latin America Bioinformatics Services Market Size by Country (2016-2021) & (US$ Million)
Table 57. Latin America Bioinformatics Services Market Size by Country (2022-2027) & (US$ Million)
Table 58. Middle East & Africa Bioinformatics Services Market Size by Type (2016-2021) (US$ Million)
Table 59. Middle East & Africa Bioinformatics Services Market Size by Type (2022-2027) & (US$ Million)
Table 60. Middle East & Africa Bioinformatics Services Market Size by Application (2016-2021) (US$ Million)
Table 61. Middle East & Africa Bioinformatics Services Market Size by Application (2022-2027) & (US$ Million)
Table 62. Middle East & Africa Bioinformatics Services Market Size by Country (2016-2021) & (US$ Million)
Table 63. Middle East & Africa Bioinformatics Services Market Size by Country (2022-2027) & (US$ Million)
Table 64. Illumina Company Details
Table 65. Illumina Business Overview
Table 66. Illumina Bioinformatics Services Product
Table 67. Illumina Revenue in Bioinformatics Services Business (2016-2021) & (US$ Million)
Table 68. Illumina Recent Development
Table 69. Thermo Fisher Scientific Company Details
Table 70. Thermo Fisher Scientific Business Overview
Table 71. Thermo Fisher Scientific Bioinformatics Services Product
Table 72. Thermo Fisher Scientific Revenue in Bioinformatics Services Business (2016-2021) & (US$ Million)
Table 73. Thermo Fisher Scientific Recent Development
Table 74. Eurofins Scientific Company Details
Table 75. Eurofins Scientific Business Overview
Table 76. Eurofins Scientific Bioinformatics Services Product
Table 77. Eurofins Scientific Revenue in Bioinformatics Services Business (2016-2021) & (US$ Million)
Table 78. Eurofins Scientific Recent Development
Table 79. BGI Company Details
Table 80. BGI Business Overview
Table 81. BGI Bioinformatics Services Product
Table 82. BGI Revenue in Bioinformatics Services Business (2016-2021) & (US$ Million)
Table 83. BGI Recent Development
Table 84. NeoGenomics Company Details
Table 85. NeoGenomics Business Overview
Table 86. NeoGenomics Bioinformatics Services Product
Table 87. NeoGenomics Revenue in Bioinformatics Services Business (2016-2021) & (US$ Million)
Table 88. NeoGenomics Recent Development
Table 89. PerkinElmer Company Details
Table 90. PerkinElmer Business Overview
Table 91. PerkinElmer Bioinformatics Services Product
Table 92. PerkinElmer Revenue in Bioinformatics Services Business (2016-2021) & (US$ Million)
Table 93. PerkinElmer Recent Development
Table 94. CD Genomics Company Details
Table 95. CD Genomics Business Overview
Table 96. CD Genomics Bioinformatics Services Product
Table 97. CD Genomics Revenue in Bioinformatics Services Business (2016-2021) & (US$ Million)
Table 98. CD Genomics Recent Development
Table 99. Macrogen Company Details
Table 100. Macrogen Business Overview
Table 101. Macrogen Revenue in Bioinformatics Services Business (2016-2021) & (US$ Million)
Table 102. Macrogen Recent Development
Table 103. QIAGEN Company Details
Table 104. QIAGEN Business Overview
Table 105. QIAGEN Bioinformatics Services Product
Table 106. QIAGEN Revenue in Bioinformatics Services Business (2016-2021) & (US$ Million)
Table 107. QIAGEN Recent Development
Table 108. GENEWIZ Company Details
Table 109. GENEWIZ Business Overview
Table 110. GENEWIZ Bioinformatics Services Product
Table 111. GENEWIZ Revenue in Bioinformatics Services Business (2016-2021) & (US$ Million)
Table 112. GENEWIZ Recent Development
Table 113. Source BioScience Company Details
Table 114. Source BioScience Business Overview
Table 115. Source BioScience Bioinformatics Services Product
Table 116. Source BioScience Revenue in Bioinformatics Services Business (2016-2021) & (US$ Million)
Table 117. Source BioScience Recent Development
Table 118. Microsynth Company Details
Table 119. Microsynth Business Overview
Table 120. Microsynth Bioinformatics Services Product
Table 121. Microsynth Revenue in Bioinformatics Services Business (2016-2021) & (US$ Million)
Table 122. Microsynth Recent Development
Table 123. MedGenome Company Details
Table 124. MedGenome Business Overview
Table 125. MedGenome Bioinformatics Services Product
Table 126. MedGenome Revenue in Bioinformatics Services Business (2016-2021) & (US$ Million)
Table 127. MedGenome Recent Development
Table 128. Fios Genomics Company Details
Table 129. Fios Genomics Business Overview
Table 130. Fios Genomics Bioinformatics Services Product
Table 131. Fios Genomics Revenue in Bioinformatics Services Business (2016-2021) & (US$ Million)
Table 132. Fios Genomics Recent Development
Table 133. BaseClear Company Details
Table 134. BaseClear Business Overview
Table 135. BaseClear Bioinformatics Services Product
Table 136. BaseClear Revenue in Bioinformatics Services Business (2016-2021) & (US$ Million)
Table 137. BaseClear Recent Development
Table 138. Research Programs/Design for This Report
Table 139. Key Data Information from Secondary Sources
Table 140. Key Data Information from Primary Sources
List of Figures
Figure 1. Global Bioinformatics Services Market Share by Type: 2020 VS 2027
Figure 2. Sequencing Services Features
Figure 3. Data Analysis Features
Figure 4. Drug Discovery Services Features
Figure 5. Differential Features
Figure 6. Others Features
Figure 7. Global Bioinformatics Services Market Share by Application: 2020 VS 2027
Figure 8. Genomics Case Studies
Figure 9. Chemoinformatics and Drug Design Case Studies
Figure 10. Proteomics Case Studies
Figure 11. Transcriptomics Case Studies
Figure 12. Metabolomics Case Studies
Figure 13. Others Case Studies
Figure 14. Bioinformatics Services Report Years Considered
Figure 15. Global Bioinformatics Services Market Size (US$ Million), Year-over-Year: 2016-2027
Figure 16. Global Bioinformatics Services Market Size (US$ Million), 2016 VS 2021 VS 2027
Figure 17. Global Bioinformatics Services Market Share by Regions: 2020 VS 2027
Figure 18. Global Bioinformatics Services Market Share by Regions (2022-2027)
Figure 19. Global Bioinformatics Services Market Share by Players in 2020
Figure 20. Global Top Bioinformatics Services Players by Company Type (Tier 1, Tier 2 and Tier 3) (based on the Revenue in Bioinformatics Services as of 2020
Figure 21. The Top 10 and 5 Players Market Share by Bioinformatics Services Revenue in 2020
Figure 22. Global Bioinformatics Services Revenue Market Share by Type (2016-2021)
Figure 23. Global Bioinformatics Services Revenue Market Share by Type (2022-2027)
Figure 24. North America Bioinformatics Services Market Size YoY Growth (2016-2027) & (US$ Million)
Figure 25. North America Bioinformatics Services Market Share by Type (2016-2027)
Figure 26. North America Bioinformatics Services Market Share by Application (2016-2027)
Figure 27. North America Bioinformatics Services Market Share by Country (2016-2027)
Figure 28. United States Bioinformatics Services Market Size YoY Growth (2016-2027) & (US$ Million)
Figure 29. Canada Bioinformatics Services Market Size YoY Growth (2016-2027) & (US$ Million)
Figure 30. Europe Bioinformatics Services Market Size YoY Growth (2016-2027) & (US$ Million)
Figure 31. Europe Bioinformatics Services Market Share by Type (2016-2027)
Figure 32. Europe Bioinformatics Services Market Share by Application (2016-2027)
Figure 33. Europe Bioinformatics Services Market Share by Country (2016-2027)
Figure 34. Germany Bioinformatics Services Market Size YoY Growth (2016-2027) & (US$ Million)
Figure 35. France Bioinformatics Services Market Size YoY Growth (2016-2027) & (US$ Million)
Figure 36. U.K. Bioinformatics Services Market Size YoY Growth (2016-2027) & (US$ Million)
Figure 37. Italy Bioinformatics Services Market Size YoY Growth (2016-2027) & (US$ Million)
Figure 38. Russia Bioinformatics Services Market Size YoY Growth (2016-2027) & (US$ Million)
Figure 39. Nordic Bioinformatics Services Market Size YoY Growth (2016-2027) & (US$ Million)
Figure 40. Asia-Pacific Bioinformatics Services Market Size YoY Growth (2016-2027) & (US$ Million)
Figure 41. Asia-Pacific Bioinformatics Services Market Share by Type (2016-2027)
Figure 42. Asia-Pacific Bioinformatics Services Market Share by Application (2016-2027)
Figure 43. Asia-Pacific Bioinformatics Services Market Share by Region (2016-2027)
Figure 44. China Bioinformatics Services Market Size YoY Growth (2016-2027) & (US$ Million)
Figure 45. Japan Bioinformatics Services Market Size YoY Growth (2016-2027) & (US$ Million)
Figure 46. South Korea Bioinformatics Services Market Size YoY Growth (2016-2027) & (US$ Million)
Figure 47. Southeast Asia Bioinformatics Services Market Size YoY Growth (2016-2027) & (US$ Million)
Figure 48. India Bioinformatics Services Market Size YoY Growth (2016-2027) & (US$ Million)
Figure 49. Australia Bioinformatics Services Market Size YoY Growth (2016-2027) & (US$ Million)
Figure 50. Latin America Bioinformatics Services Market Size YoY Growth (2016-2027) & (US$ Million)
Figure 51. Latin America Bioinformatics Services Market Share by Type (2016-2027)
Figure 52. Latin America Bioinformatics Services Market Share by Application (2016-2027)
Figure 53. Latin America Bioinformatics Services Market Share by Country (2016-2027)
Figure 54. Mexico Bioinformatics Services Market Size YoY Growth (2016-2027) & (US$ Million)
Figure 55. Brazil Bioinformatics Services Market Size YoY Growth (2016-2027) & (US$ Million)
Figure 56. Middle East & Africa Bioinformatics Services Market Size YoY Growth (2016-2027) & (US$ Million)
Figure 57. Middle East & Africa Bioinformatics Services Market Share by Type (2016-2027)
Figure 58. Middle East & Africa Bioinformatics Services Market Share by Application (2016-2027)
Figure 59. Middle East & Africa Bioinformatics Services Market Share by Country (2016-2027)
Figure 60. Turkey Bioinformatics Services Market Size YoY Growth (2016-2027) & (US$ Million)
Figure 61. Saudi Arabia Bioinformatics Services Market Size YoY Growth (2016-2027) & (US$ Million)
Figure 62. UAE Bioinformatics Services Market Size YoY Growth (2016-2027) & (US$ Million)
Figure 63. Illumina Revenue Growth Rate in Bioinformatics Services Business (2016-2021)
Figure 64. Thermo Fisher Scientific Revenue Growth Rate in Bioinformatics Services Business (2016-2021)
Figure 65. Eurofins Scientific Revenue Growth Rate in Bioinformatics Services Business (2016-2021)
Figure 66. BGI Revenue Growth Rate in Bioinformatics Services Business (2016-2021)
Figure 67. NeoGenomics Revenue Growth Rate in Bioinformatics Services Business (2016-2021)
Figure 68. PerkinElmer Revenue Growth Rate in Bioinformatics Services Business (2016-2021)
Figure 69. CD Genomics Revenue Growth Rate in Bioinformatics Services Business (2016-2021)
Figure 70. Macrogen Revenue Growth Rate in Bioinformatics Services Business (2016-2021)
Figure 71. QIAGEN Revenue Growth Rate in Bioinformatics Services Business (2016-2021)
Figure 72. GENEWIZ Revenue Growth Rate in Bioinformatics Services Business (2016-2021)
Figure 73. Source BioScience Revenue Growth Rate in Bioinformatics Services Business (2016-2021)
Figure 74. Microsynth Revenue Growth Rate in Bioinformatics Services Business (2016-2021)
Figure 75. MedGenome Revenue Growth Rate in Bioinformatics Services Business (2016-2021)
Figure 76. Fios Genomics Revenue Growth Rate in Bioinformatics Services Business (2016-2021)
Figure 77. BaseClear Revenue Growth Rate in Bioinformatics Services Business (2016-2021)
Figure 78. Bottom-up and Top-down Approaches for This Report
Figure 79. Data Triangulation
Figure 80. Key Executives Interviewed
$3900
$7800
HAVE A QUERY?
OUR CUSTOMER
