
GRP Bathroom Pods Market Size was 181.23 Million in 2022, with CAGR 4.25% during 2023-2029.
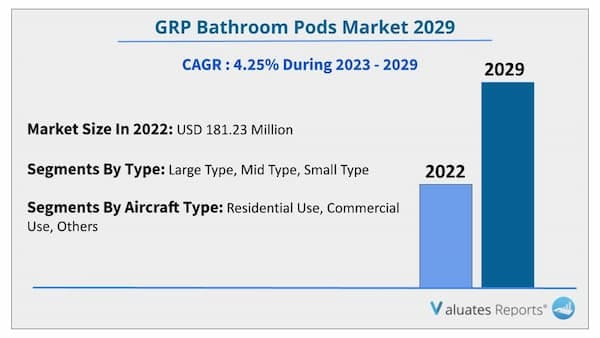
Glass-reinforced plastic bathroom pods are a type of prefabricated bathroom pods which are used in projects where robustness, ease of maintenance, and longevity are important factors. Key drivers of the grp bathroom pods market include innovative product launches by key market players and the growing student accommodation sector along with built-to-rent homes.
Further advantages of grp bathroom pods and widespread application are also expected to propel the growth of the grp bathroom pods market during the forecast period.
Innovative product launches and growing student accommodation sector along with built to rent homes
Leading manufacturers are developing specialized products to meet the ever-increasing demand of consumers. Specialized grp bathroom pods have been built for the built-to-rent residential sector. These specialized pods have two distinct features namely floorless pod supply for minimizing floor buildup and a tile effect finish for aesthetics. Further, the growing student accommodation sector along with rising build-to-rent residential homes is also expected to drive market growth. Thus innovative products for the student accommodation sector along with built-in rent homes are expected to drive the growth of the grp bathroom pods market during the forecast period.
Various benefits offered and widespread application
Grp bathroom pods have a variety of benefits such as it is robust, easy to clean, low maintenance required, and low capital cost in comparison to steel framed bathroom pods, etc. In addition to it, these pods have widespread application in student accommodation, hospitals, mental health units, military, hotels, and built to rent residential sectors. Thus a range of benefits offered and widespread applications in various sectors are going to spur the growth of the grp bathroom pods market during the forecast period.
Based on application, the commercial segment will provide lucrative opportunities for the growth of the grp bathroom pods market share during the forecast period due to growing usage in hotels, salons, etc.
| Report Metric | Details |
| Report Name | GRP Bathroom Pods Market |
| The market size in 2022 | USD 181.23 Million |
| Growth Rate | CAGR 4.25% |
| Market size available for years | 2023-2029 |
| Forecast units | Value (USD) |
| Segments covered | Type, Application, Industry, Regions |
| Report coverage | Revenue & volume forecast, company share, competitive landscape, growth factors, and trends |
| Geographic regions covered | North America, Europe, Asia Pacific, Latin America, Middle East & Africa |
Ans. Some of the major companies are Walker Modular, Offsite Solutions, Bathsystem, Interpod, Eurocomponents, Elements Europe, Sanika, Oldcastle SurePods, Taplanes, Pivotek, Buildo.
Ans. Yes, we do provide the option to buy chapters in a report. We also can customize the report based on your specific requirements.
1 Study Coverage
1.1 GRP (Glass Reinforced Plastic) Bathroom Pods Product Introduction
1.2 Market by Type
1.2.1 Global GRP (Glass Reinforced Plastic) Bathroom Pods Market Size Growth Rate by Type
1.2.2 Large Type
1.2.3 Mid Type
1.2.4 Small Type
1.3 Market by Application
1.3.1 Global GRP (Glass Reinforced Plastic) Bathroom Pods Market Size Growth Rate by Application
1.3.2 Residential Use
1.3.3 Commercial Use
1.3.4 Others (Military accommodation, prisons, etc.)
1.4 Study Objectives
1.5 Years Considered
2 Global GRP (Glass Reinforced Plastic) Bathroom Pods Production
2.1 Global GRP (Glass Reinforced Plastic) Bathroom Pods Production Capacity (2016-2027)
2.2 Global GRP (Glass Reinforced Plastic) Bathroom Pods Production by Region: 2016 VS 2021 VS 2027
2.3 Global GRP (Glass Reinforced Plastic) Bathroom Pods Production by Region
2.3.1 Global GRP (Glass Reinforced Plastic) Bathroom Pods Historic Production by Region (2016-2021)
2.3.2 Global GRP (Glass Reinforced Plastic) Bathroom Pods Forecasted Production by Region (2022-2027)
2.4 North America
2.5 Europe
2.6 China
2.7 Japan
3 Global GRP (Glass Reinforced Plastic) Bathroom Pods Sales in Volume & Value Estimates and Forecasts
3.1 Global GRP (Glass Reinforced Plastic) Bathroom Pods Sales Estimates and Forecasts 2016-2027
3.2 Global GRP (Glass Reinforced Plastic) Bathroom Pods Revenue Estimates and Forecasts 2016-2027
3.3 Global GRP (Glass Reinforced Plastic) Bathroom Pods Revenue by Region: 2016 VS 2021 VS 2027
3.4 Global Top GRP (Glass Reinforced Plastic) Bathroom Pods Regions by Sales
3.4.1 Global Top GRP (Glass Reinforced Plastic) Bathroom Pods Regions by Sales (2016-2021)
3.4.2 Global Top GRP (Glass Reinforced Plastic) Bathroom Pods Regions by Sales (2022-2027)
3.5 Global Top GRP (Glass Reinforced Plastic) Bathroom Pods Regions by Revenue
3.5.1 Global Top GRP (Glass Reinforced Plastic) Bathroom Pods Regions by Revenue (2016-2021)
3.5.2 Global Top GRP (Glass Reinforced Plastic) Bathroom Pods Regions by Revenue (2022-2027)
3.6 North America
3.7 Europe
3.8 Asia-Pacific
3.9 Latin America
3.10 Middle East & Africa
4 Competition by Manufactures
4.1 Global GRP (Glass Reinforced Plastic) Bathroom Pods Production Capacity by Manufacturers
4.2 Global GRP (Glass Reinforced Plastic) Bathroom Pods Sales by Manufacturers
4.2.1 Global Top GRP (Glass Reinforced Plastic) Bathroom Pods Manufacturers by Sales (2016-2021)
4.2.2 Global Top GRP (Glass Reinforced Plastic) Bathroom Pods Manufacturers Market Share by Sales (2016-2021)
4.2.3 Global Top 10 and Top 5 Companies by GRP (Glass Reinforced Plastic) Bathroom Pods Sales in 2020
4.3 Global GRP (Glass Reinforced Plastic) Bathroom Pods Revenue by Manufacturers
4.3.1 Global Top GRP (Glass Reinforced Plastic) Bathroom Pods Manufacturers by Revenue (2016-2021)
4.3.2 Global Top GRP (Glass Reinforced Plastic) Bathroom Pods Manufacturers Market Share by Revenue (2016-2021)
4.3.3 Global Top 10 and Top 5 Companies by GRP (Glass Reinforced Plastic) Bathroom Pods Revenue in 2020
4.4 Global GRP (Glass Reinforced Plastic) Bathroom Pods Sales Price by Manufacturers
4.5 Analysis of Competitive Landscape
4.5.1 Manufacturers Market Concentration Ratio (CR5 and HHI)
4.5.2 Global GRP (Glass Reinforced Plastic) Bathroom Pods Market Share by Company Type (Tier 1, Tier 2, and Tier 3)
4.5.3 Global GRP (Glass Reinforced Plastic) Bathroom Pods Manufacturers Geographical Distribution
4.6 Mergers & Acquisitions, Expansion Plans
5 Market Size by Type
5.1 Global GRP (Glass Reinforced Plastic) Bathroom Pods Sales by Type
5.1.1 Global GRP (Glass Reinforced Plastic) Bathroom Pods Historical Sales by Type (2016-2021)
5.1.2 Global GRP (Glass Reinforced Plastic) Bathroom Pods Forecasted Sales by Type (2022-2027)
5.1.3 Global GRP (Glass Reinforced Plastic) Bathroom Pods Sales Market Share by Type (2016-2027)
5.2 Global GRP (Glass Reinforced Plastic) Bathroom Pods Revenue by Type
5.2.1 Global GRP (Glass Reinforced Plastic) Bathroom Pods Historical Revenue by Type (2016-2021)
5.2.2 Global GRP (Glass Reinforced Plastic) Bathroom Pods Forecasted Revenue by Type (2022-2027)
5.2.3 Global GRP (Glass Reinforced Plastic) Bathroom Pods Revenue Market Share by Type (2016-2027)
5.3 Global GRP (Glass Reinforced Plastic) Bathroom Pods Price by Type
5.3.1 Global GRP (Glass Reinforced Plastic) Bathroom Pods Price by Type (2016-2021)
5.3.2 Global GRP (Glass Reinforced Plastic) Bathroom Pods Price Forecast by Type (2022-2027)
6 Market Size by Application
6.1 Global GRP (Glass Reinforced Plastic) Bathroom Pods Sales by Application
6.1.1 Global GRP (Glass Reinforced Plastic) Bathroom Pods Historical Sales by Application (2016-2021)
6.1.2 Global GRP (Glass Reinforced Plastic) Bathroom Pods Forecasted Sales by Application (2022-2027)
6.1.3 Global GRP (Glass Reinforced Plastic) Bathroom Pods Sales Market Share by Application (2016-2027)
6.2 Global GRP (Glass Reinforced Plastic) Bathroom Pods Revenue by Application
6.2.1 Global GRP (Glass Reinforced Plastic) Bathroom Pods Historical Revenue by Application (2016-2021)
6.2.2 Global GRP (Glass Reinforced Plastic) Bathroom Pods Forecasted Revenue by Application (2022-2027)
6.2.3 Global GRP (Glass Reinforced Plastic) Bathroom Pods Revenue Market Share by Application (2016-2027)
6.3 Global GRP (Glass Reinforced Plastic) Bathroom Pods Price by Application
6.3.1 Global GRP (Glass Reinforced Plastic) Bathroom Pods Price by Application (2016-2021)
6.3.2 Global GRP (Glass Reinforced Plastic) Bathroom Pods Price Forecast by Application (2022-2027)
7 North America
7.1 North America GRP (Glass Reinforced Plastic) Bathroom Pods Market Size by Type
7.1.1 North America GRP (Glass Reinforced Plastic) Bathroom Pods Sales by Type (2016-2027)
7.1.2 North America GRP (Glass Reinforced Plastic) Bathroom Pods Revenue by Type (2016-2027)
7.2 North America GRP (Glass Reinforced Plastic) Bathroom Pods Market Size by Application
7.2.1 North America GRP (Glass Reinforced Plastic) Bathroom Pods Sales by Application (2016-2027)
7.2.2 North America GRP (Glass Reinforced Plastic) Bathroom Pods Revenue by Application (2016-2027)
7.3 North America GRP (Glass Reinforced Plastic) Bathroom Pods Sales by Country
7.3.1 North America GRP (Glass Reinforced Plastic) Bathroom Pods Sales by Country (2016-2027)
7.3.2 North America GRP (Glass Reinforced Plastic) Bathroom Pods Revenue by Country (2016-2027)
7.3.3 U.S.
7.3.4 Canada
8 Europe
8.1 Europe GRP (Glass Reinforced Plastic) Bathroom Pods Market Size by Type
8.1.1 Europe GRP (Glass Reinforced Plastic) Bathroom Pods Sales by Type (2016-2027)
8.1.2 Europe GRP (Glass Reinforced Plastic) Bathroom Pods Revenue by Type (2016-2027)
8.2 Europe GRP (Glass Reinforced Plastic) Bathroom Pods Market Size by Application
8.2.1 Europe GRP (Glass Reinforced Plastic) Bathroom Pods Sales by Application (2016-2027)
8.2.2 Europe GRP (Glass Reinforced Plastic) Bathroom Pods Revenue by Application (2016-2027)
8.3 Europe GRP (Glass Reinforced Plastic) Bathroom Pods Sales by Country
8.3.1 Europe GRP (Glass Reinforced Plastic) Bathroom Pods Sales by Country (2016-2027)
8.3.2 Europe GRP (Glass Reinforced Plastic) Bathroom Pods Revenue by Country (2016-2027)
8.3.3 Germany
8.3.4 France
8.3.5 U.K.
8.3.6 Italy
8.3.7 Russia
9 Asia Pacific
9.1 Asia Pacific GRP (Glass Reinforced Plastic) Bathroom Pods Market Size by Type
9.1.1 Asia Pacific GRP (Glass Reinforced Plastic) Bathroom Pods Sales by Type (2016-2027)
9.1.2 Asia Pacific GRP (Glass Reinforced Plastic) Bathroom Pods Revenue by Type (2016-2027)
9.2 Asia Pacific GRP (Glass Reinforced Plastic) Bathroom Pods Market Size by Application
9.2.1 Asia Pacific GRP (Glass Reinforced Plastic) Bathroom Pods Sales by Application (2016-2027)
9.2.2 Asia Pacific GRP (Glass Reinforced Plastic) Bathroom Pods Revenue by Application (2016-2027)
9.3 Asia Pacific GRP (Glass Reinforced Plastic) Bathroom Pods Sales by Region
9.3.1 Asia Pacific GRP (Glass Reinforced Plastic) Bathroom Pods Sales by Region (2016-2027)
9.3.2 Asia Pacific GRP (Glass Reinforced Plastic) Bathroom Pods Revenue by Region (2016-2027)
9.3.3 China
9.3.4 Japan
9.3.5 South Korea
9.3.6 India
9.3.7 Australia
9.3.8 China Taiwan
9.3.9 Indonesia
9.3.10 Thailand
9.3.11 Malaysia
10 Latin America
10.1 Latin America GRP (Glass Reinforced Plastic) Bathroom Pods Market Size by Type
10.1.1 Latin America GRP (Glass Reinforced Plastic) Bathroom Pods Sales by Type (2016-2027)
10.1.2 Latin America GRP (Glass Reinforced Plastic) Bathroom Pods Revenue by Type (2016-2027)
10.2 Latin America GRP (Glass Reinforced Plastic) Bathroom Pods Market Size by Application
10.2.1 Latin America GRP (Glass Reinforced Plastic) Bathroom Pods Sales by Application (2016-2027)
10.2.2 Latin America GRP (Glass Reinforced Plastic) Bathroom Pods Revenue by Application (2016-2027)
10.3 Latin America GRP (Glass Reinforced Plastic) Bathroom Pods Sales by Country
10.3.1 Latin America GRP (Glass Reinforced Plastic) Bathroom Pods Sales by Country (2016-2027)
10.3.2 Latin America GRP (Glass Reinforced Plastic) Bathroom Pods Revenue by Country (2016-2027)
10.3.3 Mexico
10.3.4 Brazil
10.3.5 Argentina
11 Middle East and Africa
11.1 Middle East and Africa GRP (Glass Reinforced Plastic) Bathroom Pods Market Size by Type
11.1.1 Middle East and Africa GRP (Glass Reinforced Plastic) Bathroom Pods Sales by Type (2016-2027)
11.1.2 Middle East and Africa GRP (Glass Reinforced Plastic) Bathroom Pods Revenue by Type (2016-2027)
11.2 Middle East and Africa GRP (Glass Reinforced Plastic) Bathroom Pods Market Size by Application
11.2.1 Middle East and Africa GRP (Glass Reinforced Plastic) Bathroom Pods Sales by Application (2016-2027)
11.2.2 Middle East and Africa GRP (Glass Reinforced Plastic) Bathroom Pods Revenue by Application (2016-2027)
11.3 Middle East and Africa GRP (Glass Reinforced Plastic) Bathroom Pods Sales by Country
11.3.1 Middle East and Africa GRP (Glass Reinforced Plastic) Bathroom Pods Sales by Country (2016-2027)
11.3.2 Middle East and Africa GRP (Glass Reinforced Plastic) Bathroom Pods Revenue by Country (2016-2027)
11.3.3 Turkey
11.3.4 Saudi Arabia
11.3.5 UAE
12 Corporate Profiles
12.1 Walker Modular
12.1.1 Walker Modular Corporation Information
12.1.2 Walker Modular Overview
12.1.3 Walker Modular GRP (Glass Reinforced Plastic) Bathroom Pods Sales, Price, Revenue and Gross Margin (2016-2021)
12.1.4 Walker Modular GRP (Glass Reinforced Plastic) Bathroom Pods Product Description
12.1.5 Walker Modular Recent Developments
12.2 Offsite Solutions
12.2.1 Offsite Solutions Corporation Information
12.2.2 Offsite Solutions Overview
12.2.3 Offsite Solutions GRP (Glass Reinforced Plastic) Bathroom Pods Sales, Price, Revenue and Gross Margin (2016-2021)
12.2.4 Offsite Solutions GRP (Glass Reinforced Plastic) Bathroom Pods Product Description
12.2.5 Offsite Solutions Recent Developments
12.3 Bathsystem
12.3.1 Bathsystem Corporation Information
12.3.2 Bathsystem Overview
12.3.3 Bathsystem GRP (Glass Reinforced Plastic) Bathroom Pods Sales, Price, Revenue and Gross Margin (2016-2021)
12.3.4 Bathsystem GRP (Glass Reinforced Plastic) Bathroom Pods Product Description
12.3.5 Bathsystem Recent Developments
12.4 Interpod
12.4.1 Interpod Corporation Information
12.4.2 Interpod Overview
12.4.3 Interpod GRP (Glass Reinforced Plastic) Bathroom Pods Sales, Price, Revenue and Gross Margin (2016-2021)
12.4.4 Interpod GRP (Glass Reinforced Plastic) Bathroom Pods Product Description
12.4.5 Interpod Recent Developments
12.5 Eurocomponents
12.5.1 Eurocomponents Corporation Information
12.5.2 Eurocomponents Overview
12.5.3 Eurocomponents GRP (Glass Reinforced Plastic) Bathroom Pods Sales, Price, Revenue and Gross Margin (2016-2021)
12.5.4 Eurocomponents GRP (Glass Reinforced Plastic) Bathroom Pods Product Description
12.5.5 Eurocomponents Recent Developments
12.6 Elements Europe
12.6.1 Elements Europe Corporation Information
12.6.2 Elements Europe Overview
12.6.3 Elements Europe GRP (Glass Reinforced Plastic) Bathroom Pods Sales, Price, Revenue and Gross Margin (2016-2021)
12.6.4 Elements Europe GRP (Glass Reinforced Plastic) Bathroom Pods Product Description
12.6.5 Elements Europe Recent Developments
12.7 Sanika
12.7.1 Sanika Corporation Information
12.7.2 Sanika Overview
12.7.3 Sanika GRP (Glass Reinforced Plastic) Bathroom Pods Sales, Price, Revenue and Gross Margin (2016-2021)
12.7.4 Sanika GRP (Glass Reinforced Plastic) Bathroom Pods Product Description
12.7.5 Sanika Recent Developments
12.8 Oldcastle SurePods
12.8.1 Oldcastle SurePods Corporation Information
12.8.2 Oldcastle SurePods Overview
12.8.3 Oldcastle SurePods GRP (Glass Reinforced Plastic) Bathroom Pods Sales, Price, Revenue and Gross Margin (2016-2021)
12.8.4 Oldcastle SurePods GRP (Glass Reinforced Plastic) Bathroom Pods Product Description
12.8.5 Oldcastle SurePods Recent Developments
12.9 Taplanes
12.9.1 Taplanes Corporation Information
12.9.2 Taplanes Overview
12.9.3 Taplanes GRP (Glass Reinforced Plastic) Bathroom Pods Sales, Price, Revenue and Gross Margin (2016-2021)
12.9.4 Taplanes GRP (Glass Reinforced Plastic) Bathroom Pods Product Description
12.9.5 Taplanes Recent Developments
12.10 Pivotek
12.10.1 Pivotek Corporation Information
12.10.2 Pivotek Overview
12.10.3 Pivotek GRP (Glass Reinforced Plastic) Bathroom Pods Sales, Price, Revenue and Gross Margin (2016-2021)
12.10.4 Pivotek GRP (Glass Reinforced Plastic) Bathroom Pods Product Description
12.10.5 Pivotek Recent Developments
12.11 Buildom
12.11.1 Buildom Corporation Information
12.11.2 Buildom Overview
12.11.3 Buildom GRP (Glass Reinforced Plastic) Bathroom Pods Sales, Price, Revenue and Gross Margin (2016-2021)
12.11.4 Buildom GRP (Glass Reinforced Plastic) Bathroom Pods Product Description
12.11.5 Buildom Recent Developments
13 Industry Chain and Sales Channels Analysis
13.1 GRP (Glass Reinforced Plastic) Bathroom Pods Industry Chain Analysis
13.2 GRP (Glass Reinforced Plastic) Bathroom Pods Key Raw Materials
13.2.1 Key Raw Materials
13.2.2 Raw Materials Key Suppliers
13.3 GRP (Glass Reinforced Plastic) Bathroom Pods Production Mode & Process
13.4 GRP (Glass Reinforced Plastic) Bathroom Pods Sales and Marketing
13.4.1 GRP (Glass Reinforced Plastic) Bathroom Pods Sales Channels
13.4.2 GRP (Glass Reinforced Plastic) Bathroom Pods Distributors
13.5 GRP (Glass Reinforced Plastic) Bathroom Pods Customers
14 Market Drivers, Opportunities, Challenges and Risks Factors Analysis
14.1 GRP (Glass Reinforced Plastic) Bathroom Pods Industry Trends
14.2 GRP (Glass Reinforced Plastic) Bathroom Pods Market Drivers
14.3 GRP (Glass Reinforced Plastic) Bathroom Pods Market Challenges
14.4 GRP (Glass Reinforced Plastic) Bathroom Pods Market Restraints
15 Key Finding in The Global GRP (Glass Reinforced Plastic) Bathroom Pods Study
16 Appendix
16.1 Research Methodology
16.1.1 Methodology/Research Approach
16.1.2 Data Source
16.2 Author Details
16.3 Disclaimer
List of Tables
Table 1. Global GRP (Glass Reinforced Plastic) Bathroom Pods Market Size Growth Rate by Type, 2016 VS 2021 VS 2027 (US$ Million)
Table 2. Major Manufacturers of Large Type
Table 3. Major Manufacturers of Mid Type
Table 4. Major Manufacturers of Small Type
Table 5. Global GRP (Glass Reinforced Plastic) Bathroom Pods Market Size Growth Rate by Application, 2016 VS 2021 2027 (US$ Million)
Table 6. Global GRP (Glass Reinforced Plastic) Bathroom Pods Production by Region: 2016 VS 2021 VS 2027 (K Units)
Table 7. Global GRP (Glass Reinforced Plastic) Bathroom Pods Production by Region (2016-2021) & (K Units)
Table 8. Global GRP (Glass Reinforced Plastic) Bathroom Pods Production Market Share by Region (2016-2021)
Table 9. Global GRP (Glass Reinforced Plastic) Bathroom Pods Production by Region (2022-2027) & (K Units)
Table 10. Global GRP (Glass Reinforced Plastic) Bathroom Pods Production Market Share by Region (2022-2027)
Table 11. Global GRP (Glass Reinforced Plastic) Bathroom Pods Revenue by Region: 2016 VS 2021 VS 2027 (US$ Million)
Table 12. Global GRP (Glass Reinforced Plastic) Bathroom Pods Sales by Region (2016-2021) & (K Units)
Table 13. Global GRP (Glass Reinforced Plastic) Bathroom Pods Sales Market Share by Region (2016-2021)
Table 14. Global GRP (Glass Reinforced Plastic) Bathroom Pods Sales by Region (2022-2027) & (K Units)
Table 15. Global GRP (Glass Reinforced Plastic) Bathroom Pods Sales Market Share by Region (2022-2027)
Table 16. Global GRP (Glass Reinforced Plastic) Bathroom Pods Revenue by Region (2016-2021) & (US$ Million)
Table 17. Global GRP (Glass Reinforced Plastic) Bathroom Pods Revenue Market Share by Region (2016-2021)
Table 18. Global GRP (Glass Reinforced Plastic) Bathroom Pods Revenue by Region (2022-2027) & (US$ Million)
Table 19. Global GRP (Glass Reinforced Plastic) Bathroom Pods Revenue Market Share by Region (2022-2027)
Table 20. Global GRP (Glass Reinforced Plastic) Bathroom Pods Production Capacity by Manufacturers (2016-2021) & (K Units)
Table 21. Global GRP (Glass Reinforced Plastic) Bathroom Pods Capacity Market Share by Manufacturers (2016-2021)
Table 22. Global GRP (Glass Reinforced Plastic) Bathroom Pods Production by Manufacturers (2016-2021) & (K Units)
Table 23. Global GRP (Glass Reinforced Plastic) Bathroom Pods Production Market Share by Manufacturers (2016-2021)
Table 24. Global GRP (Glass Reinforced Plastic) Bathroom Pods Sales by Manufacturers (2016-2021) & (K Units)
Table 25. Global GRP (Glass Reinforced Plastic) Bathroom Pods Sales Share by Manufacturers (2016-2021)
Table 26. Global GRP (Glass Reinforced Plastic) Bathroom Pods Revenue by Manufacturers (2016-2021) & (US$ Million)
Table 27. Global GRP (Glass Reinforced Plastic) Bathroom Pods Revenue Share by Manufacturers (2016-2021)
Table 28. GRP (Glass Reinforced Plastic) Bathroom Pods Price by Manufacturers 2016-2021 (US$/Unit)
Table 29. Global GRP (Glass Reinforced Plastic) Bathroom Pods Manufacturers Market Concentration Ratio (CR5 and HHI)
Table 30. Global GRP (Glass Reinforced Plastic) Bathroom Pods by Company Type (Tier 1, Tier 2, and Tier 3) & (based on the Revenue in GRP (Glass Reinforced Plastic) Bathroom Pods as of 2020)
Table 31. GRP (Glass Reinforced Plastic) Bathroom Pods Manufacturing Base Distribution and Headquarters
Table 32. Manufacturers GRP (Glass Reinforced Plastic) Bathroom Pods Product Offered
Table 33. Date of Manufacturers Enter into GRP (Glass Reinforced Plastic) Bathroom Pods Market
Table 34. Mergers & Acquisitions, Expansion Plans
Table 35. Global GRP (Glass Reinforced Plastic) Bathroom Pods Sales by Type (2016-2021) & (K Units)
Table 36. Global GRP (Glass Reinforced Plastic) Bathroom Pods Sales by Type (2022-2027) & (K Units)
Table 37. Global GRP (Glass Reinforced Plastic) Bathroom Pods Sales Share by Type (2016-2021)
Table 38. Global GRP (Glass Reinforced Plastic) Bathroom Pods Sales Share by Type (2022-2027)
Table 39. Global GRP (Glass Reinforced Plastic) Bathroom Pods Revenue by Type (2016-2021) & (US$ Million)
Table 40. Global GRP (Glass Reinforced Plastic) Bathroom Pods Revenue by Type (2022-2027) & (US$ Million)
Table 41. Global GRP (Glass Reinforced Plastic) Bathroom Pods Revenue Share by Type (2016-2021)
Table 42. Global GRP (Glass Reinforced Plastic) Bathroom Pods Revenue Share by Type (2022-2027)
Table 43. GRP (Glass Reinforced Plastic) Bathroom Pods Price by Type (2016-2021) & (US$/Unit)
Table 44. Global GRP (Glass Reinforced Plastic) Bathroom Pods Price Forecast by Type (2022-2027) & (US$/Unit)
Table 45. Global GRP (Glass Reinforced Plastic) Bathroom Pods Sales by Application (2016-2021) & (K Units)
Table 46. Global GRP (Glass Reinforced Plastic) Bathroom Pods Sales by Application (2022-2027) & (K Units)
Table 47. Global GRP (Glass Reinforced Plastic) Bathroom Pods Sales Share by Application (2016-2021)
Table 48. Global GRP (Glass Reinforced Plastic) Bathroom Pods Sales Share by Application (2022-2027)
Table 49. Global GRP (Glass Reinforced Plastic) Bathroom Pods Revenue by Application (2016-2021) & (US$ Million)
Table 50. Global GRP (Glass Reinforced Plastic) Bathroom Pods Revenue by Application (2022-2027) & (US$ Million)
Table 51. Global GRP (Glass Reinforced Plastic) Bathroom Pods Revenue Share by Application (2016-2021)
Table 52. Global GRP (Glass Reinforced Plastic) Bathroom Pods Revenue Share by Application (2022-2027)
Table 53. GRP (Glass Reinforced Plastic) Bathroom Pods Price by Application (2016-2021) & (US$/Unit)
Table 54. Global GRP (Glass Reinforced Plastic) Bathroom Pods Price Forecast by Application (2022-2027) & (US$/Unit)
Table 55. North America GRP (Glass Reinforced Plastic) Bathroom Pods Sales by Type (2016-2021) & (K Units)
Table 56. North America GRP (Glass Reinforced Plastic) Bathroom Pods Sales by Type (2022-2027) & (K Units)
Table 57. North America GRP (Glass Reinforced Plastic) Bathroom Pods Revenue by Type (2016-2021) & (US$ Million)
Table 58. North America GRP (Glass Reinforced Plastic) Bathroom Pods Revenue by Type (2022-2027) & (US$ Million)
Table 59. North America GRP (Glass Reinforced Plastic) Bathroom Pods Sales by Application (2016-2021) & (K Units)
Table 60. North America GRP (Glass Reinforced Plastic) Bathroom Pods Sales by Application (2022-2027) & (K Units)
Table 61. North America GRP (Glass Reinforced Plastic) Bathroom Pods Revenue by Application (2016-2021) & (US$ Million)
Table 62. North America GRP (Glass Reinforced Plastic) Bathroom Pods Revenue by Application (2022-2027) & (US$ Million)
Table 63. North America GRP (Glass Reinforced Plastic) Bathroom Pods Sales by Country (2016-2021) & (K Units)
Table 64. North America GRP (Glass Reinforced Plastic) Bathroom Pods Sales by Country (2022-2027) & (K Units)
Table 65. North America GRP (Glass Reinforced Plastic) Bathroom Pods Revenue by Country (2016-2021) & (US$ Million)
Table 66. North America GRP (Glass Reinforced Plastic) Bathroom Pods Revenue by Country (2022-2027) & (US$ Million)
Table 67. Europe GRP (Glass Reinforced Plastic) Bathroom Pods Sales by Type (2016-2021) & (K Units)
Table 68. Europe GRP (Glass Reinforced Plastic) Bathroom Pods Sales by Type (2022-2027) & (K Units)
Table 69. Europe GRP (Glass Reinforced Plastic) Bathroom Pods Revenue by Type (2016-2021) & (US$ Million)
Table 70. Europe GRP (Glass Reinforced Plastic) Bathroom Pods Revenue by Type (2022-2027) & (US$ Million)
Table 71. Europe GRP (Glass Reinforced Plastic) Bathroom Pods Sales by Application (2016-2021) & (K Units)
Table 72. Europe GRP (Glass Reinforced Plastic) Bathroom Pods Sales by Application (2022-2027) & (K Units)
Table 73. Europe GRP (Glass Reinforced Plastic) Bathroom Pods Revenue by Application (2016-2021) & (US$ Million)
Table 74. Europe GRP (Glass Reinforced Plastic) Bathroom Pods Revenue by Application (2022-2027) & (US$ Million)
Table 75. Europe GRP (Glass Reinforced Plastic) Bathroom Pods Sales by Country (2016-2021) & (K Units)
Table 76. Europe GRP (Glass Reinforced Plastic) Bathroom Pods Sales by Country (2022-2027) & (K Units)
Table 77. Europe GRP (Glass Reinforced Plastic) Bathroom Pods Revenue by Country (2016-2021) & (US$ Million)
Table 78. Europe GRP (Glass Reinforced Plastic) Bathroom Pods Revenue by Country (2022-2027) & (US$ Million)
Table 79. Asia Pacific GRP (Glass Reinforced Plastic) Bathroom Pods Sales by Type (2016-2021) & (K Units)
Table 80. Asia Pacific GRP (Glass Reinforced Plastic) Bathroom Pods Sales by Type (2022-2027) & (K Units)
Table 81. Asia Pacific GRP (Glass Reinforced Plastic) Bathroom Pods Revenue by Type (2016-2021) & (US$ Million)
Table 82. Asia Pacific GRP (Glass Reinforced Plastic) Bathroom Pods Revenue by Type (2022-2027) & (US$ Million)
Table 83. Asia Pacific GRP (Glass Reinforced Plastic) Bathroom Pods Sales by Application (2016-2021) & (K Units)
Table 84. Asia Pacific GRP (Glass Reinforced Plastic) Bathroom Pods Sales by Application (2022-2027) & (K Units)
Table 85. Asia Pacific GRP (Glass Reinforced Plastic) Bathroom Pods Revenue by Application (2016-2021) & (US$ Million)
Table 86. Asia Pacific GRP (Glass Reinforced Plastic) Bathroom Pods Revenue by Application (2022-2027) & (US$ Million)
Table 87. Asia Pacific GRP (Glass Reinforced Plastic) Bathroom Pods Sales by Region (2016-2021) & (K Units)
Table 88. Asia Pacific GRP (Glass Reinforced Plastic) Bathroom Pods Sales by Region (2022-2027) & (K Units)
Table 89. Asia Pacific GRP (Glass Reinforced Plastic) Bathroom Pods Revenue by Region (2016-2021) & (US$ Million)
Table 90. Asia Pacific GRP (Glass Reinforced Plastic) Bathroom Pods Revenue by Region (2022-2027) & (US$ Million)
Table 91. Latin America GRP (Glass Reinforced Plastic) Bathroom Pods Sales by Type (2016-2021) & (K Units)
Table 92. Latin America GRP (Glass Reinforced Plastic) Bathroom Pods Sales by Type (2022-2027) & (K Units)
Table 93. Latin America GRP (Glass Reinforced Plastic) Bathroom Pods Revenue by Type (2016-2021) & (US$ Million)
Table 94. Latin America GRP (Glass Reinforced Plastic) Bathroom Pods Revenue by Type (2022-2027) & (US$ Million)
Table 95. Latin America GRP (Glass Reinforced Plastic) Bathroom Pods Sales by Application (2016-2021) & (K Units)
Table 96. Latin America GRP (Glass Reinforced Plastic) Bathroom Pods Sales by Application (2022-2027) & (K Units)
Table 97. Latin America GRP (Glass Reinforced Plastic) Bathroom Pods Revenue by Application (2016-2021) & (US$ Million)
Table 98. Latin America GRP (Glass Reinforced Plastic) Bathroom Pods Revenue by Application (2022-2027) & (US$ Million)
Table 99. Latin America GRP (Glass Reinforced Plastic) Bathroom Pods Sales by Country (2016-2021) & (K Units)
Table 100. Latin America GRP (Glass Reinforced Plastic) Bathroom Pods Sales by Country (2022-2027) & (K Units)
Table 101. Latin America GRP (Glass Reinforced Plastic) Bathroom Pods Revenue by Country (2016-2021) & (US$ Million)
Table 102. Latin America GRP (Glass Reinforced Plastic) Bathroom Pods Revenue by Country (2022-2027) & (US$ Million)
Table 103. Middle East and Africa GRP (Glass Reinforced Plastic) Bathroom Pods Sales by Type (2016-2021) & (K Units)
Table 104. Middle East and Africa GRP (Glass Reinforced Plastic) Bathroom Pods Sales by Type (2022-2027) & (K Units)
Table 105. Middle East and Africa GRP (Glass Reinforced Plastic) Bathroom Pods Revenue by Type (2016-2021) & (US$ Million)
Table 106. Middle East and Africa GRP (Glass Reinforced Plastic) Bathroom Pods Revenue by Type (2022-2027) & (US$ Million)
Table 107. Middle East and Africa GRP (Glass Reinforced Plastic) Bathroom Pods Sales by Application (2016-2021) & (K Units)
Table 108. Middle East and Africa GRP (Glass Reinforced Plastic) Bathroom Pods Sales by Application (2022-2027) & (K Units)
Table 109. Middle East and Africa GRP (Glass Reinforced Plastic) Bathroom Pods Revenue by Application (2016-2021) & (US$ Million)
Table 110. Middle East and Africa GRP (Glass Reinforced Plastic) Bathroom Pods Revenue by Application (2022-2027) & (US$ Million)
Table 111. Middle East and Africa GRP (Glass Reinforced Plastic) Bathroom Pods Sales by Country (2016-2021) & (K Units)
Table 112. Middle East and Africa GRP (Glass Reinforced Plastic) Bathroom Pods Sales by Country (2022-2027) & (K Units)
Table 113. Middle East and Africa GRP (Glass Reinforced Plastic) Bathroom Pods Revenue by Country (2016-2021) & (US$ Million)
Table 114. Middle East and Africa GRP (Glass Reinforced Plastic) Bathroom Pods Revenue by Country (2022-2027) & (US$ Million)
Table 115. Walker Modular Corporation Information
Table 116. Walker Modular Description and Major Businesses
Table 117. Walker Modular GRP (Glass Reinforced Plastic) Bathroom Pods Sales (K Units), Revenue (US$ Million), Price (US$/Unit) and Gross Margin (2016-2021)
Table 118. Walker Modular GRP (Glass Reinforced Plastic) Bathroom Pods Product
Table 119. Walker Modular Recent Development
Table 120. Offsite Solutions Corporation Information
Table 121. Offsite Solutions Description and Major Businesses
Table 122. Offsite Solutions GRP (Glass Reinforced Plastic) Bathroom Pods Sales (K Units), Revenue (US$ Million), Price (US$/Unit) and Gross Margin (2016-2021)
Table 123. Offsite Solutions GRP (Glass Reinforced Plastic) Bathroom Pods Product
Table 124. Offsite Solutions Recent Development
Table 125. Bathsystem Corporation Information
Table 126. Bathsystem Description and Major Businesses
Table 127. Bathsystem GRP (Glass Reinforced Plastic) Bathroom Pods Sales (K Units), Revenue (US$ Million), Price (US$/Unit) and Gross Margin (2016-2021)
Table 128. Bathsystem GRP (Glass Reinforced Plastic) Bathroom Pods Product
Table 129. Bathsystem Recent Development
Table 130. Interpod Corporation Information
Table 131. Interpod Description and Major Businesses
Table 132. Interpod GRP (Glass Reinforced Plastic) Bathroom Pods Sales (K Units), Revenue (US$ Million), Price (US$/Unit) and Gross Margin (2016-2021)
Table 133. Interpod GRP (Glass Reinforced Plastic) Bathroom Pods Product
Table 134. Interpod Recent Development
Table 135. Eurocomponents Corporation Information
Table 136. Eurocomponents Description and Major Businesses
Table 137. Eurocomponents GRP (Glass Reinforced Plastic) Bathroom Pods Sales (K Units), Revenue (US$ Million), Price (US$/Unit) and Gross Margin (2016-2021)
Table 138. Eurocomponents GRP (Glass Reinforced Plastic) Bathroom Pods Product
Table 139. Eurocomponents Recent Development
Table 140. Elements Europe Corporation Information
Table 141. Elements Europe Description and Major Businesses
Table 142. Elements Europe GRP (Glass Reinforced Plastic) Bathroom Pods Sales (K Units), Revenue (US$ Million), Price (US$/Unit) and Gross Margin (2016-2021)
Table 143. Elements Europe GRP (Glass Reinforced Plastic) Bathroom Pods Product
Table 144. Elements Europe Recent Development
Table 145. Sanika Corporation Information
Table 146. Sanika Description and Major Businesses
Table 147. Sanika GRP (Glass Reinforced Plastic) Bathroom Pods Sales (K Units), Revenue (US$ Million), Price (US$/Unit) and Gross Margin (2016-2021)
Table 148. Sanika GRP (Glass Reinforced Plastic) Bathroom Pods Product
Table 149. Sanika Recent Development
Table 150. Oldcastle SurePods Corporation Information
Table 151. Oldcastle SurePods Description and Major Businesses
Table 152. Oldcastle SurePods GRP (Glass Reinforced Plastic) Bathroom Pods Sales (K Units), Revenue (US$ Million), Price (US$/Unit) and Gross Margin (2016-2021)
Table 153. Oldcastle SurePods GRP (Glass Reinforced Plastic) Bathroom Pods Product
Table 154. Oldcastle SurePods Recent Development
Table 155. Taplanes Corporation Information
Table 156. Taplanes Description and Major Businesses
Table 157. Taplanes GRP (Glass Reinforced Plastic) Bathroom Pods Sales (K Units), Revenue (US$ Million), Price (US$/Unit) and Gross Margin (2016-2021)
Table 158. Taplanes GRP (Glass Reinforced Plastic) Bathroom Pods Product
Table 159. Taplanes Recent Development
Table 160. Pivotek Corporation Information
Table 161. Pivotek Description and Major Businesses
Table 162. Pivotek GRP (Glass Reinforced Plastic) Bathroom Pods Sales (K Units), Revenue (US$ Million), Price (US$/Unit) and Gross Margin (2016-2021)
Table 163. Pivotek GRP (Glass Reinforced Plastic) Bathroom Pods Product
Table 164. Pivotek Recent Development
Table 165. Buildom Corporation Information
Table 166. Buildom Description and Major Businesses
Table 167. Buildom GRP (Glass Reinforced Plastic) Bathroom Pods Sales (K Units), Revenue (US$ Million), Price (US$/Unit) and Gross Margin (2016-2021)
Table 168. Buildom GRP (Glass Reinforced Plastic) Bathroom Pods Product
Table 169. Buildom Recent Development
Table 170. Key Raw Materials Lists
Table 171. Raw Materials Key Suppliers Lists
Table 172. GRP (Glass Reinforced Plastic) Bathroom Pods Distributors List
Table 173. GRP (Glass Reinforced Plastic) Bathroom Pods Customers List
Table 174. GRP (Glass Reinforced Plastic) Bathroom Pods Market Trends
Table 175. GRP (Glass Reinforced Plastic) Bathroom Pods Market Drivers
Table 176. GRP (Glass Reinforced Plastic) Bathroom Pods Market Challenges
Table 177. GRP (Glass Reinforced Plastic) Bathroom Pods Market Restraints
Table 178. Research Programs/Design for This Report
Table 179. Key Data Information from Secondary Sources
Table 180. Key Data Information from Primary Sources
List of Figures
Figure 1. GRP (Glass Reinforced Plastic) Bathroom Pods Product Picture
Figure 2. Global GRP (Glass Reinforced Plastic) Bathroom Pods Market Share by Type in 2020 & 2027
Figure 3. Large Type Product Picture
Figure 4. Mid Type Product Picture
Figure 5. Small Type Product Picture
Figure 6. Global GRP (Glass Reinforced Plastic) Bathroom Pods Market Share by Application in 2020 & 2027
Figure 7. Residential Use
Figure 8. Commercial Use
Figure 9. Others (Military accommodation, prisons, etc.)
Figure 10. GRP (Glass Reinforced Plastic) Bathroom Pods Report Years Considered
Figure 11. Global GRP (Glass Reinforced Plastic) Bathroom Pods Capacity, Production and Utilization (2016-2027) & (K Units)
Figure 12. Global GRP (Glass Reinforced Plastic) Bathroom Pods Production Market Share by Region in Percentage: 2020 Versus 2027
Figure 13. Global GRP (Glass Reinforced Plastic) Bathroom Pods Production Market Share by Region (2016-2021)
Figure 14. Global GRP (Glass Reinforced Plastic) Bathroom Pods Production Market Share by Region (2022-2027)
Figure 15. GRP (Glass Reinforced Plastic) Bathroom Pods Production Growth Rate in North America (2016-2027) & (K Units)
Figure 16. GRP (Glass Reinforced Plastic) Bathroom Pods Production Growth Rate in Europe (2016-2027) & (K Units)
Figure 17. GRP (Glass Reinforced Plastic) Bathroom Pods Production Growth Rate in China (2016-2027) & (K Units)
Figure 18. GRP (Glass Reinforced Plastic) Bathroom Pods Production Growth Rate in Japan (2016-2027) & (K Units)
Figure 19. Global GRP (Glass Reinforced Plastic) Bathroom Pods Sales 2016-2027 (K Units)
Figure 20. Global GRP (Glass Reinforced Plastic) Bathroom Pods Revenue, (US$ Million), 2016 VS 2021 VS 2027
Figure 21. Global GRP (Glass Reinforced Plastic) Bathroom Pods Revenue 2016-2027 (US$ Million)
Figure 22. Global GRP (Glass Reinforced Plastic) Bathroom Pods Revenue Market Share by Region in Percentage: 2020 Versus 2027
Figure 23. Global GRP (Glass Reinforced Plastic) Bathroom Pods Sales Market Share by Region (2016-2021)
Figure 24. Global GRP (Glass Reinforced Plastic) Bathroom Pods Sales Market Share by Region (2022-2027)
Figure 25. North America GRP (Glass Reinforced Plastic) Bathroom Pods Sales YoY (2016-2027) & (K Units)
Figure 26. North America GRP (Glass Reinforced Plastic) Bathroom Pods Revenue YoY (2016-2027) & (US$ Million)
Figure 27. Europe GRP (Glass Reinforced Plastic) Bathroom Pods Sales YoY (2016-2027) & (K Units)
Figure 28. Europe GRP (Glass Reinforced Plastic) Bathroom Pods Revenue YoY (2016-2027) & (US$ Million)
Figure 29. Asia-Pacific GRP (Glass Reinforced Plastic) Bathroom Pods Sales YoY (2016-2027) & (K Units)
Figure 30. Asia-Pacific GRP (Glass Reinforced Plastic) Bathroom Pods Revenue YoY (2016-2027) & (US$ Million)
Figure 31. Latin America GRP (Glass Reinforced Plastic) Bathroom Pods Sales YoY (2016-2027) & (K Units)
Figure 32. Latin America GRP (Glass Reinforced Plastic) Bathroom Pods Revenue YoY (2016-2027) & (US$ Million)
Figure 33. Middle East & Africa GRP (Glass Reinforced Plastic) Bathroom Pods Sales YoY (2016-2027) & (K Units)
Figure 34. Middle East & Africa GRP (Glass Reinforced Plastic) Bathroom Pods Revenue YoY (2016-2027) & (US$ Million)
Figure 35. The Top 10 and Top 5 Players Market Share by GRP (Glass Reinforced Plastic) Bathroom Pods Sales in 2020
Figure 36. The Top 10 and Top 5 Players Market Share by GRP (Glass Reinforced Plastic) Bathroom Pods Revenue in 2020
Figure 37. GRP (Glass Reinforced Plastic) Bathroom Pods Market Share by Company Type (Tier 1, Tier 2, and Tier 3): 2016 VS 2020
Figure 38. Global GRP (Glass Reinforced Plastic) Bathroom Pods Sales Market Share by Type (2016-2027)
Figure 39. Global GRP (Glass Reinforced Plastic) Bathroom Pods Revenue Market Share by Type (2016-2027)
Figure 40. Global GRP (Glass Reinforced Plastic) Bathroom Pods Sales Market Share by Application (2016-2027)
Figure 41. Global GRP (Glass Reinforced Plastic) Bathroom Pods Revenue Market Share by Application (2016-2027)
Figure 42. North America GRP (Glass Reinforced Plastic) Bathroom Pods Sales Market Share by Type (2016-2027)
Figure 43. North America GRP (Glass Reinforced Plastic) Bathroom Pods Revenue Market Share by Type (2016-2027)
Figure 44. North America GRP (Glass Reinforced Plastic) Bathroom Pods Sales Market Share by Application (2016-2027)
Figure 45. North America GRP (Glass Reinforced Plastic) Bathroom Pods Revenue Market Share by Application (2016-2027)
Figure 46. North America GRP (Glass Reinforced Plastic) Bathroom Pods Sales Share by Country (2016-2027)
Figure 47. North America GRP (Glass Reinforced Plastic) Bathroom Pods Revenue Share by Country (2016-2027)
Figure 48. U.S. GRP (Glass Reinforced Plastic) Bathroom Pods Revenue (2016-2027) & (US$ Million)
Figure 49. Canada GRP (Glass Reinforced Plastic) Bathroom Pods Revenue (2016-2027) & (US$ Million)
Figure 50. Europe GRP (Glass Reinforced Plastic) Bathroom Pods Sales Market Share by Type (2016-2027)
Figure 51. Europe GRP (Glass Reinforced Plastic) Bathroom Pods Revenue Market Share by Type (2016-2027)
Figure 52. Europe GRP (Glass Reinforced Plastic) Bathroom Pods Sales Market Share by Application (2016-2027)
Figure 53. Europe GRP (Glass Reinforced Plastic) Bathroom Pods Revenue Market Share by Application (2016-2027)
Figure 54. Europe GRP (Glass Reinforced Plastic) Bathroom Pods Sales Share by Country (2016-2027)
Figure 55. Europe GRP (Glass Reinforced Plastic) Bathroom Pods Revenue Share by Country (2016-2027)
Figure 56. Germany GRP (Glass Reinforced Plastic) Bathroom Pods Revenue (2016-2027) & (US$ Million)
Figure 57. France GRP (Glass Reinforced Plastic) Bathroom Pods Revenue (2016-2027) & (US$ Million)
Figure 58. U.K. GRP (Glass Reinforced Plastic) Bathroom Pods Revenue (2016-2027) & (US$ Million)
Figure 59. Italy GRP (Glass Reinforced Plastic) Bathroom Pods Revenue (2016-2027) & (US$ Million)
Figure 60. Russia GRP (Glass Reinforced Plastic) Bathroom Pods Revenue (2016-2027) & (US$ Million)
Figure 61. Asia Pacific GRP (Glass Reinforced Plastic) Bathroom Pods Sales Market Share by Type (2016-2027)
Figure 62. Asia Pacific GRP (Glass Reinforced Plastic) Bathroom Pods Revenue Market Share by Type (2016-2027)
Figure 63. Asia Pacific GRP (Glass Reinforced Plastic) Bathroom Pods Sales Market Share by Application (2016-2027)
Figure 64. Asia Pacific GRP (Glass Reinforced Plastic) Bathroom Pods Revenue Market Share by Application (2016-2027)
Figure 65. Asia Pacific GRP (Glass Reinforced Plastic) Bathroom Pods Sales Share by Region (2016-2027)
Figure 66. Asia Pacific GRP (Glass Reinforced Plastic) Bathroom Pods Revenue Share by Region (2016-2027)
Figure 67. China GRP (Glass Reinforced Plastic) Bathroom Pods Revenue (2016-2027) & (US$ Million)
Figure 68. Japan GRP (Glass Reinforced Plastic) Bathroom Pods Revenue (2016-2027) & (US$ Million)
Figure 69. South Korea GRP (Glass Reinforced Plastic) Bathroom Pods Revenue (2016-2027) & (US$ Million)
Figure 70. India GRP (Glass Reinforced Plastic) Bathroom Pods Revenue (2016-2027) & (US$ Million)
Figure 71. Australia GRP (Glass Reinforced Plastic) Bathroom Pods Revenue (2016-2027) & (US$ Million)
Figure 72. China Taiwan GRP (Glass Reinforced Plastic) Bathroom Pods Revenue (2016-2027) & (US$ Million)
Figure 73. Indonesia GRP (Glass Reinforced Plastic) Bathroom Pods Revenue (2016-2027) & (US$ Million)
Figure 74. Thailand GRP (Glass Reinforced Plastic) Bathroom Pods Revenue (2016-2027) & (US$ Million)
Figure 75. Malaysia GRP (Glass Reinforced Plastic) Bathroom Pods Revenue (2016-2027) & (US$ Million)
Figure 76. Latin America GRP (Glass Reinforced Plastic) Bathroom Pods Sales Market Share by Type (2016-2027)
Figure 77. Latin America GRP (Glass Reinforced Plastic) Bathroom Pods Revenue Market Share by Type (2016-2027)
Figure 78. Latin America GRP (Glass Reinforced Plastic) Bathroom Pods Sales Market Share by Application (2016-2027)
Figure 79. Latin America GRP (Glass Reinforced Plastic) Bathroom Pods Revenue Market Share by Application (2016-2027)
Figure 80. Latin America GRP (Glass Reinforced Plastic) Bathroom Pods Sales Share by Country (2016-2027)
Figure 81. Latin America GRP (Glass Reinforced Plastic) Bathroom Pods Revenue Share by Country (2016-2027)
Figure 82. Mexico GRP (Glass Reinforced Plastic) Bathroom Pods Revenue (2016-2027) & (US$ Million)
Figure 83. Brazil GRP (Glass Reinforced Plastic) Bathroom Pods Revenue (2016-2027) & (US$ Million)
Figure 84. Argentina GRP (Glass Reinforced Plastic) Bathroom Pods Revenue (2016-2027) & (US$ Million)
Figure 85. Middle East and Africa GRP (Glass Reinforced Plastic) Bathroom Pods Sales Market Share by Type (2016-2027)
Figure 86. Middle East and Africa GRP (Glass Reinforced Plastic) Bathroom Pods Revenue Market Share by Type (2016-2027)
Figure 87. Middle East and Africa GRP (Glass Reinforced Plastic) Bathroom Pods Sales Market Share by Application (2016-2027)
Figure 88. Middle East and Africa GRP (Glass Reinforced Plastic) Bathroom Pods Revenue Market Share by Application (2016-2027)
Figure 89. Middle East and Africa GRP (Glass Reinforced Plastic) Bathroom Pods Sales Share by Country (2016-2027)
Figure 90. Middle East and Africa GRP (Glass Reinforced Plastic) Bathroom Pods Revenue Share by Country (2016-2027)
Figure 91. Turkey GRP (Glass Reinforced Plastic) Bathroom Pods Revenue (2016-2027) & (US$ Million)
Figure 92. Saudi Arabia GRP (Glass Reinforced Plastic) Bathroom Pods Revenue (2016-2027) & (US$ Million)
Figure 93. UAE GRP (Glass Reinforced Plastic) Bathroom Pods Revenue (2016-2027) & (US$ Million)
Figure 94. GRP (Glass Reinforced Plastic) Bathroom Pods Value Chain
Figure 95. GRP (Glass Reinforced Plastic) Bathroom Pods Production Process
Figure 96. Channels of Distribution
Figure 97. Distributors Profiles
Figure 98. Bottom-up and Top-down Approaches for This Report
Figure 99. Data Triangulation
Figure 100. Key Executives Interviewed
$4900
$9800
HAVE A QUERY?
OUR CUSTOMER
