0
U.S. (TOLL FREE)
+1 (315) 215-3225
Automative

0
U.S. (TOLL FREE)
+1 (315) 215-3225
Mushroom Market Size, Share, Statistics & Trends Analysis Report by Type, End-Use, Distribution Channel, Region, and Segment Forecasts, 2021 - 2027
Published Date: March 2021
|
Report Code: ALLI-Auto-0Z427
Home | Market Reports | Food & Drink| Food
Mushroom Market by Type Button Shiitake Oyster and Others Form Fresh and Processed End Use Residential Commercial and Industrial and Distribution Channel Hypermarkets Supermarkets Convenience Stores Specialty Stores and Online Sales Channel Global Opportunity Analysis and Industry Forecast 2021 2027

Mushroom Market Size, Share, Statistics & Trends Analysis Report by Type, End-Use, Distribution Channel, Region, and Segment Forecasts, 2021 - 2027

Code: ALLI-Auto-0Z427
Report
March 2021
203 Pages
Allied Market Research
Region: Global
DESCRIPTION
TABLE OF CONTENT
TABLES & FIGURES

Mushroom Market Statistics 2027

The mushroom market size was valued at USD 33,553.0 Million in 2019 and is estimated to reach USD 53,342.0 Million by 2027, registering a CAGR of 9.3% from 2021 to 2027. demand for mushrooms is expected to increase, owing to improvements in food preferences and a rise in the knowledge of balanced diets among consumers. In addition, mushrooms contain less fat and cholesterol and are rich in nutrients such as vitamins and minerals. Hence, such benefits of mushrooms are anticipated to propel market growth during the forecast period.
 
Mushroom_Market
 
Mushrooms are considered to be good for health as they contain negligible sodium and gluten content. Low fat and cholesterol content is expected to result in increased consumer acceptance of mushrooms. They are grouped under vegetables and contain various nutrients such as potassium, vitamins, and selenium. The most popular of mushrooms is Agaricusbisporus, which is considered safe for most people to eat as they are grown in a controlled and sterilized environment.
 
The mushroom market is segmented on the basis of type, form, end-use, distribution channel, and region. On the basis of type, the market is categorized into button, shiitake, oyster, and others. By form, it is bifurcated into fresh and processed. Depending on end use, it is divided into residential, commercial, and industrial. On the basis of distribution channel, it is divided into hypermarkets & supermarkets, convenience stores, specialty stores, and online sales channel. Region wise, the market is analyzed across North America, Europe, Asia-Pacific, and LAMEA.
 
Other types of mushrooms such as Cremini, Portabello, Maitake, Enoki, Beech, King Trumpet, Black Trumpet, Chanterelle, Hedgehog, Morel, Porcino mushrooms are found in North America, Europe, Asia-Pacific, and LAMEA. In a mushroom market analysis, button mushroom market share is higher depending on the type. According to the form of the mushrooms, fresh mushrooms has the largest market share. Based on end-use, the commercial segment holds the largest market share. Depending on the distribution channel, the market share of the specialty stores is the highest.
 
Mushrooms have a considerably short shelf life, which is expected to adversely affect the market. However, various governments and foreign agencies are continuously investing in R&D to cope up with this issue of shorter shelf life. Several developments in biotechnology have enhanced breeding of mushrooms, which is expected to drive the mushroom market during the 2021 to 2027. In addition, improvements in food preferences and rise in knowledge of balanced diets among consumers are expected to propel the market growth.
 
Increase in commercial consumption of mushrooms in restaurants, supermarkets, cafeterias, and hotels is expected to play a vital role in the mushroom market demand and growth during the forecast period. In addition, change in consumer preferences toward vegan food and rise in demand for meat substitutes are also expected to propel the mushroom market growth in the future. These mushroom market trends are going to propel the mushroom industry
 
Furthermore, change in customer preferences toward processed food consumption is another major mushroom market opportunity that propels the market growth. However, production of mushrooms is heavily labor intensive and requires high operating costs, which, in turn, is anticipated to hamper growth of the market.
 
Rise in disposable incomes in urban areas and people living in metro cities in developing are key contributors in the food sector. Firms in the food sector are also taking advantage of increasing trends in food ready-to-eat consumption, processed foods, and advanced packaging. As a result, the global market for mushrooms is growing significantly across the globe.
 
Rapid development of the catering sector stimulates growth of mushrooms in the respective market. Catering channels are one of the key channels for marketing of mushrooms, where staff works continuously to ensure food safety standards to increase awareness of safety of raw materials and to protect environment.
 
There are about 20 different types of mushrooms present in the market that are found across the globe. Shiitake and oyster mushrooms are the most commonly used ones for human consumption. Mushrooms contain a ton of minerals and vitamins, including copper, potassium, magnesium, and zinc. They are low in calories and free from fat and cholesterol. Mushrooms are also rich in antioxidants such as selenium and glutathione or GSH, substances believed to protect cells from damage and minimize inflammation and chronic diseases. Hence, owing to these nutritional properties, edible mushrooms are very popular among global customers.
 
Product launches, mergers and acquisitions, joint ventures, and geographical expansions are key strategies adopted by players in the mushroom market. Key players in the global mushroom market include Mush-boom Costa Pty Ltd., The Mushroom Company, Monaghan Mushrooms Ireland, S.A. Mushrooms, Basciani Foods Inc., To-Jo Mushrooms, Ann Miller’s Specialty Mushrooms, Valley Mushrooms, White Prince Mushrooms, and NABIA.

Key Findings of the Study

  • The global mushroom market was valued at $33,553.0 million in 2019 and is projected to reach $53,342.0 million by 2027, registering a CAGR of 9.3%.
  • By region, the North America mushroom market is the highest revenue contributor and was valued at $11,240.3 million in 2019, and is projected to reach $16,642.7 million by 2027, registering a CAGR of 8.4%.
  • By type, the shiitake mushrooms segment is estimated to witness the fastest growth, with a CAGR of 7.9%.
  • In the North America mushroom market, the U.S. contributed the highest revenue of $8,368.4 million in 2019 and is estimated to reach $11,929.5 million by 2027, registering a CAGR of 7.9%. 
The major players operating in the market are Basciani Foods, Mush-boom Costa, Monaghan Mushrooms, To-Jo Mushrooms, Valley Mushrooms, The Mushroom Company, Ann Miller’s Specialty Mushrooms, White Prince Mushrooms, SA Mushrooms, and NABIA.

Key Benefits for Stakeholders

  • This report provides a quantitative analysis of current trends, estimations, and dynamics of the global mushroom market from 2019 to 2027 to identify the prevailing market opportunities.
  • Porter’s five forces analysis highlights potency of the buyers and suppliers to enable stakeholders to make profit-oriented business decisions and strengthen their supplier–buyer network.
  • In-depth analysis of the market segmentation assists in determining the prevailing market opportunities.
  • Major countries in each region are mapped according to their revenue contribution to the global industry. The market player positioning segment facilitates benchmarking while providing a clear understanding of the present position of the key market players.
  • The report includes analyses of the regional as well as global market, key players, market segments, application areas, and growth strategies.

Mushroom Market Segments

Mushroom Market by Type

  • Button
  • Shiitake
  • Oyster
  • Others

Mushroom Market by Form

  • Fresh
  • Processed

Mushroom Market by End-User

  • Residential
  • Commercial
  • Industrial

Mushroom Market by Distribution Channel

  • Hypermarkets & Supermarkets
  • Convenience Stores
  • Specialty Stores
  • Online Sales Channel

Mushroom Market by Region

  • North America
  • U.S.
  • Canada
  • Mexico
  • Europe
  • UK
  • France
  • Spain
  • Italy
  • Netherlands
  • Germany
  • Turkey
  • Rest of Europe
  • Asia-Pacific
  • China
  • Japan
  • India
  • South Korea
  • Australia
  • Rest of Asia-Pacific
  • LAMEA
  • Brazil
  • South Africa
  • United Arab Emirates
  • Rest of LAMEA

Frequently Asked Questions About This Report

1. Which is the most influencing segment growing in the global mushroom market report?

Ans. By Type, the Button segment is expected to grow at the highest CAGR of 11.40% during the forecast period

2. Which region dominated the global mushroom market?

Ans. Asia-Pacific dominates the market and is expected to grow at the highest CAGR of 11.80% during the forecast period.

3. What will be the global mushroom market size from 2021 to 2027?

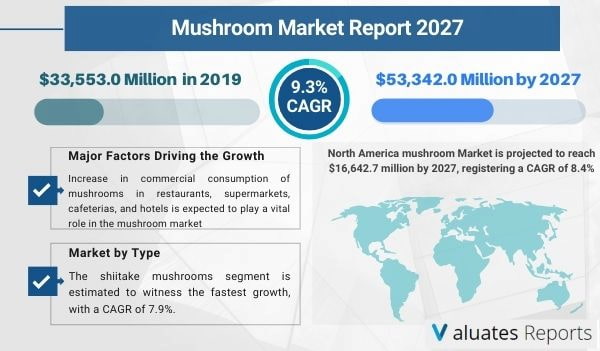
Ans. The global mushroom market size was valued at $33,553.0 million in 2019 and is estimated to reach $53,342.0 million by 2027, registering a CAGR of 9.3% from 2021 to 2027

4. What are the key trends in the mushroom market report?

Ans. Technological developments such as automated mushroom harvesting, substrate, sterilization and spawn preparation, and increase in investments in R&D are expected to drive the growth of the mushroom market during the forecast period.

5. Who are the key players in the mushroom market?

Ans. The major players operating in the market are Basciani Foods, Mush-boom Costa, Monaghan Mushrooms, To-Jo Mushrooms, Valley Mushrooms, The Mushroom Company, Ann Miller’s Specialty Mushrooms, White Prince Mushrooms, SA Mushrooms, and NABIA.

6. What would be the forecast period in the mushroom market report?

Ans. The forecast period considered for the global mushroom market is 2021 to 2027

Table of Content
 
CHAPTER 1:INTRODUCTION
1.1.Report description
1.2.Key benefits for stakeholders
1.3.Key market segments
1.4.Research methodology
1.4.1.Secondary research
1.4.2.Primary research
1.4.3.Analyst tools and models
CHAPTER 2:EXECUTIVE SUMMARY
2.1.Key findings of the study
2.2.CXO perspective
CHAPTER 3:MARKET OVERVIEW
3.1.Market definition and scope
3.2.Key findings
3.2.1.Top investment pockets
3.3.Porter’s five forces analysis
3.4. Market share analysis/top player positioning, 2019
3.5.Market dynamics
3.5.1.Drivers
3.5.1.1.Technology Developments and increased investment in R&D
3.5.1.2.Health consciousness is rising among consumers
3.5.1.3.Increase in demand of mushroom due to its nutritional properties
3.5.2.Restraints
3.5.2.1.Short shelf life
3.5.2.2.Regulating the temperature and high operational costs
3.5.3.Opportunity
3.5.3.1.Increased use of mushrooms as a supplement of meat products
3.5.3.2.Shift towards Vegan and Organic food products
3.6.Value chain analysis
3.7.Impact of Covid-19
3.8.Impact of Key Regulation
CHAPTER 4:MUSHROOM MARKET, BY TYPE
4.1.Overview
4.1.1.Market size and forecast
4.2.Button Mushrooms
4.2.1.Key market trends, growth factors, and opportunities
4.2.2.Market size and forecast
4.3.Shiitake Mushrooms
4.3.1.Key market trends, growth factors, and opportunities
4.3.2.Market size and forecast
4.4.Oyster Mushrooms
4.3.1.Key market trends, growth factors, and opportunities
4.3.2.Market size and forecast
4.5.Others
4.4.1.Key market trends, growth factors, and opportunities
4.4.2.Market size and forecast
CHAPTER 5:MUSHROOM MARKET, BY FORM
5.1.Overview
5.1.1.Market size and forecast
5.2.Fresh Mushrooms
5.2.1.Key market trends, growth factors, and opportunities
5.2.2.Market size and forecast
5.3.Processed Mushrooms
5.3.1.Key market trends, growth factors, and opportunities
5.3.2.Market size and forecast
CHAPTER 6:MUSHROOM MARKET, BY END USE
6.1.Overview
6.1.1.Market size and forecast
6.2.Residential
6.2.1.Key market trends, growth factors, and opportunities
6.2.2.Market size and forecast
6.3.Commercial
6.3.1.Key market trends, growth factors, and opportunities
6.3.2.Market size and forecast
6.4.Industrial
6.4.1.Key market trends, growth factors, and opportunities
6.4.2.Market size and forecast
CHAPTER 7:MUSHROOM MARKET, BY DISTRIBUTION CHANNEL
7.1.Overview
7.1.1.Market size and forecast
7.2.Hypermarkets & Supermarkets
7.2.1.Key market trends, growth factors, and opportunities
7.2.2.Market size and forecast
7.3.Convenience Stores
7.3.1.Key market trends, growth factors, and opportunities
7.3.2.Market size and forecast
7.4.Specialty Stores
7.4.1.Key market trends, growth factors, and opportunities
7.4.2.Market size and forecast
7.5.Online Sales Channel
7.5.1.Key market trends, growth factors, and opportunities
7.5.2.Market size and forecast
CHAPTER 8:MUSHROOM MARKET, BY REGION
8.1.Overview
8.1.1.Market size and forecast, by region
8.2.North America
8.2.1.Key market trends, growth factors, and opportunities
8.2.2.Market size and forecast, by Type.
8.2.3.Market size and forecast, by Form.
8.2.4.Market size and forecast, by End use
8.2.5.Market size and forecast, by Distribution channel
8.2.6.Market size and forecast, by Country
8.2.6.1.U.S.
8.2.6.1.1.Market size and forecast, by Type
8.2.6.1.2.Market size and forecast, by Form
8.2.6.1.3.Market size and forecast, by End use
8.2.6.1.4.Market size and forecast, by Distribution channel
8.2.6.2.Canada
8.2.6.2.1.Market size and forecast, by Type
8.2.6.2.2.Market size and forecast, by Form
8.2.6.2.3.Market size and forecast, by End use
8.2.6.2.4.Market size and forecast, by Distribution channel
8.2.6.3.Mexico
8.2.6.3.1.Market size and forecast, by Type
8.2.6.3.2.Market size and forecast, by Form
8.2.6.3.3.Market size and forecast, by End use
8.2.6.3.4.Market size and forecast, by Distribution channel
8.3.Europe
8.3.1.Key market trends, growth factors, and opportunities
8.3.2.Market size and forecast, by Type.
8.2.3.Market size and forecast, by Form.
8.3.4.Market size and forecast, by End use
8.3.5.Market size and forecast, by Distribution channel
8.3.6.Market size and forecast, by Country
8.3.6.1.UK
8.3.6.1.1.Market size and forecast, by Type
8.3.6.1.2.Market size and forecast, by end user
8.3.6.1.3.Market size and forecast, by End user
8.3.6.1.4.Market size and forecast, by Distribution channel
8.3.6.2.France
8.3.6.2.1.Market size and forecast, by Type
8.3.6.2.2.Market size and forecast, by Form
8.3.6.2.3.Market size and forecast, by End use
8.3.6.2.4.Market size and forecast, by distribution channel
8.3.6.3.Spain
8.3.6.3.1.Market size and forecast, by Type
8.3.6.3.2.Market size and forecast, by Form
8.3.6.3.3.Market size and forecast, by End use
8.3.5.3.4.Market size and forecast, by Distribution channel
8.3.6.4.Italy
8.3.6.4.1.Market size and forecast, by Type
8.3.6.4.2.Market size and forecast, by Form
8.3.6.4.3.Market size and forecast, by End use
8.3.6.4.4.Market size and forecast, by Distribution channel
8.3.6.5.The Netherlands
8.3.6.5.1.Market size and forecast, by Type
8.3.6.5.2.Market size and forecast, by Form
8.3.6.5.3.Market size and forecast, by End use
8.3.6.5.4.Market size and forecast, by Distribution channel
8.3.6.6.Germany
8.3.6.6.1.Market size and forecast, by Type
8.3.6.6.2.Market size and forecast, byForm
8.3.6.6.3.Market size and forecast, by End use
8.3.6.6.4.Market size and forecast, by Distribution channel
8.3.6.7.Turkey
8.3.6.7.1.Market size and forecast, by Type
8.3.6.7.2.Market size and forecast, byForm
8.3.6.7.3.Market size and forecast, by End use
8.3.6.7.4.Market size and forecast, by Distribution channel
8.3.6.8.Rest of Europe
8.3.6.8.1.Market size and forecast, by Type
8.3.6.8.2.Market size and forecast, byForm
8.3.6.8.3.Market size and forecast, byEnd Use
8.3.6.8.4.Market size and forecast, by Distribution channel
8.4.Asia-Pacific
8.4.1.Key market trends, growth factors, and opportunities
8.4.2.Market size and forecast, by Type.
8.4.3.Market size and forecast, by Form.
8.4.4.Market size and forecast, by End use
8.4.5.Market size and forecast, by Distribution channel
8.4.6.Market size and forecast, by Country
8.4.6.1.China
8.4.6.1.1.Market size and forecast, by Type
8.4.6.1.2.Market size and forecast, byForm
8.4.6.1.3.Market size and forecast, by End use
8.4.6.1.4.Market size and forecast, by Distribution channel
8.4.6.2.Japan
8.4.6.2.1.Market size and forecast, by Type
8.4.6.2.2.Market size and forecast, byForm
8.4.6.2.3.Market size and forecast, by End use
8.4.6.2.3.Market size and forecast, by Distribution channel
8.4.6.3.India
8.4.6.3.1.Market size and forecast, by Type
8.4.6.3.2.Market size and forecast, byForm
8.4.6.3.3.Market size and forecast, by End use
8.4.6.3.4.Market size and forecast, by Distribution channel
8.4.6.4.South Korea
8.4.6.4.1.Market size and forecast, by Type
8.4.6.4.2.Market size and forecast, by Form
8.4.6.4.3.Market size and forecast, by End use
8.4.6.4.4.Market size and forecast, by Distribution channel
8.4.6.5.Australia
8.4.6.5.1.Market size and forecast, by Type
8.4.6.5.2.Market size and forecast, by Form
8.4.6.5.3.Market size and forecast, by End use
8.4.6.5.4.Market size and forecast, by Distribution channel
8.4.6.6.Rest of Asia-Pacific
8.4.6.6.1.Market size and forecast, by Type
8.4.6.6.2.Market size and forecast, by Form
8.4.6.7.3.Market size and forecast, by End use
8.4.6.7.4.Market size and forecast, by Distribution channel
8.5.LAMEA
8.5.1.Key market trends, growth factors, and opportunities
8.5.2.Market size and forecast, by Type.
8.2.3.Market size and forecast, by Form.
8.5.4.Market size and forecast, by End use
8.5.5.Market size and forecast, by Distribution channel
8.5.6.Market size and forecast, by Country
8.5.6.1.Brazil
8.5.6.1.1.Market size and forecast, by Type
8.5.6.1.2.Market size and forecast, by Form
8.5.6.1.3.Market size and forecast, by End use
8.5.6.1.4.Market size and forecast, by Distribution channel
8.5.6.2.South Africa
8.5.6.2.1.Market size and forecast, by Type
8.5.6.2.2.Market size and forecast, by Form
8.5.6.2.3.Market size and forecast, by End use
8.5.6.2.4.Market size and forecast, by Distribution channel
8.5.6.3.United Arab Emirates
8.5.6.3.1.Market size and forecast, by Type
8.5.6.3.2.Market size and forecast, by Form
8.5.6.3.3.Market size and forecast, by End use
8.5.6.3.4.Market size and forecast, by Distribution channel
8.5.6.4.Rest of LAMEA
8.5.6.4.1.Market size and forecast, by Type
8.5.6.4.2.Market size and forecast, by Form
8.5.6.4.3.Market size and forecast, by End use
8.5.6.4.4.Market size and forecast, by Distribution channel
CHAPTER 9:COMPETITION LANDSCAPE
9.1.Top winning strategies
9.2.Product mapping
9.3.Competitive dashboard
9.4.Competitive heat map
9.5.Key developments
9.5.1.Business Expansion
9.5.2.Partnership
CHAPTER 10:COMPANY PROFILES
10.1.BASCIANI FOODS INC.
10.1.1.Company overview
10.1.2.Key Executives
10.1.3.Company snapshot
10.1.4.Product portfolio
10.2.MUSH-BOOM COSTA (COSTA PTY LTD.)
10.2.1.Company overview
10.2.2.Key Executives
10.2.3.Company snapshot
10.2.4.Product portfolio
10.3.MONAGHAN MUSHROOMS
10.3.1.Company overview
10.3.2.Key Executives
10.3.3.Company snapshot
10.3.4.Product portfolio
10.4.TO-JO MUSHROOMS (TO-JO)
10.4.1.Company overview
10.4.2.Key Executives
10.4.3.Company snapshot
10.4.4.Product portfolio
10.5.VALLEY MUSHROOMS
10.5.1.Company overview
10.5.2.Key Executives
10.5.3.Company snapshot
10.5.4.Product portfolio
10.6.THE MUSHROOM COMPANY
10.6.1.Company overview
10.6.2.Key Executives
10.6.3.Company snapshot
10.6.4.Product portfolio
10.7.ANN MILLER'S SPECIALTY MUSHROOMS LTD. (ANN MILLER'S)
10.7.1.Company overview
10.7.2.Key Executives
10.7.3.Company snapshot
10.7.4.Product portfolio
10.8.WHITE PRINCE MUSHROOMS PTY LTD (WHITE PRINCE)
10.8.1.Company overview
10.8.2.Key Executives
10.8.3.Company snapshot
10.8.4.Product portfolio
10.9.SA MUSHROOMS
10.9.1.Company overview
10.9.2.Key Executives
10.9.3.Company snapshot
10.9.4.Product portfolio
10.10.NABIA
10.10.1.Company overview
10.10.2.Key Executives
10.10.3.Company snapshot
10.10.4.Product portfoli

List Of Tables


Table 01.Global Mushroom Market Revenue, By Type, 2019–2027 ($Million)

Table 02.Button Mushroom Market Revenue, By Region, 2019–2027 ($Million)

Table 03.Shiitake Mushroom Market Revenue, By Region, 2019–2027 ($Million)

Table 04.Oyster Mushroom Market Revenue, By Region, 2019–2027 ($Million)

Table 05.Others Market Revenue, By Region, 2019–2027 ($Million)

Table 06.Global Mushroom Market Revenue, By Form, 2019–2027 ($Million)

Table 07.Fresh Mushroom Market Revenue, By Region, 2019–2027 ($Million)

Table 08.Processed Mushroom Market Revenue, By Region, 2019–2027 ($Million)

Table 09.Global Mushroom Market Revenue, By End Use, 2019–2027 ($Million)

Table 10.Residential Mushroom Market Revenue, By Region, 2019–2027 ($Million)

Table 11.Commercial Mushroom Market Revenue, By Region, 2019–2027 ($Million)

Table 12.Industrial Mushroom Market Revenue, By Region, 2019–2027 ($Million)

Table 13.Mushroom Market Revenue, By Distribution Channel, 2019–2027 ($Million)

Table 14.Hypermarkets & Supermarkets Mushroom Market, By Region, 2019–2027 ($Million)

Table 15.Convenience Stores Mushroom Market, By Region, 2019–2027 ($Million)

Table 16.Specialty Stores Mushroom Market, By Region, 2019–2027 ($Million)

Table 16.Online Sales Channel Mushroom Market, By Region, 2019–2027 ($Million)

Table 17.Mushroom Market Revenue, By Region, 2019–2027 ($Million)

Table 18.North America Mushroom Market Revenue, By Type, 2019–2027 ($Million)

Table 19.North America Mushroom Market Revenue, By Form, 2019–2027 ($Million)

Table 20.North America Mushroom Market Revenue, By End Use, 2019–2027 ($Million)

Table 21.North America Mushroom Market Revenue, By Distribution Channel, 2019–2027 ($Million)

Table 22.North America Mushroom Market Revenue, By Country, 2019–2027 ($Million)

Table 23.U.S. Mushroom Market Revenue, By Type, 2019–2027 ($Million)

Table 24.U.S. Mushroom Market Revenue, By Form, 2019–2027 ($Million)

Table 25.U.S Mushroom Market Revenue, By End Use, 2019–2027 ($Million)

Table 26.U.S. Mushroom Market Revenue, By Distribution Channel, 2019–2027 ($Million)

Table 27.Canada Mushroom Market Revenue, By Type, 2019–2027 ($Million)

Table 28.Canada Mushroom Market Revenue, By Form, 2019–2027 ($Million)

Table 29.Canada Mushroom Market Revenue, By End Use, 2019–2027 ($Million)

Table 30.Canada Mushroom Market Revenue, By Distribution Channel, 2019–2027 ($Million)

Table 31.Mexico Mushroom Market Revenue, By Type, 2019–2027 ($Million)

Table 32.Mexico Mushroom Market Revenue, By Form, 2019–2027 ($Million)

Table 33.Mexico Mushroom Market Revenue, By End Use, 2019–2027 ($Million)

Table 34.Mexico Mushroom Market Revenue, By Distribution Channel, 2019–2027 ($Million)

Table 35.Europe Mushroom Market Revenue, By Type, 2019–2027 ($Million)

Table 36.Europe Mushroom Market Revenue, By Form, 2019–2027 ($Million)

Table 37.Europe Mushroom Market Revenue, By End Use, 2019–2027 ($Million)

Table 38.Europe Mushroom Market Revenue, By Distribution Channel, 2019–2027 ($Million)

Table 39.Europe Mushroom Market Revenue, By Country, 2019–2027 ($Million)

Table 40.Uk Mushroom Market Revenue, By Type, 2019–2027 ($Million)

Table 41.Uk Mushroom Market Revenue, By Form, 2019–2027 ($Million)

Table 42.Uk Mushroom Market Revenue, By End Use, 2019–2027 ($Million)

Table 43.Uk Mushroom Market Revenue, By Distribution Channel, 2019–2027 ($Million)

Table 44.France Mushroom Market Revenue, By Type, 2019–2027 ($Million)

Table 45.France Mushroom Market Revenue, By Form, 2019–2027 ($Million)

Table 46.France Mushroom Market Revenue, By End Use, 2019–2027 ($Million)

Table 47.France Mushroom Market Revenue, By Distribution Channel, 2019–2027 ($Million)

Table 48.Spain Mushroom Market Revenue, By Type, 2019–2027 ($Million)

Table 49.Spain Mushroom Market Revenue, By Form, 2019–2027 ($Million)

Table 50.Spain Mushroom Market Revenue, By End Use, 2019–2027 ($Million)

Table 51.Spain Mushroom Market Revenue, By Distribution Channel, 2019–2027 ($Million)

Table 52.Italy Mushroom Market Revenue, By Type, 2019–2027 ($Million)

Table 53.Italy Mushroom Market Revenue, By Form, 2019–2027 ($Million)

Table 53.Italy Mushroom Market Revenue, By End Use, 2019–2027 ($Million)

Table 54.Italy Mushroom Market Revenue, By Distribution Channel, 2019–2027 ($Million)

Table 55.The Netherlands Mushroom Market Revenue, By Type, 2019–2027 ($Million)

Table 56.The Netherlands Mushroom Market Revenue, By Form, 2019–2027 ($Million)

Table 57.The Netherlands Mushroom Market Revenue, By End Use, 2019–2027 ($Million)

Table 58.The Netherlands Mushroom Market Revenue, By Distribution Channel, 2019–2027 ($Million)

Table 59.Germany Mushroom Market Revenue, By Type, 2019–2027 ($Million)

Table 60.Germany Mushroom Market Revenue, By Form, 2019–2027 ($Million)

Table 61.Germany Mushroom Market Revenue, By End Use, 2019–2027 ($Million)

Table 62.Germany Mushroom Market Revenue, By Distribution Channel, 2019–2027 ($Million)

Table 63.Turkey Mushroom Market Revenue, By Type, 2019–2027 ($Million)

Table 64.Turkey Mushroom Market Revenue, By Form, 2019–2027 ($Million)

Table 65.Turkey Mushroom Market Revenue, By End Use, 2019–2027 ($Million)

Table 66.Turkey Mushroom Market Revenue, By Distribution Channel, 2019–2027 ($Million)

Table 67.Rest Of Europe Mushroom Market Revenue, By Type, 2019–2027 ($Million)

Table 68.Rest Of Europe Mushroom Market Revenue, By Form, 2019–2027 ($Million)

Table 69.Rest Of Europe Mushroom Market Revenue, By End Use, 2019–2027 ($Million)

Table 70.Rest Of Europe Mushroom Market Revenue, By Distribution Channel, 2019–2027 ($Million)

Table 71.Asia-pacific Mushroom Market Revenue, By Type, 2019–2027 ($Million)

Table 72.Asia-pacific Mushroom Market Revenue, By Form, 2019–2027 ($Million)

Table 73.Asia-pacific Mushroom Market Revenue, By End Use, 2019–2027 ($Million)

Table 74.Asia-pacific Mushroom Market Revenue, By Distribution Channel, 2019–2027 ($Million)

Table 75.Asia-pacific Mushroom Market Revenue, By Country, 2019–2027 ($Million)

Table 76.China Mushroom Market Revenue, By Type, 2019–2027 ($Million)

Table 77.China Mushroom Market Revenue, By Form, 2019–2027 ($Million)

Table 78.China Mushroom Market Revenue, By End Use, 2019–2027 ($Million)

Table 79.China Mushroom Market Revenue, By Distribution Channel, 2019–2027 ($Million)

Table 80.Japan Mushroom Market Revenue, By Type, 2019–2027 ($Million)

Table 81.Japan Mushroom Market Revenue, By Form, 2019–2027 ($Million)

Table 82.Japan Mushroom Market Revenue, By End Use, 2019–2027 ($Million)

Table 83.Japan Mushroom Market Revenue, By Distribution Channel, 2019–2027 ($Million)

Table 84.India Mushroom Market Revenue, By Type, 2019–2027 ($Million)

Table 85.India Mushroom Market Revenue, By Form, 2019–2027 ($Million)

Table 86.India Mushroom Market Revenue, By End Use, 2019–2027 ($Million)

Table 87.India Mushroom Market Revenue, By Distribution Channel, 2019–2027 ($Million)

Table 88.South Korea Mushroom Market Revenue, By Type, 2019–2027 ($Million)

Table 89.South Korea Mushroom Market Revenue, By Form, 2019–2027 ($Million)

Table 90.South Korea Mushroom Market Revenue, By End Use, 2019–2027 ($Million)

Table 91.South Korea Mushroom Market Revenue, By Distribution Channel, 2019–2027 ($Million)

Table 92.Australia Mushroom Market Revenue, By Type, 2019–2027 ($Million)

Table 93.Australia Mushroom Market Revenue, By Form, 2019–2027 ($Million)

Table 94.Australia Mushroom Market Revenue, By End Use, 2019–2027 ($Million)

Table 95.Australia Mushroom Market Revenue, By Distribution Channel, 2019–2027 ($Million)

Table 96.Rest Of Asia-pacific Mushroom Market Revenue, By Type, 2019–2027 ($Million)

Table 97.Rest Of Asia-pacific Mushroom Market Revenue, By Form, 2019–2027 ($Million)

Table 98.Rest Of Asia-pacific Mushroom Market Revenue, By End Use, 2019–2027 ($Million)

Table 99.Rest Of Asia-pacific Mushroom Market Revenue, By Distribution Channel, 2019–2027 ($Million)

Table 100.Lamea Mushroom Market Revenue, By Type, 2019–2027 ($Million)

Table 101.Lamea Mushroom Market Revenue, By Form, 2019–2027 ($Million)

Table 102.Lamea Mushroom Market Revenue, By End Use, 2019–2027 ($Million)

Table 103.Lamea Mushroom Market Revenue, By Distribution Channel, 2019–2027 ($Million)

Table 104.Lamea Mushroom Market Revenue, By Country, 2019–2027 ($Million)

Table 105.Brazil Mushroom Market Revenue, By Type, 2019–2027 ($Million)

Table 106.Brazil Mushroom Market Revenue, By Form, 2019–2027 ($Million)

Table 107.Brazil Mushroom Market Revenue, By End Use, 2019–2027 ($Million)

Table 108.Brazil Mushroom Market Revenue, By Distribution Channel, 2019–2027 ($Million)

Table 109.South Africa Mushroom Market Revenue, By Type, 2019–2027 ($Million)

Table 110.South Africa Mushroom Market Revenue, By Form, 2019–2027 ($Million)

Table 111.South Africa Mushroom Market Revenue, By End Use, 2019–2027 ($Million)

Table 112.South Africa Mushroom Market Revenue, By Distribution Channel, 2019–2027 ($Million)

Table 113.United Arab Emirates Mushroom Market Revenue, By Type, 2019–2027 ($Million)

Table 114.United Arab Emirates Mushroom Market Revenue, By Form, 2019–2027 ($Million)

Table 115.United Arab Emirates Mushroom Market Revenue, By End Use, 2019–2027 ($Million)

Table 116.United Arab Emirates Mushroom Market Revenue, By Distribution Channel, 2019–2027 ($Million)

Table 117.Rest Of Lamea Mushroom Market Revenue, By Type, 2019–2027 ($Million)

Table 118.Rest Of Lamea Mushroom Market Revenue, By Form, 2019–2027 ($Million)

Table 119.Rest Of Lamea Mushroom Market Revenue, By End Use, 2019–2027 ($Million)

Table 120.Rest Of Lamea Mushroom Market Revenue, By Distribution Channel, 2019–2027 ($Million)

Table 121.Basciani Foods Inc.: Key Executives

Table 122.Basciani Foods Inc. : Company Snapshot

Table 123.Basciani Foods Inc.: Product Portfolio

Table 124.Mush-boom Costa (Costa Pty. Ltd): Key Executives

Table 125.Mush-boom Costa (Costa Pty. Ltd): Company Snapshot

Table 126.Mush-boom Costa (Costa Pty. Ltd): Product Portfolio

Table 127.Monaghan Mushrooms: Key Executives

Table 128.Monaghan Mushrooms: Company Snapshot

Table 129.Monaghan Mushrooms: Product Portfolio

Table 130.To-jo Mushrooms : Key Executives

Table 131.To-jo Mushrooms : Company Snapshot

Table 132.To-jo Mushrooms : Product Portfolio

Table 133.Valley Mushrooms: Key Executives

Table 134.Valley Mushrooms: Company Snapshot

Table 135.Valley Mushrooms: Product Portfolio

Table 136.The Mushroom Company: Key Executives

Table 137.The Mushroom Company: Company Snapshot

Table 138.The Mushroom Company: Product Portfolio

Table 139.Ann Miller’s Specialty Mushrooms Ltd: Key Executives

Table 140.Ann Miller’s Specialty Mushrooms Ltd: Company Snapshot

Table 141.Ann Miller’s Specialty Mushrooms Ltd: Product Portfolio

Table 142.White Prince Mushrooms Pty Ltd: Key Executives

Table 143.White Prince Mushrooms Pty Ltd: Company Snapshot

Table 144.White Prince Mushrooms Pty Ltd.: Product Portfolio

Table 145.Sa Mushrooms: Key Executives

Table 146.Sa Mushrooms: Company Snapshot

Table 147.Sa Mushrooms: Product Portfolio

Table 148.Nabia: Key Executives

Table 149.Nabia: Company Snapshot

Table 150.Nabia: Product Portfolio List Of Figures


Figure 01.Global Mushroom Market Segmentation

Figure 02.Executive Summary

Figure 03.Top Investment Pockets

Figure 04.Moderate Bargaining Power Of Suppliers

Figure 05.Moderate Bargaining Power Of Buyers

Figure 06.Moderate Threat Of Substitution

Figure 07.Low Threat Of New Entrants

Figure 08.Moderate Intensity Of Competitive Rivalry

Figure 09.Market Share Analysis/Top Player Positioning

Figure 10.Mushroom Market: Drivers, Restraints, And Opportunities

Figure 11.Value Chain Analysis

Figure 12.Global Mushroom Market, By Type, 2019 (%)

Figure 13.Comparative Share Analysis Of Button Mushroom Market, By Region, 2019 & 2027 (%)

Figure 14.Comparative Share Analysis Of Shiitake Mushroom Market, By Region, 2019 & 2027 (%)

Figure 15.Comparative Share Analysis Of Oyster Mushroom Market, By Region, 2019 & 2027 (%)

Figure 16.Comparative Share Analysis Of Others Market, By Region, 2019 & 2027 (%)

Figure 17.Mushroom Market, By Form, 2019 (%)

Figure 18.Comparative Share Analysis Of Fresh Mushroom Market, By Region, 2019 & 2027 (%)

Figure 19.Comparative Share Analysis Of Processed Mushroom Market, By Region,2019 & 2027 (%)

Figure 20.Global Mushroom Market, By End Use, 2019 (%)

Figure 21.Comparative Share Analysis Of Residential Mushroom Market, By Region,2019 & 2027 (%)

Figure 22.Comparative Share Analysis Of Commercial Mushroom Market, By Region,2019 & 2027 (%)

Figure 23.Comparative Share Analysis Of Industrial Mushroom Market, By Region,2019 & 2027 (%)

Figure 24.Global Mushroom Market, By Distribution Channel, 2019 (%)

Figure 25.Comparative Share Analysis Of Hypermarket & Supermarket Mushroom Market, By Region,2019 & 2027 (%)

Figure 26.Comparative Share Analysis Of Convenience Stores Mushroom Market, By Region,2019 & 2027 (%)

Figure 27.Comparative Share Analysis Of Specialty Stores Mushroom Market, By Region, 2019 & 2027 (%)

Figure 28.Comparative Share Analysis Of Online Sales Channel Mushroom Market, By Region,2019 & 2027 (%)

Figure 29.Mushroom Market, By Region, 2019 (%)

Figure 30.U.S.Mushroom Market Revenue, 2019–2027 ($Million)

Figure 31.Canada Mushroom Market Revenue, 2019–2027 ($Million)

Figure 32.Mexico Mushroom Market Revenue, 2019–2027 ($Million)

Figure 33.Uk Mushroom Market Revenue, 2019–2027 ($Million)

Figure 34.France Mushroom Market Revenue, 2019–2027 ($Million)

Figure 35.Spain Mushroom Market Revenue, 2019–2027 ($Million)

Figure 36.Italy Mushroom Market Revenue, 2019–2027 ($Million)

Figure 37.The Netherlands Mushroom Market Revenue, 2019–2027 ($Million)

Figure 38.Germany Mushroom Market Revenue, 2019–2027 ($Million)

Figure 39.Turkey Mushroom Market Revenue, 2019–2027 ($Million)

Figure 40.Rest Of Europe Mushroom Market Revenue, 2019–2027 ($Million)

Figure 41.China Mushroom Market Revenue, 2019–2027 ($Million)

Figure 42.Japan Mushroom Market Revenue, 2019–2027 ($Million)

Figure 43.India Mushroom Market Revenue, 2019–2027 ($Million)

Figure 44.South Korea Mushroom Market Revenue, 2019–2027 ($Million)

Figure 45.Australia Mushroom Market Revenue, 2019–2027 ($Million)

Figure 46.Rest Of Asia-pacific Mushroom Market Revenue, 2019–2027 ($Million)

Figure 47.Brazil Mushroom Market Revenue, 2019–2027 ($Million)

Figure 48.South Africa Mushroom Market Revenue, 2019–2027 ($Million)

Figure 49.United Arab Emirates Mushroom Market Revenue, 2019–2027 ($Million)

Figure 50.Rest Of Lamea Mushroom Market Revenue, 2019–2027 ($Million)

Figure 51.Top Winning Strategies, By Year, 2017–2020*

Figure 52.Top Winning Strategies, By Development, 2017–2020* (%)

Figure 53.Product Mapping Of Top 10 Key Players

Figure 54.Competitive Dashboard Of Top 10 Key Players

Figure 55.Competitive Heatmap Of Top 10 Key Players

SELECT A FORMAT
Added to Cart
Electronic (PDF)

$5769

This license allows only one user to access the PDF.
Electronic (PDF)

$6450

This license allows 1 - 5 user to access the PDF, license is suitable for small groups of 5 users working together
Electronic (PDF)

$8995

This license allows users/teams in a same Enterprise to use this report, various departments within an enterpise can use this report
Electronic (PDF)

$3840

This license just provides quantitative data in a excel sheet
Add to Cart
Buy Now (10% Discount)

OUR CUSTOMER

Nano String

SIMILAR REPORTS