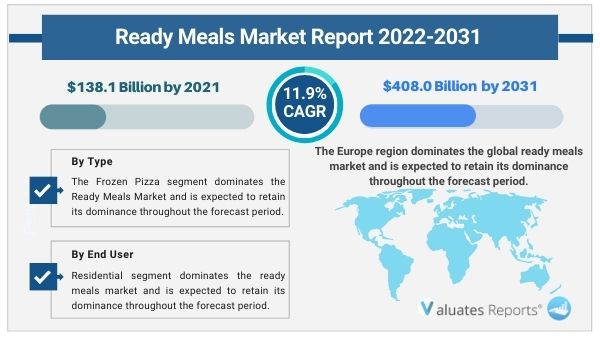
The global ready meals market size was valued at US$ 138.1 billion in 2021 and is projected to reach US$ 408.0 billion by 2031 growing at a CAGR of 11.9% during the forecast period. Key drivers of the ready meals market include the growing preference of these meals by the working population and students for time-saving, convenience, and small efforts involved in cooking. The growing trend of organic food products in the ready meals sector and easy availability through distribution channels will bolster the ready meals market growth in the coming years.

The covid 19 lockdown, the rise of remote working culture, and increasing demand for instant meals will bolster the market expansion during the forecast period. Furthermore, the growing focus of manufacturers on packaging will also contribute to the growth of the market. However, the growing perception of bad health effects and adulteration of food products will restrict the ready meals market during the forecast period.
The working population and students prefer convenience foods such as ready-to-eat meals due to less time involved, low cost, a brilliant alternative to junk food, and minimal to no effort for cooking food. The time taken to prepare has reduced dramatically and the quantity along with variety has increased. Thus the growing popularity of packaged, time-saving food products will accelerate the growth of the ready meals market during the forecast period.
The growing trend for organic food products will drive the increasing consumption of ready meals among health-conscious consumers. The demand is picking up, especially due to the presence of wholesome nutrients and growing awareness of consumers regarding the health benefits of organic food sources. Moreover, the easy availability through online retailers and rise in the number of delivery services will propel the ready meals market in the coming years.
The covid 19 impact and the ensuing lockdowns have increased the demand for instant food products. Moreover, the shift to the remote working culture has exacerbated the demand further. As ready-to-eat meals are more convenient, consume less time, and are healthy the consumption is going to rise further in the upcoming years. Also, manufacturers are focussing on advanced packaging solutions that maintain superior food quality, texture, shelf life, color, and taste. These factors will aid in the growth of the ready meals market during the forecast period.
Ready meals or instant meals have certain ill effects on health. All frozen or packaged foods are not considered healthy. Some of them may cause health diseases in the form of diabetes, cancer, high blood pressure, and weakening of muscles. In addition to it, the growing adulteration in food products is also contributing to the problem. Consumers have increased levels of awareness regarding their health and diet. This is expected to restrain the ready meals market in the subsequent years.
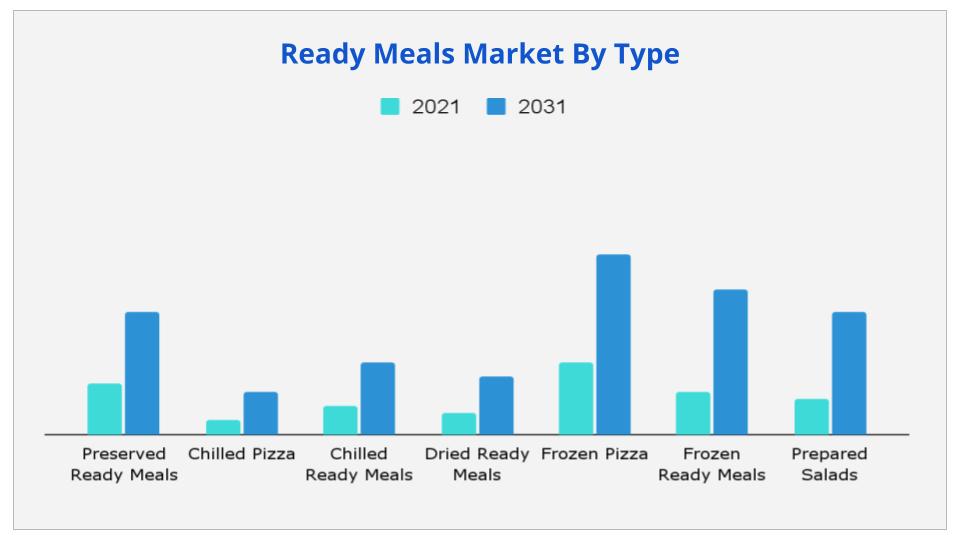
Based on type, the frozen pizza segment is expected to provide lucrative opportunities for growth in the ready meals market share. However, the chilled pizza segment will grow the fastest at a CAGR of 14.1%. Frozen pizza will maintain dominance due to the quick-cooking method, interesting ingredients mix, low cost, and enhanced nutritional quantity.

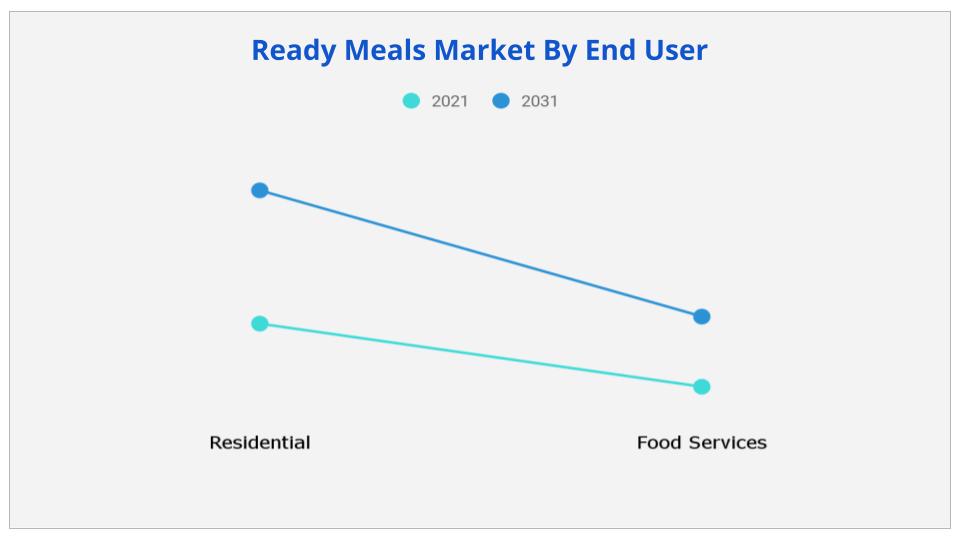
Based on end-user, the residential segment is expected to dominate in the ready meals market share. On the other hand, the food services segment will grow substantially during the forecast period.

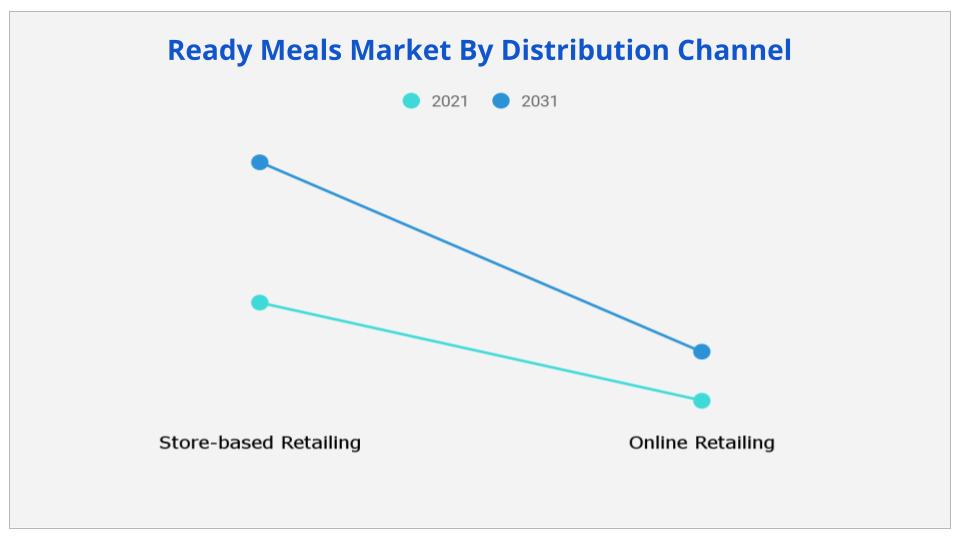
Based on the distribution channel, the store retailing segment will provide huge scope for growth in the ready meals market share as people purchase food products more from stores due to easy availability and quick access. In addition to it, the online retailing segment will grow the fastest due to increasing internet connectivity and growing mobile usage.

Based on region, Europe is expected to maintain dominance and will grow at a CAGR of 10.5% due to well developed Food and Beverage industry and growing popularity for packaged food. Asia-Pacific segment will grow the fastest with China occupying half share and India growing at a share of 12.6% till 2031.
Prominent players have adopted product launch as their key strategy to gain significant Ready Meals Market share in the market. Key players profiled in the report include Bakkavor Foods Ltd., ConAgra, Greencore Group Plc., JH Heinz Company Ltd., Nestle SA, Fleury Michon, Unilever Group, Northern Food Ltd., Kerry Foods Ltd., and Premier Foods Group Ltd.
Other players not profiled in the report include Oetker-Gruppe, Frosta AG, Campbell Soup Co, Bofrost Dienstleistungs GmbH & Co KG, Iglo Bird's Eye Frozen Foods, Freiberger Lebensmittel GmbH & Co KG, Hilcona AG, Gartenfrisch Jung GmbH, Bonduelle Groupe SA, and General Mills Inc.
|
Report Metric |
Details |
|
Base Year: |
2021 |
|
Market Size in 2021: |
USD 138.1 Billion |
|
Forecast Period: |
2022 to 2031 |
|
Forecast Period 2022 to 2031 CAGR: |
11.9% |
|
2031 Value Projection: |
USD 408.0 Billion |
|
No. of Pages: |
200 |
|
Tables & Figures |
66 |
|
Charts |
43 |
|
Segments covered: |
By Type, End-User, and Distribution Channel |
Ans. The global ready meals market size is estimated to grow at a CAGR of 11.9% over the forecast timeframe and reach a market value of around USD 408.0 billion by 2031.
Ans. The global ready meals market value was valued at US$ 138.1 billion in 2021.
Ans. The Europe region dominates the global ready meals market and is expected to retain its dominance throughout the forecast period.
Ans. The growing trend of organic food products in the ready meals sector and easy availability through distribution channels will bolster the ready meals market growth in the coming years.
Ans. The forecast period considered for the global ready meals market is 2022 to 2031.
Ans. Based on End-user, The Residential segment dominates the global ready meals market and is expected to retain its dominance throughout the forecast period.
CHAPTER 1: INTRODUCTION
1.1.Report Description
1.2.Key Market Segments
1.3.Key Benefits
1.4.Research Methodology
1.4.1.Primary Research
1.4.2.Secondary Research
1.4.3.Analyst Tools and Models
CHAPTER 2: EXECUTIVE SUMMARY
2.1.CXO Perspective
CHAPTER 3: MARKET LANDSCAPE
3.1.Market Definition and Scope
3.2.Key Findings
3.2.1.Top Investment Pockets
3.2.2.Top Winning Strategies
3.3.Porter's Five Forces Analysis
3.3.1.Bargaining Power of Suppliers
3.3.2.Threat of New Entrants
3.3.3.Threat of Substitutes
3.3.4.Competitive Rivalry
3.3.5.Bargaining Power among Buyers
3.4.Market Share Analysis/Top Player Positioning
3.4.1.Market Share Analysis/Top Player Positioning 2020
3.5.Market Dynamics
3.5.1.Drivers
3.5.2.Restraints
3.5.3.Opportunities
3.6.COVID-19 Impact Analysis
3.8.Value Chain Analysis
3.9.List of Value Chain Players
CHAPTER 4: READY MEALS MARKET, BY TYPE
4.1.Market Overview
4.1.1Market Size and Forecast, By Type
4.2.Canned Preserved Ready Meals
4.2.1.Key Market Trends, Growth Factors and Opportunities
4.2.2.Market Size and Forecast, By Country
4.3.Chilled Pizza
4.3.1.Key Market Trends, Growth Factors and Opportunities
4.3.2.Market Size and Forecast, By Country
4.4.Chilled Ready Meals
4.4.1.Key Market Trends, Growth Factors and Opportunities
4.4.2.Market Size and Forecast, By Country
4.5.Dried Ready Meals
4.5.1.Key Market Trends, Growth Factors and Opportunities
4.5.2.Market Size and Forecast, By Country
4.6.Frozen Pizza
4.6.1.Key Market Trends, Growth Factors and Opportunities
4.6.2.Market Size and Forecast, By Country
4.7.Frozen Ready Meals
4.7.1.Key Market Trends, Growth Factors and Opportunities
4.7.2.Market Size and Forecast, By Country
4.8.Prepared Salads
4.8.1.Key Market Trends, Growth Factors and Opportunities
4.8.2.Market Size and Forecast, By Country
CHAPTER 5: READY MEALS MARKET, BY END USER
5.1.Market Overview
5.1.1Market Size and Forecast, By End User
5.2.Food Services
5.2.1.Key Market Trends, Growth Factors and Opportunities
5.2.2.Market Size and Forecast, By Country
5.3.Residential
5.3.1.Key Market Trends, Growth Factors and Opportunities
5.3.2.Market Size and Forecast, By Country
CHAPTER 6: READY MEALS MARKET, BY DISTRIBUTION CHANNEL
6.1.Market Overview
6.1.1Market Size and Forecast, By Distribution Channel
6.2.Store Based Retailing
6.2.1.Key Market Trends, Growth Factors and Opportunities
6.2.2.Market Size and Forecast, By Country
6.3.Online Retailing
6.3.1.Key Market Trends, Growth Factors and Opportunities
6.3.2.Market Size and Forecast, By Country
CHAPTER 7: COMPANY PROFILES
7.1.Palman Foods
7.1.1.Company Overview
7.1.2.Key Executives
7.1.3.Company snapshot
7.1.4.Operating business segments
7.1.5.Product portfolio
7.1.6.Business Performance
7.1.7.Key Strategic Moves and Developments
7.2.Millennium Foods
7.2.1.Company Overview
7.2.2.Key Executives
7.2.3.Company snapshot
7.2.4.Operating business segments
7.2.5.Product portfolio
7.2.6.Business Performance
7.2.7.Key Strategic Moves and Developments
7.3.Gourmet Foods
7.3.1.Company Overview
7.3.2.Key Executives
7.3.3.Company snapshot
7.3.4.Operating business segments
7.3.5.Product portfolio
7.3.6.Business Performance
7.3.7.Key Strategic Moves and Developments
7.4.Fridge Foods Group
7.4.1.Company Overview
7.4.2.Key Executives
7.4.3.Company snapshot
7.4.4.Operating business segments
7.4.5.Product portfolio
7.4.6.Business Performance
7.4.7.Key Strategic Moves and Developments
7.5.McCain Foods Limited
7.5.1.Company Overview
7.5.2.Key Executives
7.5.3.Company snapshot
7.5.4.Operating business segments
7.5.5.Product portfolio
7.5.6.Business Performance
7.5.7.Key Strategic Moves and Developments
7.6.General Mills
7.6.1.Company Overview
7.6.2.Key Executives
7.6.3.Company snapshot
7.6.4.Operating business segments
7.6.5.Product portfolio
7.6.6.Business Performance
7.6.7.Key Strategic Moves and Developments
7.7.Dr. Oetker
7.7.1.Company Overview
7.7.2.Key Executives
7.7.3.Company snapshot
7.7.4.Operating business segments
7.7.5.Product portfolio
7.7.6.Business Performance
7.7.7.Key Strategic Moves and Developments
7.8.Fleury Michon SA
7.8.1.Company Overview
7.8.2.Key Executives
7.8.3.Company snapshot
7.8.4.Operating business segments
7.8.5.Product portfolio
7.8.6.Business Performance
7.8.7.Key Strategic Moves and Developments
7.9.Premier Foods Group Ltd
7.9.1.Company Overview
7.9.2.Key Executives
7.9.3.Company snapshot
7.9.4.Operating business segments
7.9.5.Product portfolio
7.9.6.Business Performance
7.9.7.Key Strategic Moves and Developments
7.10.Nestle
7.10.1.Company Overview
7.10.2.Key Executives
7.10.3.Company snapshot
7.10.4.Operating business segments
7.10.5.Product portfolio
7.10.6.Business Performance
7.10.7.Key Strategic Moves and Developments
Table 1. Ready Meals Market, By Type, 2021-2031 ($Million)
Table 2. Ready Meals Market, By End User, 2021-2031 ($Million)
Table 3. Ready Meals Market, By Distribution Channel, 2021-2031 ($Million)
Table 4.Palman Foods: Company Snapshot
Table 5.Palman Foods: Operating Segments
Table 6.Palman Foods: Product Portfolio
Table 7.Palman Foods: Key Strategic Moves And Developments
Table 8.Millennium Foods: Company Snapshot
Table 9.Millennium Foods: Operating Segments
Table 10.Millennium Foods: Product Portfolio
Table 11.Millennium Foods: Key Strategic Moves And Developments
Table 12.Gourmet Foods: Company Snapshot
Table 13.Gourmet Foods: Operating Segments
Table 14.Gourmet Foods: Product Portfolio
Table 15.Gourmet Foods: Key Strategic Moves And Developments
Table 16.Fridge Foods Group: Company Snapshot
Table 17.Fridge Foods Group: Operating Segments
Table 18.Fridge Foods Group: Product Portfolio
Table 19.Fridge Foods Group: Key Strategic Moves And Developments
Table 20.Mccain Foods Limited: Company Snapshot
Table 21.Mccain Foods Limited: Operating Segments
Table 22.Mccain Foods Limited: Product Portfolio
Table 23.Mccain Foods Limited: Key Strategic Moves And Developments
Table 24.General Mills: Company Snapshot
Table 25.General Mills: Operating Segments
Table 26.General Mills: Product Portfolio
Table 27.General Mills: Key Strategic Moves And Developments
Table 28.Dr. Oetker: Company Snapshot
Table 29.Dr. Oetker: Operating Segments
Table 30.Dr. Oetker: Product Portfolio
Table 31.Dr. Oetker: Key Strategic Moves And Developments
Table 32.Fleury Michon Sa: Company Snapshot
Table 33.Fleury Michon Sa: Operating Segments
Table 34.Fleury Michon Sa: Product Portfolio
Table 35.Fleury Michon Sa: Key Strategic Moves And Developments
Table 36.Premier Foods Group Ltd: Company Snapshot
Table 37.Premier Foods Group Ltd: Operating Segments
Table 38.Premier Foods Group Ltd: Product Portfolio
Table 39.Premier Foods Group Ltd: Key Strategic Moves And Developments
Table 40.Nestle: Company Snapshot
Table 41.Nestle: Operating Segments
Table 42.Nestle: Product Portfolio
Table 43.Nestle: Key Strategic Moves And Developments
List Of Figures
Figure 1. Ready Meals Market
Figure 2.Segmentation Of Ready Meals Market
Figure 3.Top Investment Pocket In Ready Meals Market
Figure 4.Top Winning Strategies, By Year, 2019-2021*
Figure 5.Top Winning Strategies, By Development, 2019-2021*
Figure 6.Top Winning Strategies, By Company, 2019-2021*
Figure 7.Moderate Bargaining Power Of Buyers
Figure 8.Moderate Bargaining Power Of Suppliers
Figure 9.Moderate Threat Of New Entrants
Figure 10.Low Threat Of Substitution
Figure 11.High Competitive Rivalry
Figure 12.Restraints And Drivers: Ready Meals Market
Figure 13.Ready Meals Market Segmentation, By Type
Figure 14.Ready Meals Market For Canned Preserved Ready Meals, By Country, 2021-2031 ($Million)
Figure 15.Ready Meals Market For Chilled Pizza, By Country, 2021-2031 ($Million)
Figure 16.Ready Meals Market For Chilled Ready Meals, By Country, 2021-2031 ($Million)
Figure 17.Ready Meals Market For Dried Ready Meals, By Country, 2021-2031 ($Million)
Figure 18.Ready Meals Market For Frozen Pizza, By Country, 2021-2031 ($Million)
Figure 19.Ready Meals Market For Frozen Ready Meals, By Country, 2021-2031 ($Million)
Figure 20.Ready Meals Market For Prepared Salads, By Country, 2021-2031 ($Million)
Figure 21.Ready Meals Market Segmentation, By End User
Figure 22.Ready Meals Market For Food Services, By Country, 2021-2031 ($Million)
Figure 23.Ready Meals Market For Residential, By Country, 2021-2031 ($Million)
Figure 24.Ready Meals Market Segmentation, By Distribution Channel
Figure 25.Ready Meals Market For Store Based Retailing, By Country, 2021-2031 ($Million)
Figure 26.Ready Meals Market For Online Retailing, By Country, 2021-2031 ($Million)
Figure 27.Palman Foods: Key Executives
Figure 28.Palman Foods: Net Sales, 2018-2020 ($Million)
Figure 29.Palman Foods: Revenue Share, By Segment, 2020 (%)
Figure 30.Palman Foods: Revenue Share, By Geography, 2020 (%)
Figure 31.Millennium Foods: Key Executives
Figure 32.Millennium Foods: Net Sales, 2018-2020 ($Million)
Figure 33.Millennium Foods: Revenue Share, By Segment, 2020 (%)
Figure 34.Millennium Foods: Revenue Share, By Geography, 2020 (%)
Figure 35.Gourmet Foods: Key Executives
Figure 36.Gourmet Foods: Net Sales, 2018-2020 ($Million)
Figure 37.Gourmet Foods: Revenue Share, By Segment, 2020 (%)
Figure 38.Gourmet Foods: Revenue Share, By Geography, 2020 (%)
Figure 39.Fridge Foods Group: Key Executives
Figure 40.Fridge Foods Group: Net Sales, 2018-2020 ($Million)
Figure 41.Fridge Foods Group: Revenue Share, By Segment, 2020 (%)
Figure 42.Fridge Foods Group: Revenue Share, By Geography, 2020 (%)
Figure 43.Mccain Foods Limited: Key Executives
Figure 44.Mccain Foods Limited: Net Sales, 2018-2020 ($Million)
Figure 45.Mccain Foods Limited: Revenue Share, By Segment, 2020 (%)
Figure 46.Mccain Foods Limited: Revenue Share, By Geography, 2020 (%)
Figure 47.General Mills: Key Executives
Figure 48.General Mills: Net Sales, 2018-2020 ($Million)
Figure 49.General Mills: Revenue Share, By Segment, 2020 (%)
Figure 50.General Mills: Revenue Share, By Geography, 2020 (%)
Figure 51.Dr. Oetker: Key Executives
Figure 52.Dr. Oetker: Net Sales, 2018-2020 ($Million)
Figure 53.Dr. Oetker: Revenue Share, By Segment, 2020 (%)
Figure 54.Dr. Oetker: Revenue Share, By Geography, 2020 (%)
Figure 55.Fleury Michon Sa: Key Executives
Figure 56.Fleury Michon Sa: Net Sales, 2018-2020 ($Million)
Figure 57.Fleury Michon Sa: Revenue Share, By Segment, 2020 (%)
Figure 58.Fleury Michon Sa: Revenue Share, By Geography, 2020 (%)
Figure 59.Premier Foods Group Ltd: Key Executives
Figure 60.Premier Foods Group Ltd: Net Sales, 2018-2020 ($Million)
Figure 61.Premier Foods Group Ltd: Revenue Share, By Segment, 2020 (%)
Figure 62.Premier Foods Group Ltd: Revenue Share, By Geography, 2020 (%)
Figure 63.Nestle: Key Executives
Figure 64.Nestle: Net Sales, 2018-2020 ($Million)
Figure 65.Nestle: Revenue Share, By Segment, 2020 (%)
Figure 66.Nestle: Revenue Share, By Geography, 2020 (%)
$6168
$6929
$10663
