
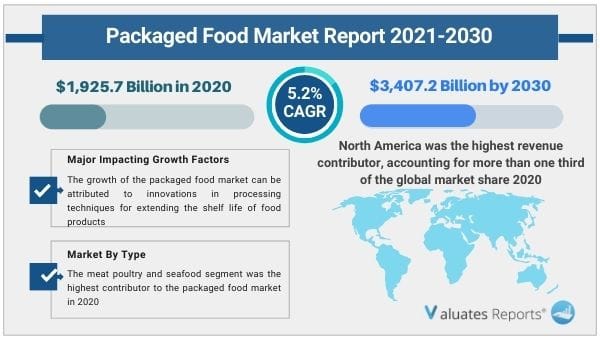
The global packaged food market size was valued at USD 1,925.7 Billion in 2020 and is projected to reach USD 3,407.2 Billion by 2030, registering a Compound Annual Growth Rate (CAGR) of 5.2% from 2021 to 2030. The meat poultry and seafood segment was the highest contributor to the packaged food market in 2020 and is estimated to grow at a Compound Annual Growth Rate (CAGR) of 4.8% during the forecast period. North America was the highest revenue contributor, accounting for more than one-third of the global market share in 2020, and is estimated to grow at a Compound Annual Growth Rate (CAGR) of 4.9% through the forecast period.
Packaged food can be defined as food stuff that has been prepared ahead of time and packaged in a way that increases its shelf life. Most packaged food are considered convenience items and are commercially produced and made available for people to consume. The concept of packaged food arose as a result of considerations such as ease of preparation, consumption, handling, and protection against external tampering. Packaged foods are simple to handle, prepare, and eat. They are gaining popularity in both developed and developing countries since they are extremely convenient for city dwellers.
Packaged food is included in the category of products that is purchased by consumers frequently. Hence, the demand for such products remains consistent among consumers. The outbreak of the novel coronavirus has significantly affected the growth of the market worldwide. There has been slight decrease in sales of packaged food products due to the disruption of the supply chain and reduction in the out-of-home consumption of food during the COVID-19 pandemic.
The growth of the packaged food market can be attributed to innovations in processing techniques for extending the shelf life of food products. Furthermore, changes in food consumption patterns bought upon by the increasing working population all around the world drives the market growth. Improvement in the retail infrastructure has increased the availability of packaged goods and this growing ease of acquiring food stuff combined with options of free home delivery and different promotional offers has led to the growth of global packaged food market. However, the notion among consumers about the negative effects of packaged products hinders growth and act as the major restraint to the global market. On the contrary, the packaged food sector is being propelled forward by constant market innovation, which is being bolstered by rising consumer demand. Additionally, specific consumer demands, such as organic food, clean label food ingredients, vegan food, dairy-free products, and others, are expected to open avenues for the packaged food market growth.
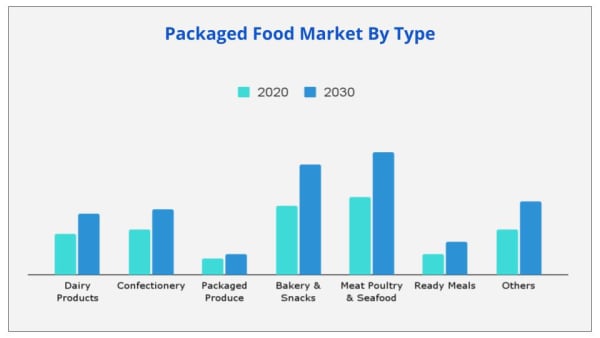
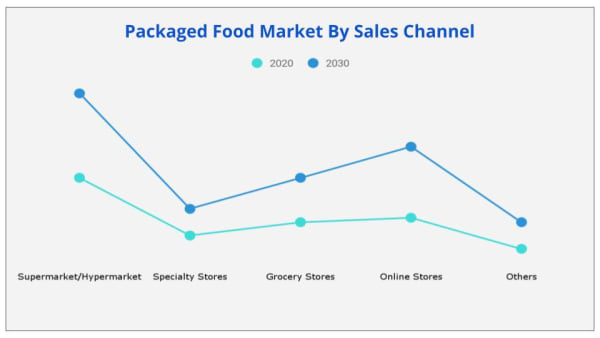
The packaged food market is segmented on the basis of type, sales channel, and region. On the basis of type, the market is categorized into dairy products, confectionery, packaged products, bakery & snacks, meat, poultry & seafood, ready meals, others (sauces & condiments, baby food, soups, spread & dips). Depending on sales channel, it is fragmented into supermarkets/hypermarkets, specialty stores, grocery stores, online stores, and others (convenience stores & departmental stores). Region wise, it is analyzed across North America (the U.S., Canada, and Mexico), Europe (Germany, France, the UK, Italy, Spain, Russia, and rest of Europe), Asia-Pacific (China, Japan, Australia, South Korea, India, Indonesia and rest of Asia-Pacific), and LAMEA (Latin America, Middle East, and Africa).
Depending on the global packaged food market analysis by type, the meat poultry and seafood segment accounted for the highest share in 2020. The meat poultry and seafood segment is growing manifold due to growing consumption of protein rich foodstuff owing to it being considered healthy. Furthermore, growing dependence on conveniently packaged meat due to increased affinity of people towards convenience drives the market growth for this segment. However, the ready meals segment was the fastest growing segment throughout the forecast period.
Depending on the global packaged food market forecast by sales channel, the hypermarkets/supermarkets segment accounted for the highest share in 2020. The growth in the hypermarkets/supermarkets in the packaged food market can be attributed to the fact that these retail format(s) offers a wide variety of products and often come up with different offers that help increase foot fall, thereby, increasing potential sales of goods. However, the online stores segment in the packaged food market was the fastest growing segment throughout the forecast period.
Region wise, North America was the most prominent region in the packaged food market in 2020, and is expected to exhibit high growth rate during the forecast period. Europe and North America are expected to witness steady growth rate throughout the forecast period, owing to the presence of a large number of local players.
The players in the packaged food industry have adopted product launch as their key development strategy to increase profitability and improve their stance in the packaged food market share. The key players profiled in the report include Conagra Brands, Inc., General Mills Inc. Hormel Foods Corporation, JBS S.A., Kellogg Company, Maple Leaf Foods Inc., Nestle S.A., The Kraft Heinz Company, Tyson Foods, Inc., WH Group.
| Report Metric | Details |
| Report Name | Packaged Food Market |
| The market size in 2020 | USD 1,925.7 Billion |
| The revenue forecast in 2030 | USD 3,407.2 Billion |
| Growth Rate | CAGR 5.2% |
| Market size available for years | 2021-2030 |
| Forecast units | Value (USD) |
| Segments covered | Type, Application, Industry, Regions |
| Report coverage | Revenue & volume forecast, company share, competitive landscape, growth factors, and trends |
| Geographic regions covered | North America, Europe, Asia Pacific, Latin America, Middle East & Africa |
Ans. The global packaged food market size was valued at $1,925.7 billion in 2020 and is projected to reach $3,407.2 billion by 2030, registering a Compound Annual Growth Rate (CAGR) of 5.2% from 2021 to 2030
Ans. Packaged Food market development is fueled by changes in food consumption patterns brought on by the world's growing working population.
Ans. Based on distribution channels, the hypermarkets/supermarkets segment was the highest contributor to the market, with $182.3 billion in 2020, and is estimated to reach $315.3 billion by 2030, at a CAGR of 4.9% during the forecast period.
Ans. The key players profiled in the report include Conagra Brands, Inc., General Mills Inc. Hormel Foods Corporation, JBS S.A., Kellogg Company, Maple Leaf Foods Inc., Nestle S.A., The Kraft Heinz Company, Tyson Foods, Inc., WH Group.
Ans. North America is and will provide more business opportunities for Packaged Food in future.
CHAPTER 1:INTRODUCTION
1.1.Report description
1.2.Key benefits for stakeholders
1.3.Key market segments
1.4.Research methodology
1.4.1.Secondary research
1.4.2.Primary research
1.5.Analyst tools and models
CHAPTER 2:EXECUTIVE SUMMARY
2.1.Packaged Food market snapshot
2.2.Key findings of the study
2.3.CXO perspective
CHAPTER 3:MARKET OVERVIEW
3.1.Market definition and scope
3.2.Key findings
3.2.1.Top investment pockets
3.3.Porter's five forces analysis
3.4.Market dynamics
3.4.1.Drivers
3.4.1.1.Growing affinity of consumers towards convenience
3.4.1.2.Expansion of the F&B industry
3.4.1.3.Expanding retail market
3.4.2.Restraints
3.4.2.1.Food contamination and disease
3.4.2.2.Stringent government regulations
3.4.2.3.Growing health awareness regarding preservatives and chemicals
3.4.3.Opportunity
3.4.3.1.Innovation
3.5.COVID-19 impact analysis
3.5.1.Introduction
3.5.2.Impact on the packaged food industry
3.6.Value Chain Analysis
3.7.Top Impacting Factor
CHAPTER 4:PACKAGED FOOD MARKET, BY TYPE
4.1.Overview
4.1.1.Market size and forecast
4.2.Dairy Products
4.2.1.Key market trends, growth factors, and opportunities
4.2.2.Market size and forecast, by region
4.2.3.Market size and forecast, by country
4.3.Confectionery
4.3.1.Key market trends, growth factors, and opportunities
4.3.2.Market size and forecast, by region
4.3.3.Market size and forecast, by country
4.4.Packaged Produce
4.4.1.Key market trends, growth factors, and opportunities
4.4.2.Market size and forecast, by region
4.4.3.Market size and forecast, by country
4.5.Bakery & Snacks
4.5.1.Key market trends, growth factors, and opportunities
4.5.2.Market size and forecast, by region
4.5.3.Market size and forecast, by country
4.6.Meat, Poultry & Seafood
4.6.1.Key market trends, growth factors, and opportunities
4.6.2.Market size and forecast, by region
4.6.3.Market size and forecast, by country
4.7.Ready Meals
4.7.1.Key market trends, growth factors, and opportunities
4.7.2.Market size and forecast, by region
4.7.3.Market size and forecast, by country
4.8.Others
4.8.1.Key market trends, growth factors, and opportunities
4.8.2.Market size and forecast, by region
4.8.3.Market size and forecast, by country
CHAPTER 5:PACKAGED FOOD MARKET, BY SALES CHANNEL
5.1.Overview
5.1.1.Market size and forecast
5.2.Supermarket/Hypermarket
5.2.1.Key market trends, growth factors, and opportunities
5.2.2.Market size and forecast, by region
5.2.3.Market size and forecast, by country
5.3.Specialty Stores
5.3.1.Key market trends, growth factors, and opportunities
5.3.2.Market size and forecast, by region
5.3.3.Market size and forecast, by country
5.4.Grocery Stores
5.4.1.Key market trends, growth factors, and opportunities
5.4.2.Market size and forecast, by region
5.4.3.Market size and forecast, by country
5.5.Online Stores
5.5.1.Key market trends, growth factors, and opportunities
5.5.2.Market size and forecast, by region
5.5.3.Market size and forecast, by country
5.6.Others
5.6.1.Key market trends, growth factors, and opportunities
5.6.2.Market size and forecast, by region
5.6.3.Market size and forecast, by country
CHAPTER 6:PACKAGED FOOD MARKET, BY REGION
6.1.Overview
6.1.1.Market size and forecast, by region
6.2.North America
6.2.1.Key market trends, growth factors, and opportunities
6.2.2.Market size and forecast, by type
6.2.3.Market size and forecast, by sales channel
6.2.4.Market size and forecast, by country
6.2.5.U.S.
6.2.5.1.Market size and forecast, by type
6.2.5.2.Market size and forecast, by sales channel
6.2.6.CANADA
6.2.6.1.Market size and forecast, by type
6.2.6.2.Market size and forecast, by sales channel
6.2.7.MEXICO
6.2.7.1.Market size and forecast, by type
6.2.7.2.Market size and forecast, by sales channel
6.3.Europe
6.3.1.Key market trends, growth factors, and opportunities
6.3.3.Market size and forecast, by type
6.3.4.Market size and forecast, by sales channel
6.3.5.Market size and forecast, by country
6.3.6.GERMANY
6.3.6.1.Market size and forecast, by type
6.3.6.2.Market size and forecast, by sales channel
6.3.7.UK
6.3.7.1.Market size and forecast, by type
6.3.7.2.Market size and forecast, by sales channel
6.3.8.FRANCE
6.3.8.1.Market size and forecast, by type
6.3.8.2.Market size and forecast, by sales channel
6.3.9.ITALY
6.3.9.1.Market size and forecast, by type
6.3.9.2.Market size and forecast, by sales channel
6.3.10.SPAIN
6.3.10.1.Market size and forecast, by type
6.3.10.2.Market size and forecast, by sales channel
6.3.11.RUSSIA
6.3.11.1.Market size and forecast, by type
6.3.11.2.Market size and forecast, by sales channel
6.3.12.REST OF EUROPE
6.3.12.1.Market size and forecast, by type
6.3.12.2.Market size and forecast, by sales channel
6.4.Asia-Pacific
6.4.1.Key market trends, growth factors, and opportunities
6.4.2.Market size and forecast, by type
6.4.3.Market size and forecast, by sales channel
6.4.4.Market size and forecast, by country
6.4.5.CHINA
6.4.5.1.Market size and forecast, by type
6.4.5.2.Market size and forecast, by sales channel
6.4.6.INDIA
6.4.6.1.Market size and forecast, by type
6.4.6.2.Market size and forecast, by sales channel
6.4.7.JAPAN
6.4.7.1.Market size and forecast, by type
6.4.7.2.Market size and forecast, by sales channel
6.4.8.SOUTH KOREA
6.4.8.1.Market size and forecast, by type
6.4.8.2.Market size and forecast, by sales channel
6.4.9.AUSTRALIA
6.4.9.1.Market size and forecast, by type
6.4.9.2.Market size and forecast, by sales channel
6.4.10.INDONESIA
6.4.10.1.Market size and forecast, by type
6.4.10.2.Market size and forecast, by sales channel
6.4.11.REST OF ASIA-PACIFIC
6.4.11.1.Market size and forecast, by type
6.4.11.2.Market size and forecast, by sales channel
6.5.LAMEA
6.5.1.Key market trends, growth factors, and opportunities
6.5.2.LATIN AMERICA
6.5.2.1.Market size and forecast, by type
6.5.2.2.Market size and forecast, by sales channel
6.5.3.MIDDLE EAST
6.5.3.1.Market size and forecast, by type
6.5.3.2.Market size and forecast, by sales channel
6.5.4.AFRICA
6.5.4.1.Market size and forecast, by type
6.5.4.2.Market size and forecast, by sales channel
CHAPTER 7:COMPETITION LANDSCAPE
7.1.Top winning strategies
7.2.Product mapping
7.3.Competitive dashboard
7.4.Competitive heat map
7.5.Key developments
7.5.1.Acquisition
7.5.2.Business Expansion
7.5.3.Product Launch
CHAPTER 8:COMPANY PROFILES
8.1.CONAGRA BRANDS, INC.
8.1.1.Company overview
8.1.2.Key Executives
8.1.3.Company snapshot
8.1.4.Operating business segments
8.1.5.Product portfolio
8.1.6.R&D Expenditure
8.1.7.Business performance
8.1.8.Key strategic moves and developments
8.2.GENERAL MILLS INC.
8.2.1.Company overview
8.2.2.Key Executives
8.2.3.Company snapshot
8.2.4.Operating business segments
8.2.5.Product portfolio
8.2.6.R&D Expenditure
8.2.7.Business performance
8.2.8.Key strategic moves and developments
8.3.HORMEL FOODS CORPORATION
8.3.1.Company overview
8.3.2.Key Executives
8.3.3.Company snapshot
8.3.4.Operating business segments
8.3.5.Product portfolio
8.3.6.R&D Expenditure
8.3.7.Business performance
8.3.8.Key strategic moves and developments
8.4.JBS S.A.
8.4.1.Company overview
8.4.2.Key Executives
8.4.3.Company snapshot
8.4.4.Product portfolio
8.4.5.Business performance
8.5.KELLOGG COMPANY
8.5.1.Company overview
8.5.2.Key Executives
8.5.3.Company snapshot
8.5.4.Product portfolio
8.5.5.R&D Expenditure
8.5.6.Business performance
8.5.7.Key strategic moves and developments
8.6.MAPLE LEAF FOODS INC.
8.6.1.Company overview
8.6.2.Key Executives
8.6.3.Company snapshot
8.6.4.Operating business segments
8.6.5.Product portfolio
8.6.6.Business performance
8.6.7.Key strategic moves and developments
8.7.NESTLE S.A.
8.7.1.Company overview
8.7.2.Key Executives
8.7.3.Company snapshot
8.7.4.Product portfolio
8.7.5.R&D Expenditure
8.7.6.Business performance
8.7.7.Key strategic moves and developments
8.8.THE KRAFT HEINZ COMPANY
8.8.1.Company overview
8.8.2.Key Executives
8.8.3.Company snapshot
8.8.4.Operating business segments
8.8.5.Product portfolio
8.8.6.R&D Expenditure
8.8.7.Business performance
8.9.TYSON FOODS, INC.
8.9.1.Company overview
8.9.2.Key Executives
8.9.3.Company snapshot
8.9.4.Operating business segments
8.9.5.Product portfolio
8.9.6.R&D Expenditure
8.9.7.Business performance
8.10.WH GROUP
8.10.1.Company overview
8.10.2.Key Executives
8.10.3.Company snapshot
8.10.4.Operating business segments
8.10.5.Product portfolio
8.10.6.R&D Expenditure
8.10.7.Business performance
Table 01.Packaged Food Market, By Type, 2020-2030 ($Billion)
Table 02.Packaged Food Market For Dairy Products, By Region, 2020-2030 ($Billion)
Table 03.Packaged Food Market For Confectionery, By Region, 2020-2030 ($Billion)
Table 04.Packaged Food Market For Packaged Produce, By Region, 2020-2030 ($Billion)
Table 05.Packaged Food Market For Bakery & Snacks, By Region, 2020-2030 ($Billion)
Table 06.Packaged Food Market For Meat, Poultry & Seafood, By Region, 2020-2030 ($Billion)
Table 07.Packaged Food Market For Ready Meals, By Region, 2020-2030 ($Billion)
Table 08.Packaged Food Market For Others, By Region, 2020-2030 ($Billion)
Table 09.Packaged Food Market, By Sales Channel, 2020-2030 ($Billion)
Table 10.Packaged Food Market Revenue For Supermarket/Hypermarket, By Region, 2020-2030 ($Billion)
Table 11.Packaged Food Market Revenue For Specialty Stores, By Region, 2020-2030 ($Billion)
Table 12.Packaged Food Market Revenue For Grocery Stores, By Region, 2020-2030 ($Billion)
Table 13.Packaged Food Market Revenue For Online Stores, By Region, 2020-2030 ($Billion)
Table 14.Packaged Food Market Revenue For Others, By Region, 2020-2030 ($Billion)
Table 15.Packaged Food Market, By Type, 2020-2030 ($Billion)
Table 16.North America Packaged Food Market, By Type, 2020-2030 ($Billion)
Table 17.North America Packaged Food Market, By Sales Channel, 2020-2030 ($Billion)
Table 18.North America Packaged Food Market, By Type, 2020-2030 ($Billion)
Table 19.U.S. Packaged Food Market, By Type, 2020-2030 ($Billion)
Table 20.U.S. Packaged Food Market, By Sales Channel, 2020-2030 ($Billion)
Table 21.Canada Packaged Food Market, By Type, 2020-2030 ($Billion)
Table 22.Canada Packaged Food Market, By Sales Channel, 2020-2030 ($Billion)
Table 23.Mexico Packaged Food Market, By Type, 2020-2030 ($Billion)
Table 24.Mexico Packaged Food Market, By Sales Channel, 2020-2030 ($Billion)
Table 25.Europe Packaged Food Market, By Type, 2020-2030 ($Billion)
Table 26.Europe Packaged Food Market, By Sales Channel, 2020-2030 ($Billion)
Table 27.Europe Packaged Food Market, By Type, 2020-2030 ($Billion)
Table 28.Germany Packaged Food Market, By Type, 2020-2030 ($Billion)
Table 29.Germany Packaged Food Market, By Sales Channel, 2020-2030 ($Billion)
Table 30.Uk Packaged Food Market, By Type, 2020-2030 ($Billion)
Table 31.Uk Packaged Food Market, By Sales Channel, 2020-2030 ($Billion)
Table 32.France Packaged Food Market, By Type, 2020-2030 ($Billion)
Table 33.France Packaged Food Market, By Sales Channel, 2020-2030 ($Billion)
Table 34.Italy Packaged Food Market, By Type, 2020-2030 ($Billion)
Table 35.Italy Packaged Food Market, By Sales Channel, 2020-2030 ($Billion)
Table 36.Spain Packaged Food Market, By Type, 2020-2030 ($Billion)
Table 37.Spain Packaged Food Market, By Sales Channel, 2020-2030 ($Billion)
Table 38.Russia Packaged Food Market, By Type, 2020-2030 ($Billion)
Table 39.Russia Packaged Food Market, By Sales Channel, 2020-2030 ($Billion)
Table 40.Rest Of Europe Packaged Food Market, By Type, 2020-2030 ($Billion)
Table 41.Rest Of Europe Packaged Food Market, By Sales Channel, 2020-2030 ($Billion)
Table 42.Asia-Pacific Packaged Food Market, By Type, 2020-2030 ($Billion)
Table 43.Asia-Pacific Packaged Food Market, By Sales Channel, 2020-2030 ($Billion)
Table 44.Asia-Pacific Packaged Food Market, By Type, 2020-2030 ($Billion)
Table 45.China Packaged Food Market, By Type, 2020-2030 ($Billion)
Table 46.China Packaged Food Market, By Sales Channel, 2020-2030 ($Billion)
Table 47.India Packaged Food Market, By Type, 2020-2030 ($Billion)
Table 48.India Packaged Food Market, By Sales Channel, 2020-2030 ($Billion)
Table 49.Japan Packaged Food Market, By Type, 2020-2030 ($Billion)
Table 50.Japan Packaged Food Market, By Sales Channel, 2020-2030 ($Billion)
Table 51.South Korea Packaged Food Market, By Type, 2020-2030 ($Billion)
Table 52.South Korea Packaged Food Market, By Sales Channel, 2020-2030 ($Billion)
Table 53.Australia Packaged Food Market, By Type, 2020-2030 ($Billion)
Table 54.Australia Packaged Food Market, By Sales Channel, 2020-2030 ($Billion)
Table 55.Indonesia Packaged Food Market, By Type, 2020-2030 ($Billion)
Table 56.Indonesia Packaged Food Market, By Sales Channel, 2020-2030 ($Billion)
Table 57.Rest Of Asia-Pacific Packaged Food Market, By Type, 2020-2030 ($Billion)
Table 58.Rest Of Asia-Pacific Packaged Food Market, By Sales Channel, 2020-2030 ($Billion)
Table 59.Lamea Packaged Food Market, By Type, 2020-2030 ($Billion)
Table 60.Lamea Packaged Food Market, By Sales Channel, 2020-2030 ($Billion)
Table 61.Lamea Packaged Food Market, By Type, 2020-2030 ($Billion)
Table 62.Latin America Packaged Food Market, By Type, 2020-2030 ($Billion)
Table 63.Latin America Packaged Food Market, By Sales Channel, 2020-2030 ($Billion)
Table 64.Middle East Packaged Food Market, By Type, 2020-2030 ($Billion)
Table 65.Middle East Packaged Food Market, By Sales Channel, 2020-2030 ($Billion)
Table 66.Africa Packaged Food Market, By Type, 2020-2030 ($Billion)
Table 67.Africa Packaged Food Market, By Sales Channel, 2020-2030 ($Billion)
Table 68.Conagra Brands, Inc.: Key Executives
Table 69.Conagra Brands, Inc.: Company Snapshot
Table 70.Conagra Brands, Inc.: Operating Segments
Table 71.Conagra Brands, Inc.: Product Portfolio
Table 72.Conagra Brands, Inc.: R&D Expenditure, 2018–2020 ($Million)
Table 73.Conagra Brands, Inc.: Net Sales, 2018–2020 ($Million)
Table 74.General Mills Inc.: Key Executives
Table 75.General Mills Inc.: Company Snapshot
Table 76.General Mills Inc.: Operating Segments
Table 77.General Mills Inc.: Product Portfolio
Table 78.General Mills Inc.: R&D Expenditure, 2018–2020 ($Million)
Table 79.General Mills Inc.: Net Sales, 2018–2020 ($Million)
Table 80.Hormel Foods Corporation: Key Executives
Table 81.Hormel Foods Corporation: Company Snapshot
Table 82.Hormel Foods Corporation: Operating Segments
Table 83.Hormel Foods Corporation: Product Portfolio
Table 84.Hormel Foods Corporation: R&D Expenditure, 2018–2020 ($Million)
Table 85.Hormel Foods Corporation: Net Sales, 2018–2020 ($Million)
Table 86.Jbs S.A.: Key Executives
Table 87.Jbs S.A.: Company Snapshot
Table 88.Jbs S.A.: Product Portfolio
Table 89.Jbs S.A.: Net Sales, 2018–2020 ($Million)
Table 90.Kellogg Company: Key Executives
Table 91.Kellogg Company: Company Snapshot
Table 92.Kellogg Company: Product Portfolio
Table 93.Kellogg Company: R&D Expenditure, 2017–2019 ($Million)
Table 94.Kellogg Company: Net Sales, 2018–2020 ($Million)
Table 95.Maple Leaf Foods Inc.: Key Executives
Table 96.Maple Leaf Foods Inc.: Company Snapshot
Table 97.Maple Leaf Foods Inc.: Operating Segments
Table 98.Maple Leaf Foods Inc.: Product Portfolio
Table 99.Maple Leaf Foods Inc.: Net Sales, 2018–2020 ($Million)
Table 100.Nestle S.A.: Key Executives
Table 101.Nestle S.A.: Company Snapshot
Table 102.Nestle S.A.: Product Portfolio
Table 103.Nestle S.A.: R&D Expenditure, 2018–2020 ($Million)
Table 104.Nestle S.A.: Net Sales, 2018–2020 ($Million)
Table 105.The Kraft Heinz Company : Key Executives
Table 106.The Kraft Heinz Company : Company Snapshot
Table 107.The Kraft Heinz Company : Operating Segments
Table 108.The Kraft Heinz Company : Product Portfolio
Table 109.The Kraft Heinz Company: R&D Expenditure, 2018–2020 ($Million)
Table 110.The Kraft Heinz Company: Net Sales, 2018–2020 ($Million)
Table 111.Tyson Foods, Inc. : Key Executives
Table 112.Tyson Foods, Inc. : Company Snapshot
Table 113.Tyson Foods, Inc. : Operating Segments
Table 114.Tyson Foods, Inc. : Product Portfolio
Table 115.Tyson Foods, Inc. : R&D Expenditure, 2018–2020 ($Million)
Table 116.Tyson Foods, Inc. : Net Sales, 2018–2020 ($Million)
Table 117.Wh Group : Key Executives
Table 118.Wh Group : Company Snapshot
Table 119.Wh Group : Operating Segments
Table 120.Wh Group : Product Portfolio
Table 121.Wh Group : R&D Expenditure, 2018–2020 ($Million)
Table 122.Wh Group : Net Sales, 2018–2020 ($Million)
List Of Figures
Figure 01.Packaged Food Market Segmentation
Figure 02.Packaged Food Market, 2020–2030
Figure 03.Top Investment Pocket, By Country
Figure 04.Moderate Bargaining Power Of Suppliers
Figure 05.Moderate Bargaining Power Of Buyers
Figure 06.Moderate Threat Of New Entrants
Figure 07.High Threat Of Substitutes
Figure 08.Moderate Intensity Of Competitive Rivalry
Figure 09.Packaged Food Market: Drivers, Restraints, And Opportunities
Figure 10.Value Chain Analysis: Packaged Food Market
Figure 11.Top Impacting Factor: Packaged Food Market
Figure 12.Packaged Food Market, By Type, 2020 (%)
Figure 13.Comparative Share Analysis Of Packaged Food Market For Dairy Products, By Country, 2020-2030 (%)
Figure 14.Comparative Share Analysis Of Packaged Food Market For Confectionery, By Country, 2020-2030 (%)
Figure 15.Comparative Share Analysis Of Packaged Food Market For Packaged Produce, By Country, 2020-2030 (%)
Figure 16.Comparative Share Analysis Of Packaged Food Market For Bakery & Snacks, By Country, 2020-2030 (%)
Figure 17.Comparative Share Analysis Of Packaged Food Market For Meat, Poultry & Seafood, By Country, 2020-2030 (%)
Figure 18.Comparative Share Analysis Of Packaged Food Market For Ready Meals, By Country, 2020-2030 (%)
Figure 19.Comparative Share Analysis Of Packaged Food Market For Others, By Country, 2020-2030 (%)
Figure 20.Packaged Food Market, By Sales Channel, 2020 (%)
Figure 21.Comparative Share Analysis Of Packaged Food Market For Supermarket/Hypermarket, By Country, 2020-2030 (%)
Figure 22.Comparative Share Analysis Of Packaged Food Market For Specialty Stores, By Country, 2020-2030 (%)
Figure 23.Comparative Share Analysis Of Packaged Food Market For Grocery Stores, By Country, 2020-2030 (%)
Figure 24.Comparative Share Analysis Of Packaged Food Market For Online Stores, By Country, 2020-2030 (%)
Figure 25.Comparative Share Analysis Of Packaged Food Market For Others, By Country, 2020-2030 (%)
Figure 26.Packaged Food Market, By Region, 2020 (%)
Figure 27.U.S. Packaged Food Market Revenue, 2020–2030 ($Billion)
Figure 28.Canada Packaged Food Market Revenue, 2020–2030 ($Billion)
Figure 29.Mexico Packaged Food Market Revenue, 2020–2030 ($Billion)
Figure 30.Germany Packaged Food Market Revenue, 2020–2030 ($Billion)
Figure 31.Uk Packaged Food Market Revenue, 2020–2030 ($Billion)
Figure 32.France Packaged Food Market Revenue, 2020–2030 ($Billion)
Figure 33.Italy Packaged Food Market Revenue, 2020–2030 ($Billion)
Figure 34.Spain Packaged Food Market Revenue, 2020–2030 ($Billion)
Figure 35.Russia Packaged Food Market Revenue, 2020–2030 ($Billion)
Figure 36.Rest Of Europe Packaged Food Market Revenue, 2020–2030 ($Billion)
Figure 37.China Packaged Food Market Revenue, 2020–2030 ($Billion)
Figure 38.India Packaged Food Market Revenue, 2020–2030 ($Billion)
Figure 39.Japan Packaged Food Market Revenue, 2020–2030 ($Billion)
Figure 40.South Korea Packaged Food Market Revenue, 2020–2030 ($Billion)
Figure 41.Australia Packaged Food Market Revenue, 2020–2030 ($Billion)
Figure 42.Indonesia Packaged Food Market Revenue, 2020–2030 ($Billion)
Figure 43.Rest Of Asia-Pacific Packaged Food Market Revenue, 2020–2030 ($Billion)
Figure 44.Latin America Packaged Food Market Revenue, 2020–2030 ($Billion)
Figure 45.Middle East Packaged Food Market Revenue, 2020–2030 ($Billion)
Figure 46.Africa Packaged Food Market Revenue, 2020–2030 ($Billion)
Figure 47.Top Winning Strategies, By Year, 2017–2020*
Figure 48.Top Winning Strategies, By Development, 2017–2020* (%)
Figure 49.Top Winning Strategies, By Company, 2017–2020*
Figure 50.Product Mapping Of Top 10 Key Players
Figure 51.Competitive Dashboard Of Top 10 Key Players
Figure 52.Competitive Heatmap Of Top 10 Key Players
Figure 53.Conagra Brands, Inc.: R&D Expenditure, 2018–2020 ($Million)
Figure 54.Conagra Brands, Inc.: Net Sales, 2018–2020 ($Million)
Figure 55.Conagra Brands, Inc.: Revenue Share By Segment, 2020 (%)
Figure 56.General Mills Inc.: R&D Expenditure, 2018–2020 ($Million)
Figure 57.General Mills Inc.: Net Sales, 2018–2020 ($Million)
Figure 58.General Mills Inc.: Revenue Share By Segment, 2020 (%)
Figure 59.General Mills Inc.: Revenue Share By Region, 2020 (%)
Figure 60.Hormel Foods Corporation: R&D Expenditure, 2018–2020 ($Million)
Figure 61.Hormel Foods Corporation: Net Sales, 2018–2020 ($Million)
Figure 62.Hormel Foods Corporation: Revenue Share By Segment, 2020 (%)
Figure 63.Hormel Foods Corporation: Revenue Share By Region, 2020 (%)
Figure 64.Jbs S.A.: Net Sales, 2018–2020 ($Million)
Figure 65.Kellogg Company: R&D Expenditure, 2018–2020 ($Million)
Figure 66.Kellogg Company: Net Sales, 2018–2020 ($Million)
Figure 67.Kellogg Company: Revenue Share By Region, 2020 (%)
Figure 68.Maple Leaf Foods Inc.: Net Sales, 2018–2020 ($Million)
Figure 69.Maple Leaf Foods Inc.: Revenue Share By Segment, 2020 (%)
Figure 70.Nestle S.A.: R&D Expenditure, 2018–2020 ($Million)
Figure 71.Nestle S.A.: Net Sales, 2018–2020 ($Million)
Figure 72.Nestle S.A.: Revenue Share By Region, 2020 (%)
Figure 73.The Kraft Heinz Company: R&D Expenditure, 2018–2020 ($Million)
Figure 74.The Kraft Heinz Company: Net Sales, 2018–2020 ($Million)
Figure 75.The Kraft Heinz Company: Revenue Share By Segment, 2020 (%)
Figure 76.Tyson Foods, Inc. : R&D Expenditure, 2018–2020 ($Million)
Figure 77.Tyson Foods, Inc. : Net Sales, 2018–2020 ($Million)
Figure 78.Tyson Foods, Inc.: Revenue Share By Segment, 2020 (%)
Figure 79.Wh Group : R&D Expenditure, 2018–2020 ($Million)
Figure 80.Wh Group : Net Sales, 2018–2020 ($Million)
Figure 81.Wh Group: Revenue Share By Segment, 2020 (%)
Figure 82.Wh Group: Revenue Share By Region, 2020 (%)
$5769
$9995
HAVE A QUERY?
OUR CUSTOMER

SIMILAR REPORTS