
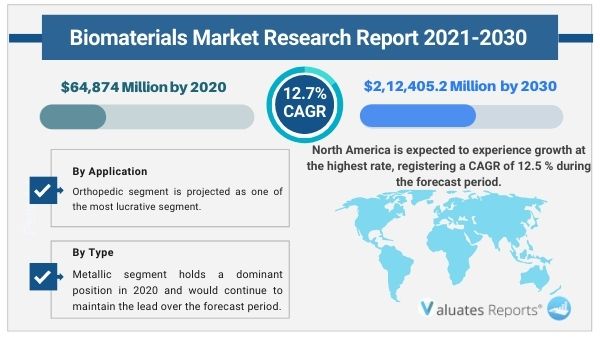
The global biomaterials market size was valued at US$ 64874 million in 2020 and is expected to reach US$ 212405.2 million by 2030 growing at a CAGR of 12.7% from 2021 to 2030. Key drivers of the biomaterials market include the growing geriatric population and increasing prevalence of cardiovascular, orthopedic diseases.
The increasing awareness levels regarding the benefits of implantable devices and biomaterial products will spur the growth of the biomaterials market during the forecast period. Also, rapid technological advancements in the medical sector will significantly boost market expansion. Moreover, huge investments by government authorities and R&D initiatives by laboratories, clinics, research institutes will create huge potential for market growth in the future.
However, high costs and complications in biocompatibility and implantation will restrict the biomaterials market penetration during the forecast period.
The biomaterials market growth is spurred by a variety of factors. The geriatric population is growing worldwide. People are suffering from cardiovascular and orthopedic disorders which cause irreversible damage due to injured tissues. The physical damage caused to the organs such as defective joints, bones, and heart valves is painful and cannot be prevented fully with medications. Hence doctors and surgeons use biomaterial devices such as cardiac implants, knee replacement, etc for tissue regeneration. This gives patients better health outcomes. Hence biomaterial devices are being used extensively by healthcare professionals.
Implantation and biomaterials are gaining worldwide acceptance as people are realizing the benefits of tissue regeneration. They relieve pain, increase mobility, alleviate symptoms, and improve the overall quality of life. Moreover, the rapid technological advancements such as self-healing properties, 3D hydrophilic polymeric networks, shape emulation, skin grafting, scaffolding, and extensive use in plastic surgeries, wound healing, neurological disorders are shaping up the entire industry. These factors will substantially increase the growth of the biomaterials market during the forecast period.
Government authorities, clinics, laboratories, and research institutions are pouring investments into medical implantation and tissue regeneration. Debilitating diseases cause a huge burden on healthcare infrastructure and decrease the patient’s overall well-being. Hence there is a growing number of research and development activities by scientists, clinicians to replace or regenerate damaged tissue or organs thereby improving health conditions or even solving certain congenital flaws. These factors will boost the growth of the biomaterials market in the coming years.
Biomaterials are costly. There are a number of risks associated with medical implants such as surgical risks related to placement, removal, and infection. Moreover, there are biocompatibility issues as patients' bodies may reject or react in a dangerous way to materials used in these implants. There can be pain, swelling, redness, or other reactions These factors will altogether restrict the growth of the biomaterials market during the forecast period.
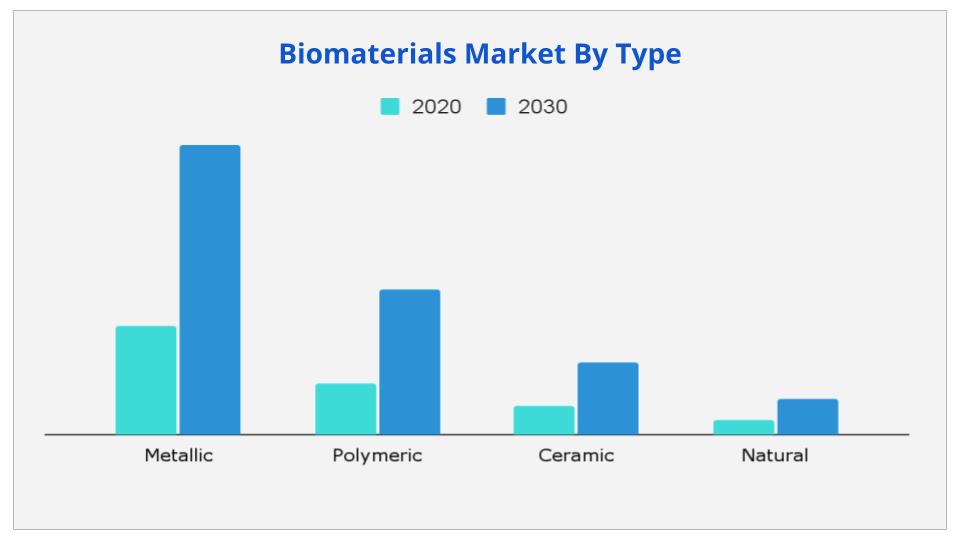
Based on type, the metallic segment is expected to provide lucrative opportunities for growth in the biomaterials market share due to its high strength, corrosion resistance, stiffness, and excellent mechanical properties. They are widely used as support systems for organs and tissues.
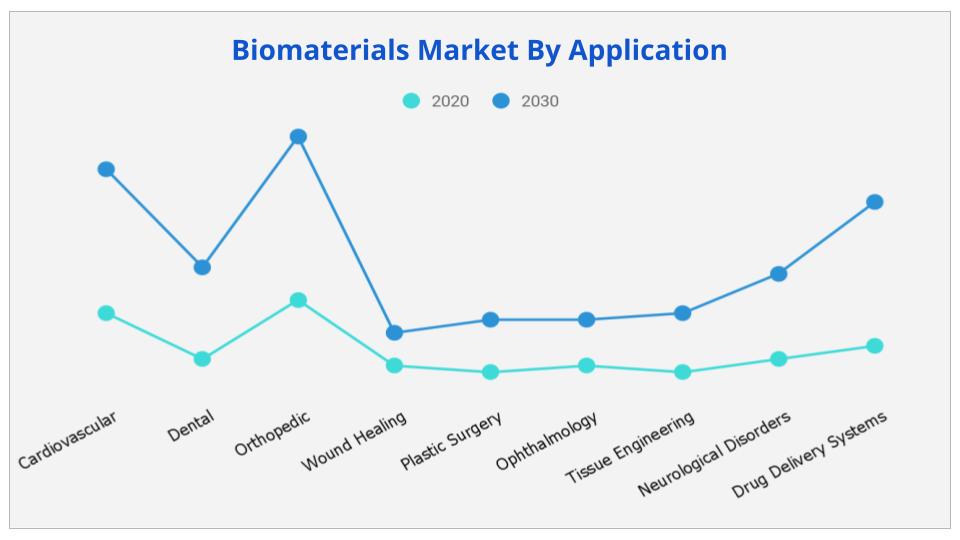
Based on application, the orthopedic segment is expected to dominate in the biomaterials market share due to technological advancements in orthopedic implants.
Based on region, North America will grow at a CAGR of 12.5% and is expected to provide ample opportunities for growth in the biomaterials market share due to growing R&D activities, rise in plastic surgeries, and prevalence of cardiovascular diseases.
|
Report Metric |
Details |
|
Base Year: |
2020 |
|
Market Size in 2020: |
USD 64,874 Million |
|
Forecast Period: |
2021 to 2030 |
|
Forecast Period 2021 to 2030 CAGR: |
12.7% |
|
2030 Value Projection: |
USD 2,12,405.2 Million |
|
No. of Pages: |
155 |
|
Tables & Figures |
50 |
|
Charts |
23 |
|
Segments covered: |
By Type, Application, Region |
Ans. The global biomaterials market size is estimated to grow at a CAGR of 12.7% over the forecast timeframe and reach a market value of around USD 212405.2 million by 2028.
Ans. The global biomaterials market value was valued at US$ 64874 million in 2020.
Ans. The increasing awareness levels regarding the benefits of implantable devices and biomaterial products will spur the growth of the biomaterials market during the forecast period.
Ans. North America will grow at a CAGR of 12.5% and is expected to provide ample opportunities for growth in the biomaterials market
Ans. The forecast period considered for the global luxury travel market is 2021 to 2030.
Ans. Based on Type, Metallic segment holds a dominant position in 2020 and would continue to maintain the lead over the forecast period.
CHAPTER 1: INTRODUCTION
1.1.Report Description
1.2.Key Market Segments
1.3.Key Benefits
1.4.Research Methodology
1.4.1.Primary Research
1.4.2.Secondary Research
1.4.3.Analyst Tools and Models
CHAPTER 2: EXECUTIVE SUMMARY
2.1.CXO Perspective
CHAPTER 3: MARKET LANDSCAPE
3.1.Market Definition and Scope
3.2.Key Findings
3.2.1.Top Investment Pockets
3.2.2.Top Winning Strategies
3.3.Porter's Five Forces Analysis
3.3.1.Bargaining Power of Suppliers
3.3.2.Threat of New Entrants
3.3.3.Threat of Substitutes
3.3.4.Competitive Rivalry
3.3.5.Bargaining Power among Buyers
3.4.Market Share Analysis/Top Player Positioning
3.4.1.Market Share Analysis/Top Player Positioning 2020
3.5.Market Dynamics
3.5.1.Drivers
3.5.2.Restraints
3.5.3.Opportunities
3.6. COVID-19 Impact Analysis
CHAPTER 4: BIOMATERIALS MARKET, BY TYPE
4.1.Market Overview
4.1.1Market Size and Forecast, By Type
4.2.Metallic
4.2.1.Key Market Trends, Growth Factors and Opportunities
4.2.2.Market Size and Forecast, By Region
4.2.3.Market Share Analysis, By Country
4.2.4.Stainless Steel
4.2.4.1.Market Size and Forecast
4.2.5.Titanium and Titanium Alloys
4.2.5.1.Market Size and Forecast
4.2.6.Cobalt-Chrome Alloys
4.2.6.1.Market Size and Forecast
4.2.7.Gold
4.2.7.1.Market Size and Forecast
4.2.8.Silver
4.2.8.1.Market Size and Forecast
4.3.Polymeric
4.3.1.Key Market Trends, Growth Factors and Opportunities
4.3.2.Market Size and Forecast, By Region
4.3.3.Market Share Analysis, By Country
4.3.4.Polymethylmethacrylate
4.3.4.1.Market Size and Forecast
4.3.5.Polyethylene
4.3.5.1.Market Size and Forecast
4.3.6.Polyester
4.3.6.1.Market Size and Forecast
4.3.7.Polyvinylchloride
4.3.7.1.Market Size and Forecast
4.3.8.Silicone Rubber
4.3.8.1.Market Size and Forecast
4.3.9.Nylon
4.3.9.1.Market Size and Forecast
4.3.10.Polyetheretherketone
4.3.10.1.Market Size and Forecast
4.4.Ceramic
4.4.1.Key Market Trends, Growth Factors and Opportunities
4.4.2.Market Size and Forecast, By Region
4.4.3.Market Share Analysis, By Country
4.4.4.Calcium Phosphate
4.4.4.1.Market Size and Forecast
4.4.5.Zirconia
4.4.5.1.Market Size and Forecast
4.4.6.Aluminum Oxide
4.4.6.1.Market Size and Forecast
4.4.7.Calcium Sulfate
4.4.7.1.Market Size and Forecast
4.4.8.Carbon
4.4.8.1.Market Size and Forecast
4.4.9.Glass
4.4.9.1.Market Size and Forecast
4.5.Natural
4.5.1.Key Market Trends, Growth Factors and Opportunities
4.5.2.Market Size and Forecast, By Region
4.5.3.Market Share Analysis, By Country
4.5.4.Hyaluronic Acid
4.5.4.1.Market Size and Forecast
4.5.5.Collagen and Gelatin
4.5.5.1.Market Size and Forecast
4.5.6.Fibrin
4.5.6.1.Market Size and Forecast
4.5.7.Cellulose
4.5.7.1.Market Size and Forecast
4.5.8.Chitin
4.5.8.1.Market Size and Forecast
4.5.9.Alginates
4.5.9.1.Market Size and Forecast
4.5.10.Silk
4.5.10.1.Market Size and Forecast
CHAPTER 5: BIOMATERIALS MARKET, BY APPLICATION
5.1.Market Overview
5.1.1Market Size and Forecast, By Application
5.2.Cardiovascular
5.2.1.Market Size and Forecast, By Region
5.2.2.Market Share Analysis, By Country
5.3.Dental
5.3.1.Market Size and Forecast, By Region
5.3.2.Market Share Analysis, By Country
5.4.Orthopedic
5.4.1.Market Size and Forecast, By Region
5.4.2.Market Share Analysis, By Country
5.5.Wound Healing
5.5.1.Market Size and Forecast, By Region
5.5.2.Market Share Analysis, By Country
5.6.Plastic Surgery
5.6.1.Market Size and Forecast, By Region
5.6.1.Market Share Analysis, By Country
5.7.Ophthalmology
5.7.1.Market Size and Forecast, By Region
5.7.2.Market Share Analysis, By Country
5.8.Neurological Disorder
5.8.1.Market Size and Forecast, By Region
5.8.2.Market Share Analysis, By Country
5.9.Drug Delivery System
5.9.1.Market Size and Forecast, By Region
5.9.2.Market Share Analysis, By Country
CHAPTER 6: BIOMATERIALS MARKET, BY REGION
6.1.Market Overview
6.1.1Market Size and Forecast, By Region
6.2.North America
6.2.1.Key Market Trends and Opportunities
6.2.2.Market Size and Forecast, By Type
6.2.3.Market Size and Forecast, By Application
6.2.4.Market Size and Forecast, By Country
6.2.5.United States Biomaterials Market
6.2.5.1.Market Size and Forecast, By Type
6.2.5.2.Market Size and Forecast, By Application
6.2.6.Canada Biomaterials Market
6.2.6.1.Market Size and Forecast, By Type
6.2.6.2.Market Size and Forecast, By Application
6.2.7.Mexico Biomaterials Market
6.2.7.1.Market Size and Forecast, By Type
6.2.7.2.Market Size and Forecast, By Application
6.3.Europe
6.3.1.Key Market Trends and Opportunities
6.3.2.Market Size and Forecast, By Type
6.3.3.Market Size and Forecast, By Application
6.3.4.Market Size and Forecast, By Country
6.3.5.Germany Biomaterials Market
6.3.5.1.Market Size and Forecast, By Type
6.3.5.2.Market Size and Forecast, By Application
6.3.6.UK Biomaterials Market
6.3.6.1.Market Size and Forecast, By Type
6.3.6.2.Market Size and Forecast, By Application
6.3.7.France Biomaterials Market
6.3.7.1.Market Size and Forecast, By Type
6.3.7.2.Market Size and Forecast, By Application
6.3.8.Italy Biomaterials Market
6.3.8.1.Market Size and Forecast, By Type
6.3.8.2.Market Size and Forecast, By Application
6.3.9.Spain Biomaterials Market
6.3.9.1.Market Size and Forecast, By Type
6.3.9.2.Market Size and Forecast, By Application
6.3.10.Rest Of Europe Biomaterials Market
6.3.10.1.Market Size and Forecast, By Type
6.3.10.2.Market Size and Forecast, By Application
6.4.Asia-Pacific
6.4.1.Key Market Trends and Opportunities
6.4.2.Market Size and Forecast, By Type
6.4.3.Market Size and Forecast, By Application
6.4.4.Market Size and Forecast, By Country
6.4.5.Japan Biomaterials Market
6.4.5.1.Market Size and Forecast, By Type
6.4.5.2.Market Size and Forecast, By Application
6.4.6.China Biomaterials Market
6.4.6.1.Market Size and Forecast, By Type
6.4.6.2.Market Size and Forecast, By Application
6.4.7.India Biomaterials Market
6.4.7.1.Market Size and Forecast, By Type
6.4.7.2.Market Size and Forecast, By Application
6.4.8.Australia Biomaterials Market
6.4.8.1.Market Size and Forecast, By Type
6.4.8.2.Market Size and Forecast, By Application
6.4.9.South Korea Biomaterials Market
6.4.9.1.Market Size and Forecast, By Type
6.4.9.2.Market Size and Forecast, By Application
6.4.10.Rest Of Asia-pacific Biomaterials Market
6.4.10.1.Market Size and Forecast, By Type
6.4.10.2.Market Size and Forecast, By Application
6.5.LAMEA
6.5.1.Key Market Trends and Opportunities
6.5.2.Market Size and Forecast, By Type
6.5.3.Market Size and Forecast, By Application
6.5.4.Market Size and Forecast, By Country
6.5.5.Brazil Biomaterials Market
6.5.5.1.Market Size and Forecast, By Type
6.5.5.2.Market Size and Forecast, By Application
6.5.6.Saudi Arabia Biomaterials Market
6.5.6.1.Market Size and Forecast, By Type
6.5.6.2.Market Size and Forecast, By Application
6.5.7.South Africa Biomaterials Market
6.5.7.1.Market Size and Forecast, By Type
6.5.7.2.Market Size and Forecast, By Application
6.5.8.Rest of LAMEA Biomaterials Market
6.5.8.1.Market Size and Forecast, By Type
6.5.8.2.Market Size and Forecast, By Application
CHAPTER 7: COMPANY PROFILES
7.1.Carpenter Technology Corporation
7.1.1.Company Overview
7.1.2.Company snapshot
7.1.3.Operating business segments
7.1.4.Product portfolio
7.1.5.Business Performance
7.2.Corbion N.V
7.2.1.Company Overview
7.2.2.Company snapshot
7.2.3.Operating business segments
7.2.4.Product portfolio
7.2.5.Business Performance
7.3.Covalon Technologies Ltd.
7.3.1.Company Overview
7.3.2.Key Executives
7.3.3.Company snapshot
7.3.4.Operating business segments
7.3.5.Product portfolio
7.3.6.Business Performance
7.3.7.Key Strategic Moves and Developments
7.4.Evonik Industries
7.4.1.Company Overview
7.4.2.Company snapshot
7.4.3.Operating business segments
7.4.4.Product portfolio
7.4.5.Business Performance
7.4.6.Key Strategic Moves and Developments
7.5.Linden Capital Partners (Collagen Matrix, Inc.)
7.5.1.Company Overview
7.5.2.Company snapshot
7.5.3.Operating business segments
7.5.4.Product portfolio
7.6.Noble Biomaterials Inc.
7.6.1.Company Overview
7.6.2.Company snapshot
7.6.3.Operating business segments
7.6.4.Product portfolio
7.7.Royal DSM
7.7.1.Company Overview
7.7.2.Company snapshot
7.7.3.Operating business segments
7.7.4.Product portfolio
7.7.5.Business Performance
7.7.6.Key Strategic Moves and Developments
7.8.Victrex Plc
7.8.1.Company Overview
7.8.2.Company snapshot
7.8.3.Operating business segments
7.8.4.Product portfolio
7.8.5.Business Performance
7.9.Stryker Corporation (Wright Medical Group N.V)
7.9.1.Company Overview
7.9.2.Company snapshot
7.9.3.Operating business segments
7.9.4.Product portfolio
7.9.5.Business Performance
7.9.6.Key Strategic Moves and Developments
7.10.Zimmer Biomet Holdings, Inc.
7.10.1.Company Overview
7.10.2.Company snapshot
7.10.3.Operating business segments
7.10.4.Product portfolio
7.10.5.Business Performance
Table 1.Global Biomaterials Market, By Type, 2020-2030 ($Million)
Table 2.Global Biomaterials Market For Metallic, By Region, 2020-2030 ($Million)
Table 3.Global Biomaterials Market For Polymeric, By Region, 2020-2030 ($Million)
Table 4.Global Biomaterials Market For Ceramic, By Region, 2020-2030 ($Million)
Table 5.Global Biomaterials Market For Natural, By Region, 2020-2030 ($Million)
Table 6.Global Biomaterials Market, By Application, 2020-2030 ($Million)
Table 7.Global Biomaterials Market For Cardiovascular, By Region, 2020-2030 ($Million)
Table 8.Global Biomaterials Market For Dental, By Region, 2020-2030 ($Million)
Table 9.Global Biomaterials Market For Orthopedic, By Region, 2020-2030 ($Million)
Table 10.Global Biomaterials Market For Wound Healing, By Region, 2020-2030 ($Million)
Table 11.Global Biomaterials Market For Plastic Surgery, By Region, 2020-2030 ($Million)
Table 12.Global Biomaterials Market For Ophthalmology, By Region, 2020-2030 ($Million)
Table 13.Global Biomaterials Market For Neurological Disorder, By Region, 2020-2030 ($Million)
Table 14.Global Biomaterials Market For Drug Delivery System, By Region, 2020-2030 ($Million)
Table 15.Global Biomaterials Market, By Region, 2020-2030 ($Million)
Table 16.North America Biomaterials, By Type, 2020-2030 ($Million)
Table 17.North America Biomaterials, By Application, 2020-2030 ($Million)
Table 18.United States Biomaterials, By Type, 2020-2030 ($Million)
Table 19.United States Biomaterials, By Application, 2020-2030 ($Million)
Table 20.Canada Biomaterials, By Type, 2020-2030 ($Million)
Table 21.Canada Biomaterials, By Application, 2020-2030 ($Million)
Table 22.Mexico Biomaterials, By Type, 2020-2030 ($Million)
Table 23.Mexico Biomaterials, By Application, 2020-2030 ($Million)
Table 24.Europe Biomaterials, By Type, 2020-2030 ($Million)
Table 25.Europe Biomaterials, By Application, 2020-2030 ($Million)
Table 26.Germany Biomaterials, By Type, 2020-2030 ($Million)
Table 27.Germany Biomaterials, By Application, 2020-2030 ($Million)
Table 28.Uk Biomaterials, By Type, 2020-2030 ($Million)
Table 29.Uk Biomaterials, By Application, 2020-2030 ($Million)
Table 30.France Biomaterials, By Type, 2020-2030 ($Million)
Table 31.France Biomaterials, By Application, 2020-2030 ($Million)
Table 32.Italy Biomaterials, By Type, 2020-2030 ($Million)
Table 33.Italy Biomaterials, By Application, 2020-2030 ($Million)
Table 34.Spain Biomaterials, By Type, 2020-2030 ($Million)
Table 35.Spain Biomaterials, By Application, 2020-2030 ($Million)
Table 36.Rest Of Europe Biomaterials, By Type, 2020-2030 ($Million)
Table 37.Rest Of Europe Biomaterials, By Application, 2020-2030 ($Million)
Table 38.Asia-Pacific Biomaterials, By Type, 2020-2030 ($Million)
Table 39.Asia-Pacific Biomaterials, By Application, 2020-2030 ($Million)
Table 40.Japan Biomaterials, By Type, 2020-2030 ($Million)
Table 41.Japan Biomaterials, By Application, 2020-2030 ($Million)
Table 42.China Biomaterials, By Type, 2020-2030 ($Million)
Table 43.China Biomaterials, By Application, 2020-2030 ($Million)
Table 44.India Biomaterials, By Type, 2020-2030 ($Million)
Table 45.India Biomaterials, By Application, 2020-2030 ($Million)
Table 46.Australia Biomaterials, By Type, 2020-2030 ($Million)
Table 47.Australia Biomaterials, By Application, 2020-2030 ($Million)
Table 48.South Korea Biomaterials, By Type, 2020-2030 ($Million)
Table 49.South Korea Biomaterials, By Application, 2020-2030 ($Million)
Table 50.Rest Of Asia-Pacific Biomaterials, By Type, 2020-2030 ($Million)
Table 51.Rest Of Asia-Pacific Biomaterials, By Application, 2020-2030 ($Million)
Table 52.Lamea Biomaterials, By Type, 2020-2030 ($Million)
Table 53.Lamea Biomaterials, By Application, 2020-2030 ($Million)
Table 54.Brazil Biomaterials, By Type, 2020-2030 ($Million)
Table 55.Brazil Biomaterials, By Application, 2020-2030 ($Million)
Table 56.Saudi Arabia Biomaterials, By Type, 2020-2030 ($Million)
Table 57.Saudi Arabia Biomaterials, By Application, 2020-2030 ($Million)
Table 58.South Africa Biomaterials, By Type, 2020-2030 ($Million)
Table 59.South Africa Biomaterials, By Application, 2020-2030 ($Million)
Table 60.Rest Of Lamea Biomaterials, By Type, 2020-2030 ($Million)
Table 61.Rest Of Lamea Biomaterials, By Application, 2020-2030 ($Million)
Table 62.Carpenter Technology Corporation: Company Snapshot
Table 63.Carpenter Technology Corporation: Operating Segments
Table 64.Carpenter Technology Corporation: Product Portfolio
Table 65.Corbion N.V.: Company Snapshot
Table 66.Corbion N.V.: Operating Segments
Table 67.Corbion N.V.: Product Portfolio
Table 68.Covalon Technologies Ltd.: Company Snapshot
Table 69.Covalon Technologies Ltd.: Operating Segments
Table 70.Covalon Technologies Ltd.: Product Portfolio
Table 71.Evonik Industries Ag : Company Snapshot
Table 72.Evonik Industries Ag : Operating Segments
Table 73.Evonik Industries Ag : Product Portfolio
Table 74.Evonik Industries Ag : Key Strategic Moves And Developments
Table 75.Linden Capital Partners: Company Snapshot
Table 76.Linden Capital Partners: Operating Segments
Table 77.Linden Capital Partners: Product Portfolio
Table 78.Noble Biomaterials Inc: Company Snapshot33
Table 79.Noble Biomaterials Inc.: Opearting Segments
Table 80.Noble Biomaterials Inc.: Product Portfolio34
Table 81.Royal Dsm: Company Snapshot35
Table 82.Royal Dsm: Product Segments
Table 83.Royal Dsm: Product Portfolio
Table 84.Royal Dsm: Key Strategic Moves And Developments
Table 85.Victrex Plc: Company Snapshot
Table 86.Victrex Plc: Operating Segments
Table 87.Victrex Plc: Product Portfolio41
Table 88.Stryker: Company Snapshot
Table 89.Stryker: Operating Segments
Table 90.Stryker: Product Portfolio
Table 91.Zimmer Biomet: Company Snapshot
Table 92.Zimmer Biomet: Operating Segments
Table 93.Zimmer Biomet: Product Portfolio
List Of Figures
Figure 1.Global Biomaterials Market Segmentation
Figure 2.Global Biomaterials Market
Figure 3.Segmentation Biomaterials Market
Figure 4.Top Investment Pocket In Biomaterials Market
Figure 5.Top Winning Strategies, 2019-2021*
Figure 6.Top Winning Strategies, By Development, 2019-2021(%)
Figure 7.Top Winning Strategies, By Company, 2019-2021*
Figure 8.Moderate Bargaining Power Of Buyers
Figure 9.Moderate Bargaining Power Of Suppliers
Figure 10.Moderate Threat Of New Entrants
Figure 11.Low Threat Of Substitution
Figure 12.High Competitive Rivalry
Figure 13.Top Player Positioning, 2020
Figure 14.Market Share Analysis, 2020
Figure 15.Restraints And Drivers: Biomaterials Market
Figure 16.Biomaterials Market Segmentation, By Type
Figure 17.Biomaterials Market For Metallic, By Country, 2020-2030 ($Million)
Figure 18.Biomaterials Market For Polymeric, By Country, 2020-2030 ($Million)
Figure 19.Biomaterials Market For Ceramic, By Country, 2020-2030 ($Million)
Figure 20.Biomaterials Market For Natural, By Country, 2020-2030 ($Million)
Figure 21.Biomaterials Market Segmentation, By Application
Figure 22.Biomaterials Market For Cardiovascular, By Country, 2020-2030 ($Million)
Figure 23.Biomaterials Market For Dental, By Country, 2020-2030 ($Million)
Figure 24.Biomaterials Market For Orthopedic, By Country, 2020-2030 ($Million)
Figure 25.Biomaterials Market For Wound Healing, By Country, 2020-2030 ($Million)
Figure 26.Biomaterials Market For Plastic Surgery, By Country, 2020-2030 ($Million)
Figure 27.Biomaterials Market For Ophthalmology, By Country, 2020-2030 ($Million)
Figure 28.Biomaterials Market For Neurological Disorder, By Country, 2020-2030 ($Million)
Figure 29.Biomaterials Market For Drug Delivery System, By Country, 2020-2030 ($Million)
Figure 01.Carpenter Technology Corporation: Net Sales, 2019–2021 ($Million)
Figure 02.Carpenter Technology Corporation: Revenue Share, By Segment, 2021 (%)
Figure 03.Carpenter Technology Corporation: Revenue Share, By Region, 2021 (%)
Figure 04.Corbion N.V.: Net Sales, 2018–2020 ($Million)
Figure 05.Corbion N.V.: Revenue Share, By Segment, 2020 (%)
Figure 06.Corbion N.V.: Revenue Share, By Region, 2020 (%)
Figure 07.Covalon Technologies Ltd: Net Sales, 2019–2021 ($Million)
Figure 08.Covalon Technologies Ltd: Revenue Share, By Region, 2020 (%)
Figure 09.Evonik Industries Ag : Net Sales, 2018–2020 ($Million)
Figure 10.Evonik Industries Ag : Revenue Share, By Segment, 2020 (%)
Figure 11.Evonik Industries Ag : Revenue Share, By Region, 2020 (%)
Figure 12.Royal Dsm: Net Sales, 2018–2020($Million)
Figure 13.Royal Dsm: Revenue Share, By Segments, 2020 (%)
Figure 14.Royal Dsm: Revenue Share, By Region, 2020 (%)
Figure 15.Victrex Plc: Net Sales, 2019–2021 ($Million)
Figure 16.Victrex Plc: Revenue Share, By Segment, 2021 (%)
Figure 17.Victrex Plc: Revenue Share, By Region, 2021 (%)
Figure 18.Stryker: Net Sales, 2018–2020 ($Million)
Figure 19.Stryker: Revenue Share By Segment, 2020 (%)
Figure 20.Stryker: Revenue Share By Region, 2020 (%)
Figure 21.Zimmer Biomet: Net Sales, 2018–2020 ($Million)
Figure 22.Zimmer Biomet: Revenue Share By Segment, 2020 (%)
Figure 23.Zimmer Biomet: Revenue Share By Region, 2020 (%)
$6168
$6929
$10663
