
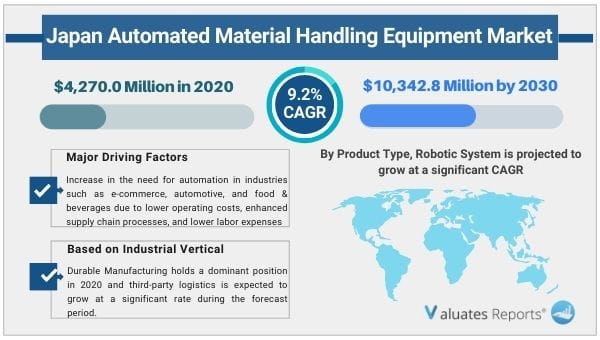
The Japan automated material handling equipment market size was valued at $4,270.0 million in 2020 and is projected to reach $10,342.8 million by 2030, registering a CAGR of 9.2% from 2021 to 2030. Automated material handling systems are computer-controlled systems that help the transportation of materials safely, on schedule, and at a reduced cost. They help to increase the efficiency of transportation, storage, and retrieval of materials. For instance, automated guided vehicles use embedded floor wires to steer autonomous vehicles to various locations in the plant. The importance of the automated material handling equipment industry in Japan is growing at an exponential rate because managing the manufacturing plant has become an essential operation.
The COVID 19 outbreak has affected the growth of the Japan automated material handling equipment industry owing to the lockdown measure in the countries and delay in manufacturing and production of Japan automated material handling equipment which is utilized in industries such as automotive, food, e-commerce, packaging, and others.
Robotics, wireless technologies, and autonomous vehicles are widely utilized to handle several items simultaneously while lowering the number of trips and time necessary for loading and unloading. These factors increase the demand for automated material handling systems in Japan. Furthermore, there is an increase in the need for automation in industries such as e-commerce, automotive, and food & beverages due to lower operating costs, enhanced supply chain processes, and lower labor expenses. However, high initial installation cost of automated material handling equipment, on the other hand, constitutes a significant challenge to Japan automated material handling equipment market development.
The novel coronavirus has rapidly spread across various countries and regions, causing significant impact on the lives of people and the overall community. It emerged as a human health problem and has now become a significant threat to global trade, economies, and finances. The COVID-19 pandemic has halted the production of many items in the Japan automated material handling equipment business, due to the continuous lockdown in major global countries. The players in Japan automated material handling equipment market share can afford a complete lockdown only for a limited time before having to change their investment plans. Furthermore, the number of COVID-19 cases are expected to reduce in the near future as a vaccine for COVID-19 has been introduced in the market. This is further expected to lead to the re-initiation of Japan automated material handling equipment companies at their full-scale capacities, which would help the Japan automated material handling equipment market to recover by the start of 2022. Manufacturers of equipment and machinery must focus on protecting their employees, operations, and supply networks to respond to their urgent emergencies and develop new working procedures after the cases of COVID-19 infection start to decrease.
Automated material handling machines help improve efficiency and minimize transportation time. Therefore, few Japanese key players are manufacturing advanced equipment which are quick and efficient for such applications. For instance, in June 2020, Tsubakimoto Chain Co. launched a new Zip Chain Lifter, the table type lifter that transmits lifting thrust directly through Zip Chains. This advanced machine operates 3 to 10 times faster than hydraulic lifters and reduces time consumption and labor expenses. Furthermore, it enables high-frequency operation, which helps save up to of 50% energy. These latest and advanced innovations in machines provide Japan automated material handling equipment market growth throughout the forecast period.
The Japan automated material handling equipment market is segmented on the basis of product type, system type, component, application, and industry vertical. By product type, the market is divided into automated guided vehicle, automated storage & retrieval system, automated crane, robotic system and automatic conveyor & sortation system. By system type, it is divided into unit load material handling system and bulk load material handling system. By component, it is classified into hardware, software, and services. By application, it is fragmented into assembly, packaging, transportation, distribution, storage, and waste handling. By industry vertical, it is categorized into groceries, general merchandise, clothing, food & beverages, parcel, wholesale, third party logistics, durable manufacturing, non-durable manufacturing, and healthcare.
Key companies profiled in the Japan automated material handling equipment report include Daifuku Co., Ltd., IHI Asia Pacific Pte. Ltd, Maxpull Machinery & Engineering Co., Ltd, Sumitomo Heavy Industries, Tsubakimoto Chain Group, Toyota Industries Corporation, Murata Machinery, Ltd., TOYO Kanetsu K.K., Okura Yusoki Co., Ltd., Seibu Electric & Machinery Co., Ltd.
|
Report Metric |
Details |
|
Report Name |
Japan Automated Material Handling Equipment Market |
|
The market size in 2020 |
USD 4,270.0 Million |
|
The revenue forecast in 2030 |
USD 10,342.8 Million |
|
Growth Rate |
CAGR of 9.2% from 2021 to 2030 |
|
Market size available for years |
2021-2030 |
|
Forecast units |
Value (USD) |
|
Segments covered |
By Product Type, System Type, Component, Application, and Industrial Vertical, and Region |
|
Report coverage |
Revenue & volume forecast, company share, competitive landscape, growth factors, and trends |
|
Geographic regions covered |
North America, Europe, Asia Pacific, Latin America, Middle East & Africa |
|
Key Companies |
Daifuku Co., Ltd., IHI Asia Pacific Pte. Ltd, Maxpull Machinery & Engineering Co., Ltd, Sumitomo Heavy Industries, Tsubakimoto Chain Group, Toyota Industries Corporation, Murata Machinery, Ltd., TOYO Kanetsu K.K., Okura Yusoki Co., Ltd., Seibu Electric & Machinery Co., Ltd. |
Ans. The Japan automated material handling equipment market size was valued at $4,270.0 million in 2020 and is projected to reach $10,342.8 million by 2030, registering a CAGR of 9.2% from 2021 to 2030.
Ans. Technological advancements in robotics and wireless technologies, and Rise in demand for various application such as assembly, packaging, automated cranes and many more are the key trends in the Japan automated material handling equipment market.
Ans. High initial installation cost is the effecting factor for Japan automated material handling equipment market.
Ans. The application of Japan automated material handling equipment include in assembly, packaging, transportation, distribution, storage and waste handling.
Table of Content
CHAPTER 1:INTRODUCTION
1.1.Report description
1.2.Key benefits for stakeholders
1.3.Key market segments
1.4.Research methodology
1.4.1.Primary research
1.4.2.Secondary research
1.4.3.Analyst tools and models
CHAPTER 2:EXECUTIVE SUMMARY
2.1.Key findings of the study
2.2.CXO perspective
CHAPTER 3:MARKET OVERVIEW
3.1.Market definition and scope
3.2.Key findings
3.2.1.Top investment pockets
3.2.2.Top winning strategies
3.3.Market player positioning, 2020
3.4.Porter's five forces analysis
3.5.Market dynamics
3.5.1.Drivers
3.5.1.1.Increase in need for automation in industries
3.5.1.2.Technological advancements in automated material handling equipment
3.5.1.3.Emerging markets in Japan
3.5.2.Restraint
3.5.2.1.High initial cost
3.5.3.Opportunities
3.5.3.1.Growth in the e-commerce industry
3.6.COVID-19 Impact analysis
CHAPTER 4:JAPAN AUTOMATED MATERIAL HANDLING EQUIPMENT MARKET, BY PRODUCT TYPE
4.1.Overview
4.1.1.Market size and forecast, by product type
4.2.Automated Guided Vehicle
4.2.1.Key market trends, growth factors, and opportunities
4.2.2.Market size and forecast
4.3.Automated Storage & Retrievel System
4.3.1.Key market trends, growth factors, and opportunities
4.3.2.Market size and forecast
4.4.Automated Crane
4.4.1.Key market trends, growth factors, and opportunities
4.4.2.Market size and forecast
4.5.Robotic System
4.5.1.Key market trends, growth factors, and opportunities
4.5.2.Market size and forecast
4.6.Automatic Conveyor & Sortation System
4.6.1.Key market trends, growth factors, and opportunities
4.6.2.Market size and forecast
CHAPTER 5:JAPAN AUTOMATED MATERIAL HANDLING EQUIPMENT MARKET , BY SYSTEM TYPE
5.1.Overview
5.1.1.Market size and forecast, by system type
5.2.Unit Load Material Handling System
5.2.1.Key market trends, growth factors, and opportunities
5.2.2.Market size and forecast
5.3.Bulk Load Material handling system
5.3.1.Key market trends, growth factors, and opportunities
5.3.2.Market size and forecast
CHAPTER 6:JAPAN AUTOMATED MATERIAL HANDLING EQUIPMENT MARKET, BY COMPONENT
6.1.Overview
6.1.1.Market size and forecast, by component
6.2.Hardware
6.2.1.Key market trends, growth factors, and opportunities
6.2.2.Market size and forecast
6.3.Software
6.3.1.Key market trends, growth factors, and opportunities
6.3.2.Market size and forecast
6.4.Services
6.4.1.Key market trends, growth factors, and opportunities
6.4.2.Market size and forecast
CHAPTER 7:JAPAN AUTOMATED MATERIAL HANDLING EQUIPMENT MARKET, BY APPLICATION
7.1.Overview
7.1.1.Market size and forecast, by application
7.2.Assembly
7.2.1.Key market trends, growth factors, and opportunities
7.2.2.Market size and forecast
7.3.Packaging
7.3.1.Key market trends, growth factors, and opportunities
7.3.2.Market size and forecast
7.4.Transportation
7.4.1.Key market trends, growth factors, and opportunities
7.4.2.Market size and forecast
7.5.Distribution
7.5.1.Key market trends, growth factors, and opportunities
7.5.2.Market size and forecast
7.6.Storage
7.6.1.Key market trends, growth factors, and opportunities
7.6.2.Market size and forecast
7.7.Waste Handling
7.7.1.Key market trends, growth factors, and opportunities
7.7.2.Market size and forecast
CHAPTER 8:JAPAN AUTOMATED MATERIAL HANDLING EQUIPMENT MARKET, BY INDUSTRIAL VERTICAL
8.1.Overview
8.1.1.Market size and forecast, by industrial vertical
8.2.Grocery
8.2.1.Key market trends, growth factors, and opportunities
8.2.2.Market size and forecast
8.3.General merchandise
8.3.1.Key market trends, growth factors, and opportunities
8.3.2.Market size and forecast
8.4.Apparel
8.4.1.Key market trends, growth factors, and opportunities
8.4.2.Market size and forecast
8.5.Food & Beverages
8.5.1.Key market trends, growth factors, and opportunities
8.5.2.Market size and forecast
8.6.Parcel
8.6.1.Key market trends, growth factors, and opportunities
8.6.2.Market size and forecast
8.7.Wholesale
8.7.1.Key market trends, growth factors, and opportunities
8.7.2.Market size and forecast
8.8.Third Party Logistics
8.8.1.Key market trends, growth factors, and opportunities
8.8.2.Market size and forecast
8.9.Durable Manufacturing
8.9.1.Key market trends, growth factors, and opportunities
8.9.2.Market size and forecast
8.9.3.Market size and forecast, by durable manufacturing
8.10.Non-Durable Manufacturing
8.10.1.Key market trends, growth factors, and opportunities
8.10.2.Market size and forecast
8.11.Healthcare
8.11.1.Key market trends, growth factors, and opportunities
8.11.2.Market size and forecast
CHAPTER 9:COMPANY PROFILE
9.1.DAIFUKU CO., LTD.
9.1.1.Company overview
9.1.2.Key executive
9.1.3.Company snapshot
9.1.4.Operating business segments
9.1.5.Product portfolio
9.1.6.Business performance
9.1.7.Key strategic moves and developments
9.2.IHI CORPORATION
9.2.1.Company overview
9.2.2.Key executive
9.2.3.Company snapshot
9.2.4.Operating business segments
9.2.5.Product portfolio
9.2.6.Business performance
9.3.MAXPULL MACHINERY & ENGINEERING CO., LTD.
9.3.1.Company overview
9.3.2.Key executive
9.3.3.Company snapshot
9.3.4.Product portfolio
9.4.SUMITOMO HEAVY INDUSTRIES
9.4.1.Company overview
9.4.2.Key executive
9.4.3.Company snapshot
9.4.4.Operating business segments
9.4.5.Product portfolio
9.5.TSUBAKIMOTO CHAIN CO.
9.5.1.Company overview
9.5.2.Key executive
9.5.3.Company snapshot
9.5.4.Operating business segments
9.5.5.Product portfolio
9.5.6.R&D expenditure
9.5.7.Business performance
9.5.8.Key strategic moves and developments
9.6.TOYOTA INDUSTRIES CORPORATION
9.6.1.Company overview
9.6.2.Key executive
9.6.3.Company snapshot
9.6.4.Operating business segments
9.6.5.Product portfolio
9.6.6.R&D expenditure
9.6.7.Business performance
9.6.8.Key strategic moves and developments
9.7.MURATA MACHINERY, LTD.
9.7.1.Company overview
9.7.2.Key executive
9.7.3.Company snapshot
9.7.4.Operating business segments
9.7.5.Product portfolio
9.7.6.Business performance
9.7.7.Key strategic moves and developments
9.8.TOYO KANETSU K.K.
9.8.1.Company overview
9.8.2.Key executive
9.8.3.Company snapshot
9.8.4.Operating business segments
9.8.5.Product portfolio
9.8.6.R&D expenditure
9.8.7.Business performance
9.9.OKURA YOSOKI CO., LTD.
9.9.1.Company overview
9.9.2.Key executive
9.9.3.Company snapshot
9.9.4.Operating business segments
9.9.5.Product portfolio
9.9.6.Key strategic moves and developments
9.10.SEIBU ELECTRIC & MACHINERY CO., LTD.
9.10.1.Company overview
9.10.2.Key executive
9.10.3.Company snapshot
9.10.4.Operating business segments
9.10.5.Product portfolio
List of Tables & Figures
Table 01.Japan Automated Material Handling Equipment Market Revenue, By Product Type, 2020–2030 ($Million)
Table 02.Japan Automated Material Handling Equipment Market Revenue, By System Type, 2020–2030 ($Million)
Table 03.Japan Automated Material Handling Equipment Market Revenue, By Component, 2020–2030 ($Million)
Table 04.Japan Automated Material Handling Equipment Market Revenue, By Application, 2020–2030 ($Million)
Table 05.Japan Automated Material Handling Equipment Market Revenue, By Industrial Vertical, 2020–2030 ($Million)
Table 06.Japan Automated Material Handling Equipment Market Revenue, By Durable Manufacturing, 2020–2030 ($Million)
Table 07.Daifuku: Key Executive
Table 08.Daifuku: Company Snapshot
Table 09.Daifuku: Operating Segments
Table 10.Daifuku: Product Portfolio
Table 11.Ihi Corporation: Key Executive
Table 12.Ihi Corporation: Company Snapshot
Table 13.Ihi Corporation: Operating Segments
Table 14.Ihi Corporation: Product Portfolio
Table 15.Maxpull: Key Executive
Table 16.Maxpull: Company Snapshot
Table 17.Maxpull: Product Portfolio
Table 18.Sumitomo Heavy Industries: Key Executive
Table 19.Sumitomo Heavy Industries: Company Snapshot
Table 20.Sumitomo Heavy Industries: Operating Segments
Table 21.Sumitomo Heavy Industries: Product Portfolio
Table 22.Tsubakimoto Chain: Key Executive
Table 23.Tsubakimoto Chain: Company Snapshot
Table 24.Tsubakimoto Chain: Operating Segments
Table 25.Tsubakimoto Chain: Product Portfolio
Table 26.Toyota Industries: Key Executive
Table 27.Toyota Industries: Company Snapshot
Table 28.Toyota Industries: Operating Segments
Table 29.Toyota Industries: Product Portfolio
Table 30.Murata Machinery: Key Executive
Table 31.Murata Machinery: Company Snapshot
Table 32.Murata Machinery: Operating Segments
Table 33.Murata Machinery: Product Portfolio
Table 34.Toyo Kanetsu: Key Executive
Table 35.Toyo Kanetsu: Company Snapshot
Table 36.Toyo Kanetsu: Operating Segments
Table 37.Toyo Kanetsu: Product Portfolio
Table 38.Okura Yosoki: Key Executive
Table 39.Okura Yosoki: Company Snapshot
Table 40.Okura Yosoki: Operating Segments
Table 41.Okura Yosoki: Product Portfolio
Table 42.Seibu: Key Executive
Table 43.Seibu: Company Snapshot
Table 44.Seibu: Operating Segments
Table 45.Seibu: Product Portfolio
List Of Figures
Figure 01.Key Market Segments
Figure 02.Executive Summary
Figure 03.Top Investment Pockets
Figure 04.Top Winning Strategies, By Year, 2019–2021
Figure 05.Top Winning Strategies, By Development, 2019–2021 (%)
Figure 06.Top Winning Strategies, By Company, 2019–2021
Figure 07.Market Player Positioning, 2020
Figure 08.Low To Moderate Bargaining Power Of Suppliers
Figure 09.Moderate-To-High Bargaining Power Of Buyers
Figure 10.Moderate-To-High Threat Of Substitutes
Figure 11.Moderate-To-High Threat Of New Entrants
Figure 12.Moderate To High Intensity Of Rivalry
Figure 13.Japan Automated Material Handling Equipment Market, By Product Type, 2020–2030 (%)
Figure 01.Japan Automated Material Handling Equipment Market Revenue For Automated Guided Vehicle, 2020-2030 ($Million)
Figure 02.Japan Automated Material Handling Equipment Market Revenue For Automated Storage & Retrievel System, 2020-2030 ($Million)
Figure 03.Japan Automated Material Handling Equipment Market Revenue For Automated Crane, 2020-2030 ($Million)
Figure 04.Japan Automated Material Handling Equipment Market Revenue For Robotic System, 2020-2030 ($Million)
Figure 05.Japan Automated Material Handling Equipment Market Revenue For Automatic Conveyor & Sortation System, 2020-2030 ($Million)
Figure 06.Japan Automated Material Handling Equipment Market, By System Type, 2020–2030 (%)
Figure 07.Japan Automated Material Handling Equipment Market Revenue For Unit Load Material Handling System, 2020-2030 ($Million)
Figure 08.Japan Automated Material Handling Equipment Market Revenue For Bulk Load Material Handling System, 2020-2030 ($Million)
Figure 09.Japan Automated Material Handling Equipment Market, By Compoment, 2020–2030 (%)
Figure 10.Japan Automated Material Handling Equipment Market Revenue For Hardware, 2020-2030 ($Million)
Figure 11.Japan Automated Material Handling Equipment Market Revenue For Software, 2020-2030 ($Million)
Figure 12.Japan Automated Material Handling Equipment Market Revenue For Services, 2020-2030 ($Million)
Figure 13.Japan Automated Material Handling Equipment Market , By Application, 2020–2030 (%)
Figure 14.Japan Automated Material Handling Equipment Market Revenue For Assembly, 2020-2030 ($Million)
Figure 15.Japan Automated Material Handling Equipment Market Revenue For Packaging, 2020-2030 ($Million)
Figure 16.Japan Automated Material Handling Equipment Market Revenue For Transportation, 2020-2030 ($Million)
Figure 17.Japan Automated Material Handling Equipment Market Revenue For Distribution, 2020-2030 ($Million)
Figure 18.Japan Automated Material Handling Equipment Market Revenue For Storage, 2020-2030 ($Million)
Figure 19.Japan Automated Material Handling Equipment Market Revenue For Waste Handling, 2020-2030 ($Million)
Figure 20.Japan Automated Material Handling Equipment Market, By Industrial Vertical, 2020–2030 (%)
Figure 21.Japan Automated Material Handling Equipment Market Revenue For Grocery, 2020-2030 ($Million)
Figure 22.Japan Automated Material Handling Equipment Market Revenue For General Merchandise, 2020-2030 ($Million)
Figure 23.Japan Automated Material Handling Equipment Market Revenue For Apparel, 2020-2030 ($Million)
Figure 24.Japan Automated Material Handling Equipment Market Revenue For Food & Beverages, 2020-2030 ($Million)
Figure 25.Japan Automated Material Handling Equipment Market Revenue For Parcel, 2020-2030 ($Million)
Figure 26.Japan Automated Material Handling Equipment Market Revenue For Wholesale, 2020-2030 ($Million)
Figure 27.Japan Automated Material Handling Equipment Market Revenue For Third Party Logistics, 2020-2030 ($Million)
Figure 28.Japan Automated Material Handling Equipment Market Revenue For Durable Manufacturing, 2020-2030 ($Million)
Figure 29.Japan Automated Material Handling Equipment Market Revenue For Non-Durable Manufacturing, 2020-2030 ($Million)
Figure 30.Japan Automated Material Handling Equipment Market Revenue For Healthcare, 2020-2030 ($Million)
Figure 31.Daifuku: Revenue, 2018–2020 ($Million)
Figure 32.Daifuku: Revenue Share By Segment, 2020 (%)
Figure 33.Daifuku: Revenue Share By Region, 2020 (%)
Figure 34.Ihi Corporation: Revenue, 2018–2020 ($Million)
Figure 35.Ihi Corporation: Revenue Share By Segment, 2020 (%)
Figure 36.Ihi Corporation: Revenue Share By Region, 2020 (%)
Figure 37.Tsubakimoto Chain: R&D Expenditure, 2018–2020 ($Million)
Figure 38.Tsubakimoto Chain: Revenue, 2018–2020 ($Million)
Figure 39.Tsubakimoto Chain: Revenue Share By Segment, 2020 (%)
Figure 40.Tsubakimoto Chain: Revenue Share By Region, 2020 (%)
Figure 41.Toyota Industries: R&D Expenditure, 2018–2020 ($Million)
Figure 42.Toyota Industries: Revenue, 2018–2020 ($Million)
Figure 43.Toyota Industries: Revenue Share By Segment, 2020 (%)
Figure 44.Toyota Industries: Revenue Share By Region, 2020 (%)
Figure 45.Murata Machinery: Revenue, 2018–2020 ($Million)
Figure 46.Toyo Kanetsu: R&D Expenditure, 2018–2020 ($Million)
Figure 47.Toyo Kanetsu: Revenue, 2018–2020 ($Million)
Figure 48.Toyo Kanetsu: Revenue Share By Segment, 2020 (%)
Figure 49.Toyo Kanetsu: Revenue Share By Region, 2020 (%)
$3199
$5690
HAVE A QUERY?
OUR CUSTOMER

SIMILAR REPORTS