
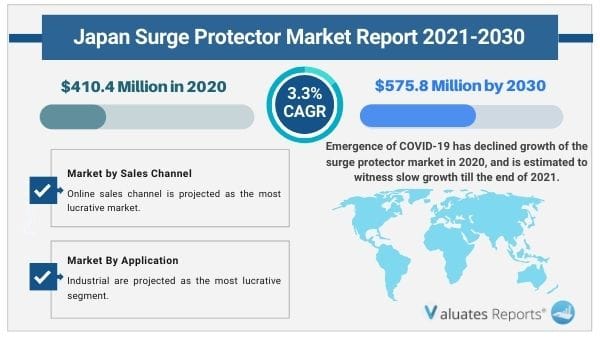
The Japan surge protector market was valued at $410.4 million in 2020 and is projected to reach $575.8 million by 2030, growing at a Compound Annual Growth Rate (CAGR) of 3.3% from 2021 to 2030. Surge protector provide best protection from both externally and internally generated surges when located as close to the building distribution system as possible. For cost and space reasons, many buildings only include one surge protection device (SPD) located at the main incoming panel and do not cascade SPDs throughout the building.
Emergence of COVID-19 has declined growth of the surge protector market in 2020, and is estimated to witness slow growth till the end of 2021.
Since surge protectors are economical and easy to install in most panels throughout a building, this acts as driving factor for the market growth in the country. The whole facility protection can be obtained by the use of surge protectors. However, lack of awareness among small scale manufactures and competition from uninterrupted and non-fluctuating power supply systems and no guaranteed protection hampers the market growth for surge protectors.
The key players operating and profiled in the Japan surge protector industry report include ABB Ltd., Eaton Corporation, General Electric, Schneider Electric, Honeywell, Siemens AG, Johnson Controls, Legrand, Havells, and Vertiv Group Corp.
Depending on type, the type 1 segment dominated the market for 202,0 owing to wide use of the product in residential and industrial sectors. The type 3 segment is expected to grow at higher CAGR during the forecast period, owing to rise in demand from the residential sector.
On the basis of voltage, the high voltage segment dominated the market share for 2020, owing to their application in heavy industry operations. However, low voltage surge protectors are forecasted, owing to growth at the higher CAGR due to use in residential areas where applications of such surge protectors is growing.
On the basis of application, the industrial segment dominated the market share for 2020, owing to wide application of surge protectors in the sector. It is also expected to grow at the higher CAGR during the forecast period.
By sales channel, the offline sales channel segment dominated the market share for 2020, which is attributed to the fact that consumer is much more comfortable in purchasing such devices after getting proper knowledge about, product, especially technical information. However, growing e-commerce industry and benefit of home delivery is anticipated to drive growth for online channel at a higher CAGR during the forecast period.
| Report Metric |
Details |
| Report Name |
Japan Surge Protector Market |
| The market size in 2020 |
USD 410.4 Million |
| The revenue forecast in 2030 |
USD 575.8 Million |
| Growth Rate |
CAGR of 3.3% from 2021 to 2030 |
| Market size available for years |
2021-2030 |
| Forecast units |
Value (USD) |
| Segments covered |
Type, Voltage, Application, Sales Channel, Region |
| Report coverage |
Revenue & volume forecast, company share, competitive landscape, growth factors, and trends |
| Geographic regions covered |
North America, Europe, Asia Pacific, Latin America, Middle East & Africa |
Ans. The Japan surge protector market was valued at $410.4 million in 2020 and is projected to reach $575.8 million by 2030, growing at a Compound Annual Growth Rate (CAGR) of 3.3% from 2021 to 2030.
Ans. The leading players in the market are ABB Ltd., Eaton Corporation, General Electric, Havells, Honeywell, Johnson Controls, Legrand, Schneider Electric, Siemens, and Vertiv Group Corp.
Ans. The rising demand in electronics & electricals has also led to rise in demand of surge protector in-addition with automation industry.
Ans. Increase in demand for surge protectors from residential and industrial sectors are the key factors driving the Japan surge protector market.
Ans. Offline segment based on application holds the maximum market share of the Japan surge protector market.
CHAPTER 1:INTRODUCTION
1.1.Report description
1.2.Key benefits for stakeholders
1.3.Key market segments
1.4.Research methodology
1.4.1.Primary research
1.4.2.Secondary research
1.4.3.Analyst tools and models
CHAPTER 2:EXECUTIVE SUMMARY
2.1.Key findings
2.2.CXO perspective
CHAPTER 3:MARKET LANDSCAPE
3.1.Market definition and scope
3.2.Key findings
3.2.1.Top investment pockets
3.3.Porter's five forces analysis
3.4.Patent analysis
3.5.Market dynamics
3.5.1.Driver
3.5.1.1.Growth in demand for protection systems for electronic devices
3.5.2.Restraint
3.5.2.1.Surge protectors only provide protection from voltage spikes and surges
3.5.3.Opportunity
3.5.3.1.High technological equipment adopted in the country
3.6.Pricing Analysis
3.7.Value Chain Analysis
3.8.COVID-19 impact analysis
3.9.Impact of government rules and regulations
CHAPTER 4:SURGE PROTECTOR MARKET, BY TYPE
4.1.Overview
4.1.1.Market size and forecast
4.2.Type 1
4.2.1.Key market trends, growth factors, and opportunities
4.3.Type 2
4.3.1.Key market trends, growth factors, and opportunities
4.4.Type 3
4.4.1.Key market trends, growth factors, and opportunities
CHAPTER 5:SURGE PROTECTOR MARKET, BY VOLTAGE
5.1.Overview
5.1.1.Market size and forecast
5.2.Low
5.3.Medium
5.4.High
CHAPTER 6:SURGE PROTECTOR MARKET, BY APPLICATION
6.1.Overview
6.1.1.Market size and forecast
6.2.Industrial
6.2.1.Key market trends, growth factors, and opportunities
6.3.Commercial
6.3.1.Key market trends, growth factors, and opportunities
6.4.Residential
6.4.1.Key market trends, growth factors, and opportunities
CHAPTER 7:SURGE PROTECTOR MARKET, BY SALES CHANNEL
7.1.Overview
7.1.1.Market size and forecast
7.2.Online
7.2.1.Key market trends, growth factors, and opportunities
7.3.Offline
7.3.1.Key market trends, growth factors, and opportunities
CHAPTER 8:COMPETITIVE LANDSCAPE
8.1.Introduction
8.1.1.Market player positioning, 2020
8.1.2.Company Share Analysis
8.2.Product Mapping of top 10 players
8.3.Competitive Heatmap
CHAPTER 9:COMPANY PROFILES
9.1.ABB
9.1.1.Company overview
9.1.2.Company snapshot
9.1.3.Operating business segments
9.1.4.Product portfolio
9.1.5.Business performance
9.1.6.ABB- SWOT Analysis
9.2.EATON CORPORATION PLC.
9.2.1.Company overview
9.2.2.Company snapshot
9.2.3.Operating business segments
9.2.4.Product portfolio
9.2.5.Business performance
9.2.6.Eaton SWOT Analysis
9.3.LEGRAND
9.3.1.Company overview
9.3.2.Company snapshot
9.3.3.Product portfolio
9.3.4.Business performance
9.3.5.Legrand- SWOT Analysis
9.4.GE
9.4.1.Company overview
9.4.2.Company snapshot
9.4.3.Operating Segments
9.4.4.Product portfolio
9.4.5.Business performance
9.4.6.GE- SWOT Analysis
9.5.HONEYWELL INTERNATIONAL INC.
9.5.1.Company overview
9.5.2.Company snapshot
9.5.3.Operating business segments
9.5.4.Product portfolio
9.5.5.Business performance
9.5.6.Honeywell- SWOT Analysis
9.6.JOHNSON CONTROLS, INC.
9.6.1.Company overview
9.6.2.Company snapshot
9.6.3.Operating business segments
9.6.4.Product portfolio
9.6.5.Business performance
9.6.6.Johnson Controls- SWOT Analysis
9.7.SCHNIEDER ELECTRIC
9.7.1.Company overview
9.7.2.Company snapshot
9.7.3.Operating business segments
9.7.4.Product portfolio
9.7.5.Business performance
9.7.6.Schnieder- SWOT Analysis
9.8.SIEMENS AG
9.8.1.Company overview
9.8.2.Company snapshot
9.8.3.Product portfolio
9.8.4.Business performance
9.8.5.Siemens AG- SWOT Analysis
9.9.VERTIV HOLDINGS CO.
9.9.1.Company overview
9.9.2.Company snapshot
9.9.3.Product portfolio
9.9.4.Business performance
9.9.5.Vertiv- SWOT Analysis
9.10.HAVELLS INDIA LIMITED
9.10.1.Company overview
9.10.2.Company snapshot
9.10.3.Product portfolio
9.10.4.Business performance
9.10.5.Havells - SWOT Analysis
Table 01.Japan Surge Protector Market, By Type, 2020-2030 ($Million)
Table 02.Japan Surge Protector Market, By Type, 2020-2030 (Unit)
Table 03.Japan Surge Protector Market, By Voltage, 2020-2030 ($Million)
Table 04.Japan Surge Protector Market, By Voltage, 2020-2030 (Unit)
Table 05.Japan Surge Protector Market, By Application, 2020-2030 ($Million)
Table 06.Japan Surge Protector Market, By Application, 2020-2030 (Unit)
Table 07.Japan Surge Protector Market, By Sales Channel, 2020-2030 ($Million)
Table 08.Japan Surge Protector Market, By Sales Channel, 2020-2030 (Unit)
Table 09.Abb: Company Snapshot
Table 10.Abb: Operating Segments
Table 11.Abb: Product Portfolio
Table 12.Overall Financial Status (Million)
Table 13.Abb: Swot Analysis
Table 14.Eaton: Company Snapshot
Table 15.Eaton: Operating Segments
Table 16.Eaton: Product Portfolio
Table 17.Overall Financial Status ($Million)
Table 18.Eaton: Swot Analysis
Table 19.Legrand: Company Snapshot
Table 20.Legrand: Product Portfolio
Table 21.Overall Financial Status ($Million)
Table 22.Legrand: Swot Analysis
Table 23.Ge: Company Snapshot
Table 24.Ge Renewable Energy: Operating Segments
Table 25.Ge: Product Portfolio
Table 26.Overall Financial Status ($Million)
Table 27.Ge: Swot Analysis
Table 28.Honeywell: Company Snapshot
Table 29.Honeywell: Operating Segments
Table 30.Honeywell: Product Portfolio
Table 31.Overall Financial Status ($Million)
Table 32.Honeywell: Swot Analysis
Table 33.Johnson Controls, Inc: Company Snapshot
Table 34.Johnson Controls, Inc: Operating Segments
Table 35.Johnson Controls: Product Portfolio
Table 36.Overall Financial Status ($Million)
Table 37.Johnson Controls: Swot Analysis
Table 38.Schnieder: Company Snapshot
Table 39.Schnieder: Operating Segments
Table 40.Schnieder: Product Portfolio
Table 41.Overall Financial Status ($Million)
Table 42.Schnieder: Swot Analysis
Table 43.Siemens Ag: Company Snapshot
Table 44.Siemens Ag: Product Portfolio
Table 45.Overall Financial Status (Million)
Table 46.Siemens Ag: Swot Analysis
Table 47.Vertiv: Company Snapshot
Table 48.Vertiv: Product Portfolio
Table 49.Overall Financial Status (Million)
Table 50.Vertiv: Swot Analysis
Table 51.Havells: Company Snapshot
Table 52.Havells: Product Portfolio
Table 53.Overall Financial Status (Million)
Table 54.Havells: Swot Analysis
List Of Figures
Figure 01.Key Market Segments
Figure 02.Top Investment Pockets
Figure 03.Moderate Bargaining Power Of Suppliers
Figure 04.Moderate Threat Of New Entrants
Figure 05.Moderate Threat Of Substitutes
Figure 06.Low Intensity Of Rivalry
Figure 07.Low Bargaining Power Of Buyers
Figure 08.Patent Analysis For Surge Protector Market, By Region
Figure 09.Patent Analysis For Surge Protector Market, By Year
Figure 10.Surge Protector Market Dynamics
Figure 11.Surge Protector Market Dynamics
Figure 12.Surge Protector Market Dynamics
Figure 13.Japan Surge Protector Market, By Type, 2021-2030 ($Million)
Figure 14.Japan Surge Protector Market, By Voltage, 2021-2030 ($Million)
Figure 15.Japan Surge Protector Market, By Application, 2021-2030 ($Million)
Figure 16.Japan Surge Protector Market, By Sales Channel, 2021-2030 ($Million)
Figure 17.Market Player Positioning, 2020
Figure 18.Company Share Analysis, 2020
Figure 19.Product Mapping
Figure 20.Competitive Heatmap
Figure 21.Abb: Net Sales, 2018–2020 (Million)
Figure 22.Abb: Revenue Share, By Segment, 2020 (%)
Figure 23.Abb: Revenue Share, By Geography, 2020 (%)
Figure 24.Eaton: Revenue, 2018-2020 ($Million)
Figure 25.Eaton: Revenue Share By Segment, 2020 (%)
Figure 26.Eaton: Revenue Share By Region, 2020 (%)
Figure 27.Legrand: Net Sales, 2018–2020 (Million)
Figure 28.Legrand: Revenue Share, By Region, 2020 (%)
Figure 29.Ge: Net Sales, 2018–2020 (Million)
Figure 30.Ge: Revenue Share, By Segment, 2020 (%)
Figure 31.Ge: Revenue Share, By Region, 2020 (%)
Figure 32.Honeywell: Revenue, 2018–2020 ($Million)
Figure 33.Honeywell: Revenue Share By Segment, 2020 (%)
Figure 34.Honeywell: Revenue Share By Region, 2020 (%)
Figure 35.Johnson Controls: Net Sales, 2018–2020 ($Million)
Figure 36.Johnson Controls: Revenue Share, By Segment, 2020 (%)
Figure 37.Johnson Controls: Revenue Share, By Region, 2020(%)
Figure 38.Schnieder: Revenue, 2018–2020 ($Million)
Figure 39.Schnieder: Revenue Share By Segment, 2020 (%)
Figure 40.Schnieder: Revenue Share By Region, 2020 (%)
Figure 41.Siemens Ag: Net Sales, 2018–2020 (Million)
Figure 42.Siemens Ag: Revenue Share, By Segment, 2020 (%)
Figure 43.Siemens Ag: Revenue Share, By Region, 2020(%)
Figure 44.Vertiv: Revenue, 2018–2020 ($Million)
Figure 45.Vertiv: Revenue Share By Products & Services, 2020 (%)
Figure 46.Vertiv: Revenue Share By Region, 2020 (%)
Figure 47.Havells: Revenue, 2018–2020 ($Million)
Figure 48.Havells: Revenue Share By Segment, 2020 (%)
Figure 49.Havells: Revenue Share By Region, 2020 (%)
$5769
$9995
HAVE A QUERY?
OUR CUSTOMER

SIMILAR REPORTS
Add to Cart
Add to Cart
Add to Cart
Add to Cart