
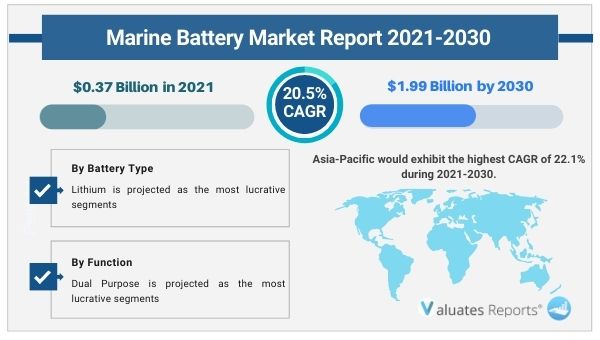
The global marine battery market size was valued at US$ 0.37 billion in 2021 and is projected to reach US$ 1.99 billion in 2030 growing at a CAGR of 20.5%. Key drivers of the marine battery market include the growing need for marine freight vessels.
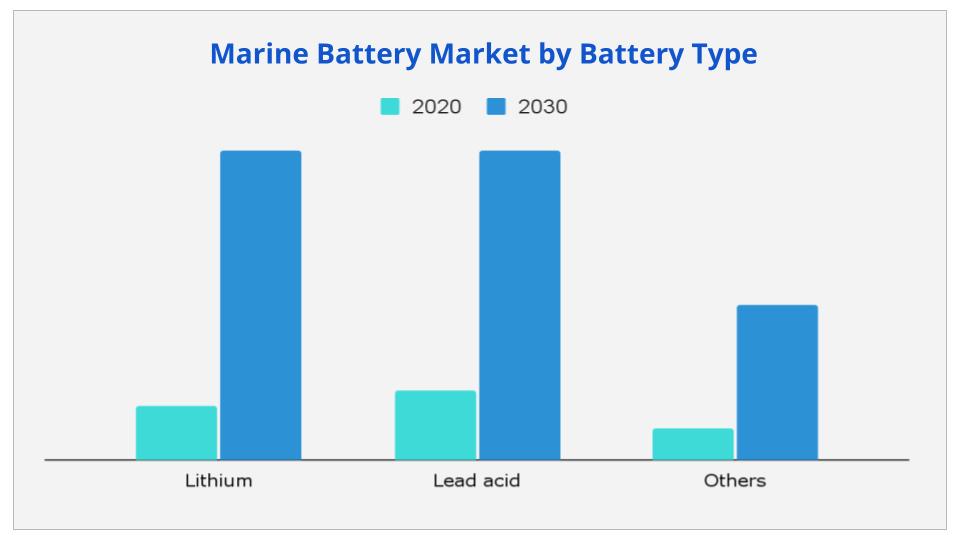
The benefits of lithium-ion batteries over lead-acid batteries will increase use in shipbuilding driving the growth of the marine battery market in the coming years.
However, regular maintenance and protection of batteries will restrict the market demand during the forecast period.
Furthermore, increasing automation and manufacturing of fully electric or hybrid vessels will provide immense growth opportunities for the marine battery market in the future.
Increasing marine transportation
International trade activities are growing rapidly. About 80% of all trade is carried out through ships and containers. Specialized vessels such as tankers, container ships, and bulk carriers are being made along with port terminal facilities to meet the global seaborne trading demand. The movement of raw materials, energy demand, and manufacturing of finished and intermediate goods due to globalization all contribute to the growth of the shipping industry. This will create demand for the marine battery market for powering the massive engines of vessels.
Lithium batteries replacing lead acid
The shipping industry uses lead-acid batteries as it is cheaper and recyclable. However, these batteries are hazardous and discharge harmful chemicals during their cycling process. Lithium-ion batteries have higher electrochemical potential and can be used as a backup for enabling ships to run in zero-emissions mode. This helps in decarbonization. The power density is higher and can charge quickly with little to no losses. The shelf life is preserved which balances the cost over a long period of time. Thus the gradual advent of new battery types will drive the growth of the marine battery market in the coming decades.
Repair and maintenance issues
Batteries suffer from a host of problems. It can emit heat, flame, or gas from a high discharge rate. Overcharging can lead to an explosion rendering it useless for further use. Moreover, there are problems related to the building up of excess sulfuric acid and electrolyte leakage. Shippers and manufacturers have to opt for regular battery checks as internal or external short-circuiting, a sensor failure can damage the vessel and put the lives of the entire crew at risk. In addition to it preserving the shelf life is of utmost importance. These factors will restrict the growth of the marine battery market during the forecast period.
Rise of electric ships
The marine industry releases significant amounts of nitrogen oxides, soot particles, and CO2 into the air. Due to growing environmental consciousness and stricter regulations for arresting global warming electrification and hybrid systems are being adopted widely in cargo vessels, containers, and ships. Batteries are fitted for supporting peak energy requirements. This eliminates the need for internal combustion engines directly affecting the global carbon footprint. Many ferries and pleasure boats have started running on electric batteries over shorter distances. Considerable research and development initiatives are going on for increasing the efficiency of batteries. This in turn will surge the marine battery market in the near future.
Based on battery type, the lithium-ion segment is expected to provide lucrative opportunities for growth in the marine battery market share during the forecast period.
Based on region, Europe is likely to dominate in the marine battery market share due to having the biggest shipping industry while Asia-Pacific will grow at the fastest CAGR of 22.1% from 2021 to 2030.
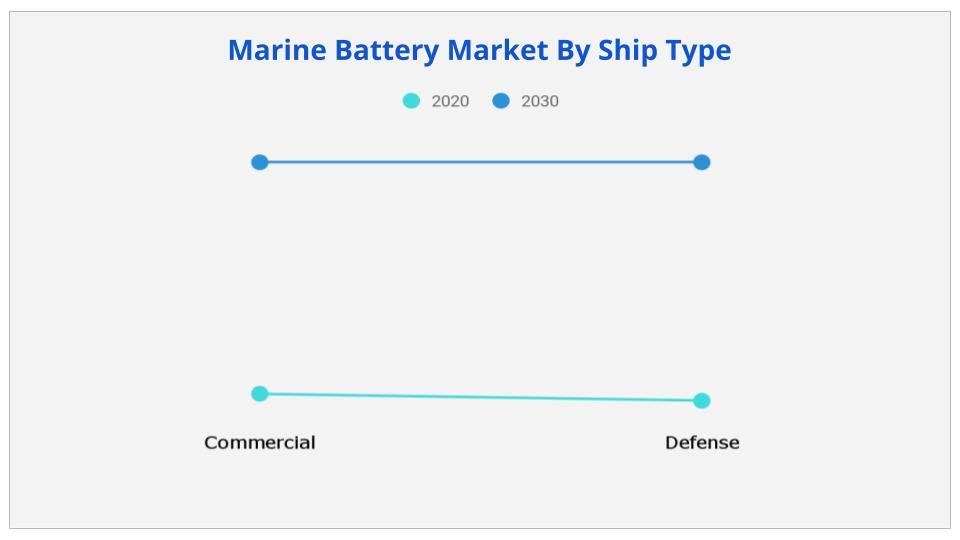
Based on ship type, the defense segment is likely to maintain dominance in the marine battery market share during the forecasted period.
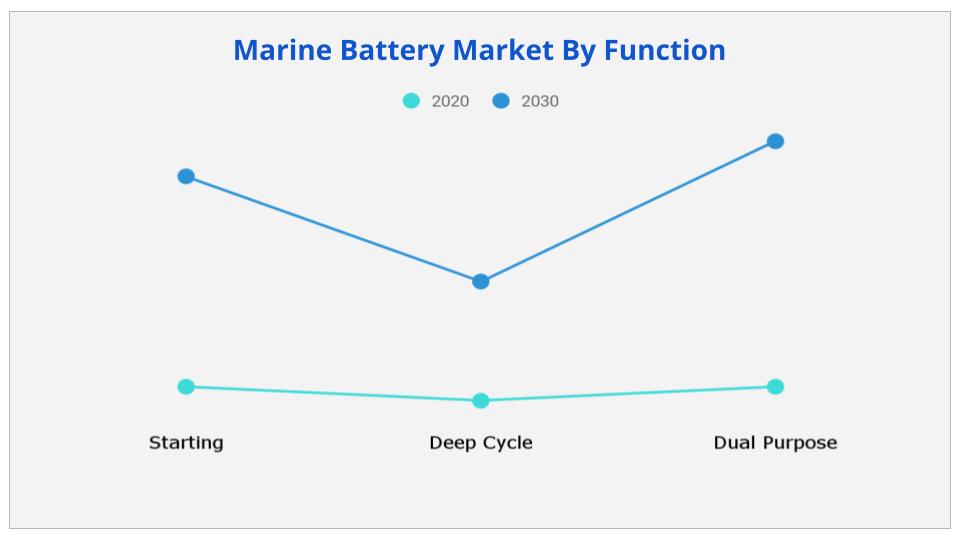
Based on function, the dual-purpose segment will grow the highest during the review period.
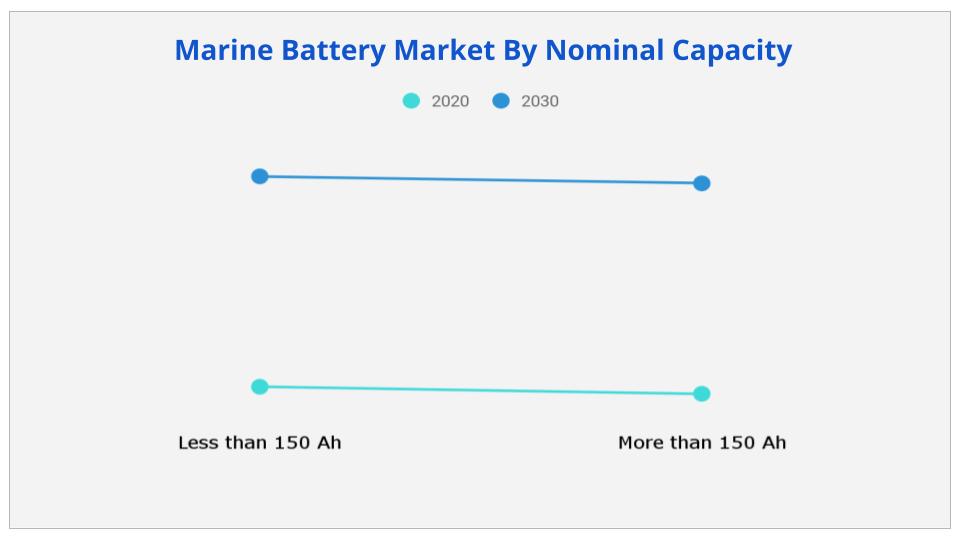
Based on nominal capacity, more than 150 AH will provide significant growth opportunities in the coming years.
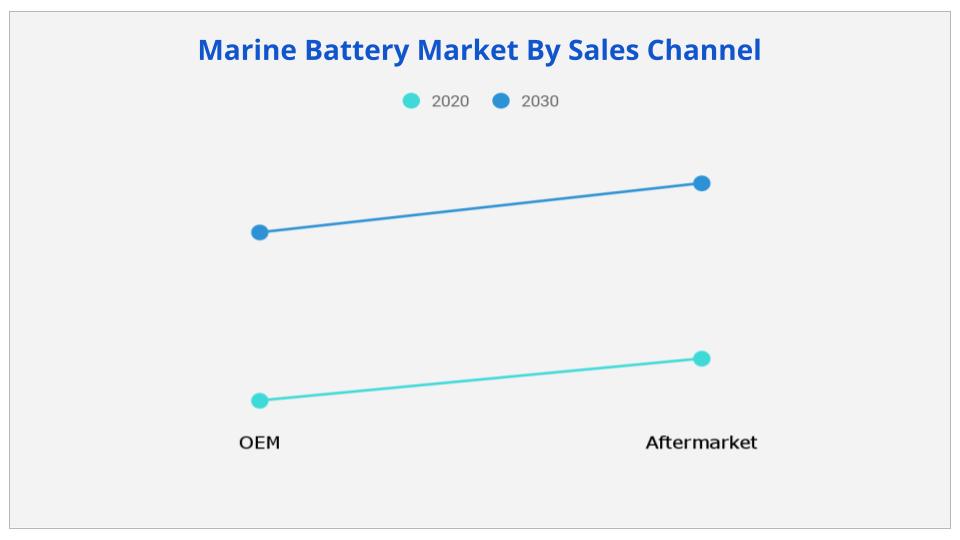
Based on the sales channel, the OEM segment will maintain the lead in the marine battery market share during the coming period.
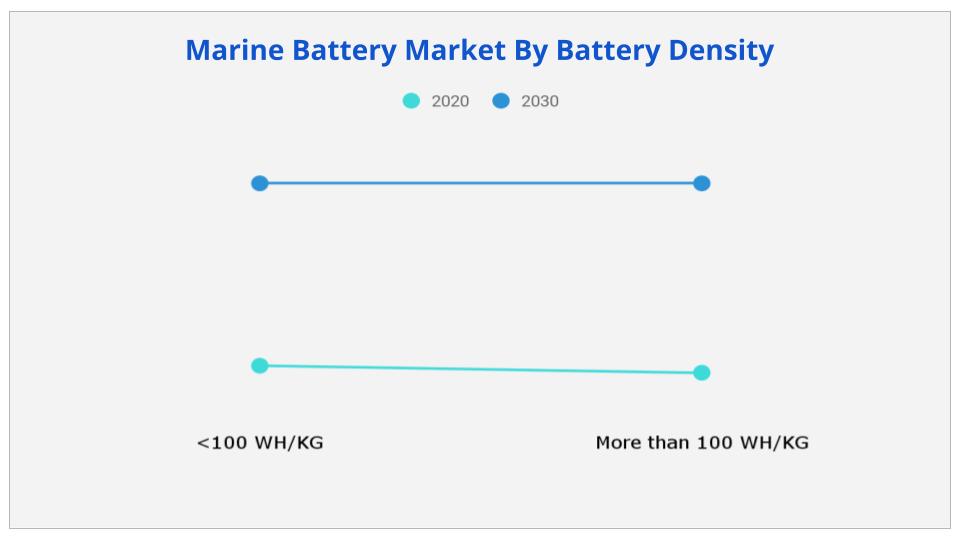
Based on battery density, more than 100 WH/KG will witness huge growth in the market share during the broadcasted period.
| Report Metric |
Details |
| Base Year: |
2020 |
| Market Size in 2021: |
USD 0.37 Billion |
| Forecast Period: |
2021 to 2030 |
| Forecast Period 2021 to 2030 CAGR: |
20.5% |
| 2030 Value Projection: |
USD 1.99 Billion |
| Largest Market |
Asia-Pacific |
| No. of Pages: |
353 |
| Tables & Figures |
198 |
| Charts |
82 |
| Segments covered: |
By Battery Type, Ship Type, Function, Nominal Capacity, Sales Channel, and Battery Density, Regional |
Ans. Global Marine Battery Market size is estimated to grow at a CAGR of 20.5% over the forecast timeframe and reach a market value of around USD 1.99 billion by 2030.
Ans. The global marine battery market value was valued at US$ 0.37 billion in 2021
Ans. The forecast period considered for the global marine battery market is 2021 to 2030
Ans. Increase in automation in marine transportation and Rise in adoption of hybrid and fully electric vessels is expected create significant opportunity for marine battery market
Ans. Based on region, Asia-Pacific will grow at the fastest CAGR of 22.1% during the forecast period.
Ans. Key players operating in the global marine battery market include Akasol AG, EnerSys, Toshiba Corporation, Siemens, Leclanché SA , Saft , Echandia AB, EverExceed Industrial Co, Lifeline Batteries Inc., and Spear Power Systems.
CHAPTER 1:INTRODUCTION
1.1.Report description
1.2.Key benefits for stakeholders
1.3.Key market segments
1.4.Research methodology
1.4.1.Primary research
1.4.2.Secondary research
1.4.3.Analyst tools and models
CHAPTER 2:EXECUTIVE SUMMARY
2.1.CXO perspective
CHAPTER 3:MARKET OVERVIEW
3.1.Market definition and scope
3.2.Key findings
3.2.1.Top impacting factors
3.2.2.Top investment pockets
3.2.3.Top winning strategies
3.3.Porter’s five forces analysis
3.4.Market share analysis (2020)
3.5.Market dynamics
3.5.1.Drivers
3.5.1.1.Increase in demand for marine freight transportation vessels
3.5.1.2.Advantage of lithium-ion battery over lead-acid batteries
3.5.1.3.Increase in water sports and leisure activities
3.5.2.Restraints
3.5.2.1.Limited range and capacity of fully electric ships
3.5.2.2.Maintenance and protection of batteries
3.5.3.Opportunities
3.5.3.1.Increase in automation in marine transportation
3.5.3.2.Rise in adoption of hybrid and fully electric vessels
3.6.Impact of COVID-19 on the market
3.6.1.Evolution of outbreaks
3.6.1.1.COVID-19
3.6.2.Micro-economic impact analysis
3.6.2.1.Consumer trend
3.6.2.2.Technology trends
3.6.2.3.Regulatory trend
3.6.3.COVID-19 impact analysis
CHAPTER 4:MARINE BATTERY MARKET, BATTERY TYPE
4.1.Overview
4.2.Lithium
4.2.1.Key market trends, growth factors, and opportunities
4.2.2.Market size and forecast, by region
4.2.3.Market analysis, by country
4.3.Lead acid
4.3.1.Key market trends, growth factors, and opportunities
4.3.2.Market size and forecast, by region
4.3.3.Market analysis, by country
4.4.Others
4.4.1.Key market trends, growth factors, and opportunities
4.4.2.Market size and forecast, by region
4.4.3.Market analysis, by country
CHAPTER 5:MARINE BATTERY MARKET, BY SHIP TYPE
5.1.Overview
5.2.Commercial
5.2.1.Key market trends, growth factors, and opportunities
5.2.2.Market size and forecast, by region
5.2.3.Market analysis, by country
5.3.Defense
5.3.1.Key market trends, growth factors, and opportunities
5.3.2.Market size and forecast, by region
5.3.3.Market analysis, by country
CHAPTER 6:MARINE BATTERY MARKET, FUNCTION
6.1.Overview
6.2.Starting
6.2.1.Key market trends, growth factors, and opportunities
6.2.2.Market size and forecast, by region
6.2.3.Market analysis, by country
6.3.Deep cycle
6.3.1.Key market trends, growth factors, and opportunities
6.3.2.Market size and forecast, by region
6.3.3.Market analysis, by country
6.4.Dual purpose
6.4.1.Key market trends, growth factors, and opportunities
6.4.2.Market size and forecast, by region
6.4.3.Market analysis, by country
CHAPTER 7:MARINE BATTERY MARKET, BY NOMINAL CAPACITY
7.1.Overview
7.2.Less than150 Ah
7.2.1.Key market trends, growth factors, and opportunities
7.2.2.Market size and forecast, by region
7.2.3.Market analysis, by country
7.3.More than 150 Ah
7.3.1.Key market trends, growth factors, and opportunities
7.3.2.Market size and forecast, by region
7.3.3.Market analysis, by country
CHAPTER 8:MARINE BATTERY MARKET, SALES CHANNEL
8.1.Overview
8.2.OEM
8.2.1.Key market trends, growth factors, and opportunities
8.2.2.Market size and forecast, by region
8.2.3.Market analysis, by country
8.3.Aftermarket
8.3.1.Key market trends, growth factors, and opportunities
8.3.2.Market size and forecast, by region
8.3.3.Market analysis, by country
CHAPTER 9:MARINE BATTERY MARKET, BY BATTERY DENSITY
9.1.Overview
9.2.<100 WH/KG
9.2.1.Key market trends, growth factors, and opportunities
9.2.2.Market size and forecast, by region
9.2.3.Market analysis, by country
9.3.More than 100 WH/KG
9.3.1.Key market trends, growth factors, and opportunities
9.3.2.Market size and forecast, by region
9.3.3.Market analysis, by country
CHAPTER 10:MARINE BATTERY MARKET, BY REGION
10.1.Overview
10.2.North America
10.2.1.Key market trends, growth factors, and opportunities
10.2.2.Market size and forecast, by Battery Type
10.2.3.Market size and forecast, by Ship Type
10.2.4.Market size and forecast, by function
10.2.5.Market size and forecast, by nominal capacity
10.2.6.Market size and forecast, by sales channel
10.2.7.Market size and forecast, by battery density
10.2.8.Market size and forecast, by country
10.2.8.1.U.S.
10.2.8.1.1.Market size and forecast, by Battery Type
10.2.8.1.2.Market size and forecast, by Ship Type
10.2.8.1.3.Market size and forecast, by function
10.2.8.1.4.Market size and forecast, by nominal capacity
10.2.8.1.5.Market size and forecast, by sales channel
10.2.8.1.6.Market size and forecast, by Battery Density
10.2.8.2.Canada
10.2.8.2.1.Market size and forecast, by Battery Type
10.2.8.2.2.Market size and forecast, by Ship Type
10.2.8.2.3.Market size and forecast, by function
10.2.8.2.4.Market size and forecast, by nominal capacity
10.2.8.2.5.Market size and forecast, by sales channel
10.2.8.2.6.Market size and forecast, by Battery Density
10.2.8.3.Mexico
10.2.8.3.1.Market size and forecast, by Battery Type
10.2.8.3.2.Market size and forecast, by Ship Type
10.2.8.3.3.Market size and forecast, by function
10.2.8.3.4.Market size and forecast, by nominal capacity
10.2.8.3.5.Market size and forecast, by sales channel
10.2.8.3.6.Market size and forecast, by Battery Density
10.3.Europe
10.3.1.Key market trends, growth factors, and opportunities
10.3.2.Market size and forecast, by Battery Type
10.3.3.Market size and forecast, by Ship Type
10.3.4.Market size and forecast, by function
10.3.5.Market size and forecast, by nominal capacity
10.3.6.Market size and forecast, by sales channel
10.3.7.Market size and forecast, by battery density
10.3.8.Market size and forecast, by country
10.3.8.1.UK
10.3.8.1.1.Market size and forecast, by Battery Type
10.3.8.1.2.Market size and forecast, by Ship Type
10.3.8.1.3.Market size and forecast, by function
10.3.8.1.4.Market size and forecast, by nominal capacity
10.3.8.1.5.Market size and forecast, by sales channel
10.3.8.1.6.Market size and forecast, by Battery Density
10.3.8.2.Germany
10.3.8.2.1.Market size and forecast, by Battery Type
10.3.8.2.2.Market size and forecast, by Ship Type
10.3.8.2.3.Market size and forecast, by function
10.3.8.2.4.Market size and forecast, by nominal capacity
10.3.8.2.5.Market size and forecast, by sales channel
10.3.8.2.6.Market size and forecast, by Battery Density
10.3.8.3.France
10.3.8.3.1.Market size and forecast, by Battery Type
10.3.8.3.2.Market size and forecast, by Ship Type
10.3.8.3.3.Market size and forecast, by function
10.3.8.3.4.Market size and forecast, by nominal capacity
10.3.8.3.5.Market size and forecast, by sales channel
10.3.8.3.6.Market size and forecast, by Battery Density
10.3.8.4.Italy
10.3.8.4.1.Market size and forecast, by Battery Type
10.3.8.4.2.Market size and forecast, by Ship Type
10.3.8.4.3.Market size and forecast, by function
10.3.8.4.4.Market size and forecast, by nominal capacity
10.3.8.4.5.Market size and forecast, by sales channel
10.3.8.4.6.Market size and forecast, by Battery Density
10.3.8.5.Rest of Europe
10.3.8.5.1.Market size and forecast, by Battery Type
10.3.8.5.2.Market size and forecast, by Ship Type
10.3.8.5.3.Market size and forecast, by function
10.3.8.5.4.Market size and forecast, by nominal capacity
10.3.8.5.5.Market size and forecast, by sales channel
10.3.8.5.6.Market size and forecast, by Battery Density
10.4.Asia-Pacific
10.4.1.Key market trends, growth factors, and opportunities
10.4.2.Market size and forecast, by Battery Type
10.4.3.Market size and forecast, by Ship Type
10.4.4.Market size and forecast, by function
10.4.5.Market size and forecast, by nominal capacity
10.4.6.Market size and forecast, by sales channel
10.4.7.Market size and forecast, by battery density
10.4.8.Market size and forecast, by country
10.4.8.1.China
10.4.8.1.1.Market size and forecast, by Battery Type
10.4.8.1.2.Market size and forecast, by Ship Type
10.4.8.1.3.Market size and forecast, by function
10.4.8.1.4.Market size and forecast, by nominal capacity
10.4.8.1.5.Market size and forecast, by sales channel
10.4.8.1.6.Market size and forecast, by Battery Density
10.4.8.2.Japan
10.4.8.2.1.Market size and forecast, by Battery Type
10.4.8.2.2.Market size and forecast, by Ship Type
10.4.8.2.3.Market size and forecast, by function
10.4.8.2.4.Market size and forecast, by nominal capacity
10.4.8.2.5.Market size and forecast, by sales channel
10.4.8.2.6.Market size and forecast, by Battery Density
10.4.8.3.India
10.4.8.3.1.Market size and forecast, by Battery Type
10.4.8.3.2.Market size and forecast, by Ship Type
10.4.8.3.3.Market size and forecast, by function
10.4.8.3.4.Market size and forecast, by nominal capacity
10.4.8.3.5.Market size and forecast, by sales channel
10.4.8.3.6.Market size and forecast, by Battery Density
10.4.8.4.South Korea
10.4.8.4.1.Market size and forecast, by Battery Type
10.4.8.4.2.Market size and forecast, by Ship Type
10.4.8.4.3.Market size and forecast, by function
10.4.8.4.4.Market size and forecast, by nominal capacity
10.4.8.4.5.Market size and forecast, by sales channel
10.4.8.4.6.Market size and forecast, by Battery Density
10.4.8.5.Rest of Asia-Pacific
10.4.8.5.1.Market size and forecast, by Battery Type
10.4.8.5.2.Market size and forecast, by Ship Type
10.4.8.5.3.Market size and forecast, by function
10.4.8.5.4.Market size and forecast, by nominal capacity
10.4.8.5.5.Market size and forecast, by sales channel
10.4.8.5.6.Market size and forecast, by Battery Density
10.5.LAMEA
10.5.1.Key market trends, growth factors, and opportunities
10.5.2.Market size and forecast, by Battery Type
10.5.3.Market size and forecast, by Ship Type
10.5.4.Market size and forecast, by function
10.5.5.Market size and forecast, by nominal capacity
10.5.6.Market size and forecast, by sales channel
10.5.7.Market size and forecast, by battery density
10.5.8.Market size and forecast, by country
10.5.8.1.Latin America
10.5.8.1.1.Market size and forecast, by Battery Type
10.5.8.1.2.Market size and forecast, by Ship Type
10.5.8.1.3.Market size and forecast, by function
10.5.8.1.4.Market size and forecast, by nominal capacity
10.5.8.1.5.Market size and forecast, by sales channel
10.5.8.1.6.Market size and forecast, by Battery Density
10.5.8.2.Middle East
10.5.8.2.1.Market size and forecast, by Battery Type
10.5.8.2.2.Market size and forecast, by Ship Type
10.5.8.2.3.Market size and forecast, by function
10.5.8.2.4.Market size and forecast, by nominal capacity
10.5.8.2.5.Market size and forecast, by sales channel
10.5.8.2.6.Market size and forecast, by Battery Density
10.5.8.3.Africa
10.5.8.3.1.Market size and forecast, by Battery Type
10.5.8.3.2.Market size and forecast, by Ship Type
10.5.8.3.3.Market size and forecast, by function
10.5.8.3.4.Market size and forecast, by nominal capacity
10.5.8.3.5.Market size and forecast, by sales channel
10.5.8.3.6.Market size and forecast, by Battery Density
CHAPTER 11:COMPANY PROFILES
11.1.AKASOL AG.
11.1.1.Company overview
11.1.2.Key executives
11.1.3.Company snapshot
11.1.4.Operating business segments
11.1.5.Product portfolio
11.1.6.R&D expenditure
11.1.7.Business performance
11.1.8.Key strategic moves and developments
11.2.ENERSYS
11.2.1.Company overview
11.2.2.Key executives
11.2.3.Company snapshot
11.2.4.Operating business segments
11.2.5.Product portfolio
11.2.6.Business performance
11.2.7.Key strategic moves and developments
11.3.TOSHIBA CORPORATION
11.3.1.Company overview
11.3.2.Key executives
11.3.3.Company snapshot
11.3.4.Operating business segments
11.3.5.Product portfolio
11.3.6.R&D expenditure
11.3.7.Business performance
11.3.8.Key strategic moves and developments
11.4.SIEMENS
11.4.1.Company overview
11.4.2.Key executives
11.4.3.Company snapshot
11.4.4.Operating business segments
11.4.5.Product portfolio
11.4.6.R&D expenditure
11.4.7.Business performance
11.4.8.Key strategic moves and developments
11.5.Leclanché SA
11.5.1.Company overview
11.5.2.Key executives
11.5.3.Company snapshot
11.5.4.Operating business segments
11.5.5.Product portfolio
11.5.6.R&D expenditure
11.5.7.Business performance
11.5.8.Key strategic moves and developments
11.6.SAFT
11.6.1.Company overview
11.6.2.Key executives
11.6.3.Company snapshot
11.6.4.Operating business segments
11.6.5.Product portfolio
11.6.6.R&D expenditure
11.6.7.Business performance
11.7.ECHANDIA AB
11.7.1.Company overview
11.7.2.Key executives
11.7.3.Company snapshot
11.7.4.Product portfolio
11.7.5.Key strategic moves and developments
11.8.EVEREXCEED INDUSTRIAL CO., LTD.
11.8.1.Company overview
11.8.2.Key executive
11.8.3.Company snapshot
11.8.4.Product portfolio
11.9.LIFELINE BATTERIES INC.
11.9.1.Company overview
11.9.2.Key executives
11.9.3.Company snapshot
11.9.4.Product portfolio
11.10.SPEAR POWER SYSTEMS
11.10.1.Company overview
11.10.2.Key executives
11.10.3.Company snapshot
11.10.4.Operating business segments
11.10.5.Product portfolio
11.10.6.R&D expenditure
11.10.7.Business performance
11.10.8.Key strategic moves and developments
Tables & Figures :
Table 01.Marine Battery Market, By Battery Type, 2020–2030 ($Million)
Table 02.Lithium Marine Battery Market, By Region, 2020–2030 ($Million)
Table 03.Lead Acid Marine Battery Market, By Region, 2020–2030 ($Million)
Table 04.Others Marine Battery Market, By Region, 2020–2030 ($Million)
Table 05.Marine Battery Market, By Ship Type, 2020–2030 ($Million)
Table 06.Commercial Marine Battery Market, By Region, 2020–2030 ($Million)
Table 07.Defense Marine Battery Market, By Region, 2020–2030 ($Million)
Table 08.Marine Battery Market, By Function, 2020–2030 ($Million)
Table 09.Starting Marine Battery Market, By Region, 2020–2030 ($Million)
Table 10.Deep Cycle Marine Battery Market, By Region, 2020–2030 ($Million)
Table 11.Dual Purpose Marine Battery Market, By Region, 2020–2030 ($Million)
Table 12.Marine Battery Market, By Nominal Capacity, 2020–2030 ($Million)
Table 13.Less Than 150 Ah Marine Battery Market, By Region, 2020–2030 ($Million)
Table 14.More Than 150 Ah Marine Battery Market, By Region, 2020–2030 ($Million)
Table 15.Marine Battery Market, By Sales Channel, 2020–2030 ($Million)
Table 16.Marine Battery Market For Oem, By Region, 2020–2030 ($Million)
Table 17.Marine Battery Market For Aftermarket, By Region, 2020–2030 ($Million)
Table 18.Marine Battery Market, By Battery Density, 2020–2030 ($Million)
Table 19.<100 Wh/Kg Marine Battery Market, By Region, 2020–2030 ($Million)
Table 20.More Than 100 Wh/Kg Marine Battery Market, By Region, 2020–2030 ($Million)
Table 21.Marine Battery Market, By Region, 2020–2030 ($Million)
Table 22.North America Marine Battery Market, By Battery Type, 2020–2030 ($Million)
Table 23.North America Marine Battery Market, By Ship Type, 2020–2030 ($Million)
Table 24.North America Marine Battery Market, By Function, 2020–2030 ($Million)
Table 25.North America Marine Battery Market, By Nominal Capacity, 2020–2030 ($Million)
Table 26.North America Marine Battery Market, By Sales Channel, 2020–2030 ($Million)
Table 27.North America Marine Battery Market, By Battery Density, 2020–2030 ($Million)
Table 28.U.S. Marine Battery Market, By Battery Type, 2020–2030 ($Million)
Table 29.U.S. Marine Battery Market, By Ship Type, 2020–2030 ($Million)
Table 30.U.S. Marine Battery Market, By Function, 2020–2030 ($Million)
Table 31.U.S. Marine Battery Market, By Nominal Capacity, 2020–2030 ($Million)
Table 32.U.S. Marine Battery Market, By Sales Channel, 2020–2030 ($Million)
Table 33.U.S. Marine Battery Market, By Battery Density, 2020–2030 ($Million)
Table 34.Canada Marine Battery Market, By Battery Type, 2020–2030 ($Million)
Table 35.Canada Marine Battery Market, By Ship Type, 2020–2030 ($Million)
Table 36.Canada Marine Battery Market, By Function, 2020–2030 ($Million)
Table 37.Canada Marine Battery Market, By Nominal Capacity, 2020–2030 ($Million)
Table 38.Canada Marine Battery Market, By Sales Channel, 2020–2030 ($Million)
Table 39.Canada Marine Battery Market, By Battery Density, 2020–2030 ($Million)
Table 40.Mexico Marine Battery Market, By Battery Type, 2020–2030 ($Million)
Table 41.Mexico Marine Battery Market, By Ship Type, 2020–2030 ($Million)
Table 42.Mexico Marine Battery Market, By Function, 2020–2030 ($Million)
Table 43.Mexico Marine Battery Market, By Nominal Capacity, 2020–2030 ($Million)
Table 44.Mexico Marine Battery Market, By Sales Channel, 2020–2030 ($Million)
Table 45.Mexico Marine Battery Market, By Battery Density, 2020–2030 ($Million)
Table 46.Europe Marine Battery Market, By Battery Type, 2020–2030 ($Million)
Table 47.Europe Marine Battery Market, By Ship Type, 2020–2030 ($Million)
Table 48.Europe Marine Battery Market, By Function, 2020–2030 ($Million)
Table 49.Europe Marine Battery Market, By Nominal Capacity, 2020–2030 ($Million)
Table 50.Europe Marine Battery Market, By Sales Channel, 2020–2030 ($Million)
Table 51.Europe Marine Battery Market, By Battery Density, 2020–2030 ($Million)
Table 52.Uk Marine Battery Market, By Battery Type, 2020–2030 ($Million)
Table 53.Uk Marine Battery Market, By Ship Type, 2020–2030 ($Million)
Table 54.Uk Marine Battery Market, By Function, 2020–2030 ($Million)
Table 55.Uk Marine Battery Market, By Nominal Capacity, 2020–2030 ($Million)
Table 56.Uk Marine Battery Market, By Sales Channel, 2020–2030 ($Million)
Table 57.Uk Marine Battery Market, By Battery Density, 2020–2030 ($Million)
Table 58.Germany Marine Battery Market, By Battery Type, 2020–2030 ($Million)
Table 59.Germany Marine Battery Market, By Ship Type, 2020–2030 ($Million)
Table 60.Germany Marine Battery Market, By Function, 2020–2030 ($Million)
Table 61.Germany Marine Battery Market, By Nominal Capacity, 2020–2030 ($Million)
Table 62.Germany Marine Battery Market, By Sales Channel, 2020–2030 ($Million)
Table 63.Germany Marine Battery Market, By Battery Density, 2020–2030 ($Million)
Table 64.France Marine Battery Market, By Battery Type, 2020–2030 ($Million)
Table 65.France Marine Battery Market, By Ship Type, 2020–2030 ($Million)
Table 66.France Marine Battery Market, By Function, 2020–2030 ($Million)
Table 67.France Marine Battery Market, By Nominal Capacity, 2020–2030 ($Million)
Table 68.France Marine Battery Market, By Sales Channel, 2020–2030 ($Million)
Table 69.France Marine Battery Market, By Battery Density, 2020–2030 ($Million)
Table 70.Italy Marine Battery Market, By Battery Type, 2020–2030 ($Million)
Table 71.Italy Marine Battery Market, By Ship Type, 2020–2030 ($Million)
Table 72.Italy Marine Battery Market, By Function, 2020–2030 ($Million)
Table 73.Italy Marine Battery Market, By Nominal Capacity, 2020–2030 ($Million)
Table 74.Italy Marine Battery Market, By Sales Channel, 2020–2030 ($Million)
Table 75.Italy Marine Battery Market, By Battery Density, 2020–2030 ($Million)
Table 76.Rest Of Europe Marine Battery Market, By Battery Type, 2020–2030 ($Million)
Table 77.Rest Of Europe Marine Battery Market, By Ship Type, 2020–2030 ($Million)
Table 78.Rest Of Europe Marine Battery Market, By Function, 2020–2030 ($Million)
Table 79.Rest Of Europe Marine Battery Market, By Nominal Capacity, 2020–2030 ($Million)
Table 80.Rest Of Europe Marine Battery Market, By Sales Channel, 2020–2030 ($Million)
Table 81.Rest Of Europe Marine Battery Market, By Battery Density, 2020–2030 ($Million)
Table 82.Asia-Pacific Marine Battery Market, By Battery Type, 2020–2030 ($Million)
Table 83.Asia-Pacific Marine Battery Market, By Ship Type, 2020–2030 ($Million)
Table 84.Asia-Pacific Marine Battery Market, By Function, 2020–2030 ($Million)
Table 85.Asia-Pacific Marine Battery Market, By Nominal Capacity, 2020–2030 ($Million)
Table 86.Asia-Pacific Marine Battery Market, By Sales Channel, 2020–2030 ($Million)
Table 87.Asia-Pacific Marine Battery Market, By Battery Density, 2020–2030 ($Million)
Table 88.China Marine Battery Market, By Battery Type, 2020–2030 ($Million)
Table 89.China Marine Battery Market, By Ship Type, 2020–2030 ($Million)
Table 90.China Marine Battery Market, By Function, 2020–2030 ($Million)
Table 91.China Marine Battery Market, By Nominal Capacity, 2020–2030 ($Million)
Table 92.China Marine Battery Market, By Sales Channel, 2020–2030 ($Million)
Table 93.China Marine Battery Market, By Battery Density, 2020–2030 ($Million)
Table 94.Japan Marine Battery Market, By Battery Type, 2020–2030 ($Million)
Table 95.Japan Marine Battery Market, By Ship Type, 2020–2030 ($Million)
Table 96.Japan Marine Battery Market, By Function, 2020–2030 ($Million)
Table 97.Japan Marine Battery Market, By Nominal Capacity, 2020–2030 ($Million)
Table 98.Japan Marine Battery Market, By Sales Channel, 2020–2030 ($Million)
Table 99.Japan Marine Battery Market, By Battery Density, 2020–2030 ($Million)
Table 100.India Marine Battery Market, By Battery Type, 2020–2030 ($Million)
Table 101.India Marine Battery Market, By Ship Type, 2020–2030 ($Million)
Table 102.India Marine Battery Market, By Function, 2020–2030 ($Million)
Table 103.India Marine Battery Market, By Nominal Capacity, 2020–2030 ($Million)
Table 104.India Marine Battery Market, By Sales Channel, 2020–2030 ($Million)
Table 105.India Marine Battery Market, By Battery Density, 2020–2030 ($Million)
Table 106.South Korea Marine Battery Market, By Battery Type, 2020–2030 ($Million)
Table 107.South Korea Marine Battery Market, By Ship Type, 2020–2030 ($Million)
Table 108.South Korea Marine Battery Market, By Function, 2020–2030 ($Million)
Table 109.South Korea Marine Battery Market, By Nominal Capacity, 2020–2030 ($Million)
Table 110.South Korea Marine Battery Market, By Sales Channel, 2020–2030 ($Million)
Table 111.South Korea Marine Battery Market, By Battery Density, 2020–2030 ($Million)
Table 112.Rest Of Asia-Pacific Marine Battery Market, By Battery Type, 2020–2030 ($Million)
Table 113.Rest Of Asia-Pacific Marine Battery Market, By Ship Type, 2020–2030 ($Million)
Table 114.Rest Of Asia-Pacific Marine Battery Market, By Function, 2020–2030 ($Million)
Table 115.Rest Of Asia-Pacific Marine Battery Market, By Nominal Capacity, 2020–2030 ($Million)
Table 116.Rest Of Asia-Pacific Marine Battery Market, By Sales Channel, 2020–2030 ($Million)
Table 117.Rest Of Asia-Pacific Marine Battery Market, By Battery Density, 2020–2030 ($Million)
Table 118.Lamea Marine Battery Market, By Battery Type, 2020–2030 ($Million)
Table 119.Lamea Marine Battery Market, By Ship Type, 2020–2030 ($Million)
Table 120.Lamea Marine Battery Market, By Function, 2020–2030 ($Million)
Table 121.Lamea Marine Battery Market, By Nominal Capacity, 2020–2030 ($Million)
Table 122.Lamea Marine Battery Market, By Sales Channel, 2020–2030 ($Million)
Table 123.Lamea Marine Battery Market, By Battery Density, 2020–2030 ($Million)
Table 124.Latin America Marine Battery Market, By Battery Type, 2020–2030 ($Million)
Table 125.Latin America Marine Battery Market, By Ship Type, 2020–2030 ($Million)
Table 126.Latin America Marine Battery Market, By Function, 2020–2030 ($Million)
Table 127.Latin America Marine Battery Market, By Nominal Capacity, 2020–2030 ($Million)
Table 128.Latin America Marine Battery Market, By Sales Channel, 2020–2030 ($Million)
Table 129.Latin America Marine Battery Market, By Battery Density, 2020–2030 ($Million)
Table 130.Middle East Marine Battery Market, By Battery Type, 2020–2030 ($Million)
Table 131.Middle East Marine Battery Market, By Ship Type, 2020–2030 ($Million)
Table 132.Middle East Marine Battery Market, By Function, 2020–2030 ($Million)
Table 133.Middle East Marine Battery Market, By Nominal Capacity, 2020–2030 ($Million)
Table 134.Middle East Marine Battery Market, By Sales Channel, 2020–2030 ($Million)
Table 135.Middle East Marine Battery Market, By Battery Density, 2020–2030 ($Million)
Table 136.Africa Marine Battery Market, By Battery Type, 2020–2030 ($Million)
Table 137.Africa Marine Battery Market, By Ship Type, 2020–2030 ($Million)
Table 138.Africa Marine Battery Market, By Function, 2020–2030 ($Million)
Table 139.Africa Marine Battery Market, By Nominal Capacity, 2020–2030 ($Million)
Table 140.Africa Marine Battery Market, By Sales Channel, 2020–2030 ($Million)
Table 141.Africa Marine Battery Market, By Battery Density, 2020–2030 ($Million)
Table 142.Akasol Ag.: Key Executives
Table 143.Akasol Ag.: Company Snapshot
Table 144.Akasol Ag.: Operating Segments
Table 145.Akasol Ag.: Product Portfolio
Table 146.Akasol Ag.: R&D Expenditure, 2018–2020 ($Million)
Table 147.Akasol Ag.: Net Sales, 2018–2020 ($Million)
Table 148.Akasol Ag.: Key Strategic Moves And Developments
Table 149.Raytheon Technologies Corporation:Key Executives
Table 150.Enersys: Company Snapshot
Table 151.Enersys: Operating Segments
Table 152.Enersys: Product Portfolio
Table 153.Enersys: Net Sales, 2018–2020 ($Million)
Table 154.Enersys: Key Strategic Moves And Developments
Table 155.Toshiba Corporation: Key Executives
Table 156.Toshiba Corporation: Company Snapshot
Table 157.Toshiba Corporation: Operating Segments
Table 158.Toshiba Corporation: Product Portfolio
Table 159.Toshiba Corporation: R&D Expenditure, 2018–2020 ($Million)
Table 160.Toshiba Corporation: Net Sales, 2018–2020 ($Million)
Table 161.Toshiba Corporation: Key Strategic Moves And Developments
Table 162.Siemens: Key Executives
Table 163.Siemens: Company Snapshot
Table 164.Siemens: Operating Segments
Table 165.Siemens: Product Portfolio
Table 166.Siemens: R&D Expenditure, 2018–2020 ($Million)
Table 167.Siemens: Net Sales, 2018–2020 ($Million)
Table 168.Siemens: Key Strategic Moves And Developments
Table 169.Leclanché Sa: Key Executives
Table 170.Leclanché Sa: Company Snapshot
Table 171.Leclanché Sa: Operating Segments
Table 172.Leclanché Sa: Product Portfolio
Table 173.Leclanché Sa: R&D Expenditure, 2018–2020 ($Million)
Table 174.Leclanché Sa: Net Sales, 2018–2020 ($Million)
Table 175.Leclanché Sa: Key Strategic Moves And Developments
Table 176.Saft: Key Executives
Table 177.Saft: Company Snapshot
Table 178.Saft Operating Segments
Table 179.Saft: Product Portfolio
Table 180.Saft: R&D Expenditure, 2018–2020 ($Million)
Table 181.Saft: Net Sales, 2018–2020 ($Million)
Table 182.Echandia Ab: Key Executives
Table 183.Echandia Ab: Company Snapshot
Table 184.Echandia Ab: Product Portfolio
Table 185.Echandia Ab: Key Strategic Moves And Developments
Table 186.Everexceed Industrial Co., Ltd: Key Executive
Table 187.Everexceed Industrial Co., Ltd: Company Snapshot
Table 188.Everexceed Industrial Co., Ltd: Product Portfolio
Table 189.Lifeline Batteries Inc.: Key Executives
Table 190.Lifeline Batteries Inc.: Company Snapshot
Table 191.Lifeline Batteries Inc.: Product Portfolio
Table 192.Spear Power Systems: Key Executives
Table 193.Spear Power Systems: Company Snapshot
Table 194.Spear Power Systems Operating Segments
Table 195.Spear Power Systems: Product Portfolio
Table 196.Spear Power Systems: R&D Expenditure, 2018–2020 ($Million)
Table 197.Spear Power Systems: Net Sales, 2018–2020 ($Million)
Table 198.Spear Power Systems: Key Strategic Moves And Developments
List Of Figures
Figure 01.Key Market Segments
Figure 02.Global Marine Battery Market Snapshot, By Segmentation, 2021–2030
Figure 03.Marine Battery Market Snapshot, By Region, 2021–2030
Figure 04.Top Impacting Factors
Figure 05.Top Investment Pockets
Figure 06.Top Winning Strategies, By Year, 2018–2021*
Figure 07.Top Winning Strategies, By Year, 2018–2021*
Figure 08.Top Winning Strategies, By Company, 2018–2021*
Figure 09.Moderate To High Bargaining Power Of Suppliers
Figure 10.Moderate Bargaining Power Of Buyers
Figure 11.Moderate-To-High Of New Entrants
Figure 12.Moderate Of Substitutes
Figure 13.Moderate To High Competitive Rivalary
Figure 14.Market Share Analysis (2020)
Figure 15.Marine Battery Market Share, By Battery Type, 2020–2030 (%)
Figure 16.Comparative Share Analysis Of Lithum Marine Battery Market, By Country, 2020 & 2030 ($Million)
Figure 17.Comparative Share Analysis Of Lead Acid Marine Battery Market, By Country, 2020 & 2030 ($Million)
Figure 18.Comparative Share Analysis Of Others Marine Battery Market, By Country, 2020 & 2030 ($Million)
Figure 19.Marine Battery Market Share, By Ship Type, 2020–2030 (%)
Figure 20.Comparative Share Analysis Of Commercial Marine Battery Market, By Country, 2020 & 2030 ($Million)
Figure 21.Comparative Share Analysis Of Defense Marine Battery Market, By Country, 2020 & 2030 ($Million)
Figure 22.Marine Battery Market Share, By Function, 2020–2030 (%)
Figure 23.Comparative Share Analysis Of Starting Marine Battery Market, By Country, 2020 & 2030 ($Million)
Figure 24.Comparative Share Analysis Of Deep Cycle Marine Battery Market, By Country, 2020 & 2030 ($Milliion)
Figure 25.Comparative Share Analysis Of Dual Purpose Marine Battery Market, By Country, 2020 & 2030 ($Million)
Figure 26.Marine Battery Market Share, By Nominal Capacity, 2020–2030 (%)
Figure 27.Comparative Share Analysis Of Less Than 150 Ah Marine Battery Market, By Country, 2020 & 2030 ($Million)
Figure 28.Comparative Share Analysis Of More Than 150 Ah Marine Battery Market, By Country, 2020 & 2030 ($Million)
Figure 29.Marine Battery Market Share, By Sales Channel, 2020–2030 (%)
Figure 30.Comparative Share Analysis Of Marine Battery Market For Oem, By Country, 2020 & 2030 ($Million)
Figure 31.Comparative Share Analysis Of Marine Battery Market For Aftermarket, By Country, 2020 & 2030 ($Milliion)
Figure 32.Marine Battery Market Share, By Battery Density, 2020–2030 (%)
Figure 33.Comparative Share Analysis Of <100 Wh/Kg Marine Battery Market, By Country, 2020 & 2030 ($Million)
Figure 34.Comparative Share Analysis Of More Than 100 Wh/Kg Marine Battery Market, By Country, 2020 & 2030 ($Million)
Figure 35.Marine Battery Market, By Region, 2021–2030 (%)
Figure 36.Comparative Share Analysis Of Marine Battery Market, By Country, 2020–2030 (%)
Figure 37.U.S. Marine Battery Market, 2020–2030 ($Million)
Figure 38.Canada Marine Battery Market, 2020–2030 ($Million)
Figure 39.Mexico Marine Battery Market, 2020–2030 ($Million)
Figure 40.Comparative Share Analysis Of Marine Battery Market, By Country, 2020–2030 (%)
Figure 41.Uk Marine Battery Market, 2020–2030 ($Million)
Figure 42.Germany Marine Battery Market, 2020–2030 ($Million)
Figure 43.France Marine Battery Market, 2020–2030 ($Million)
Figure 44.Italy Marine Battery Market, 2020–2030 ($Million)
Figure 45.Rest Of Europe Marine Battery Market, 2020–2030 ($Million)
Figure 46.Comparative Share Analysis Of Marine Battery Market, By Country, 2020–2030 (%)
Figure 47.China Marine Battery Market, 2020–2030 ($Million)
Figure 48.Japan Marine Battery Market, 2020–2030 ($Million)
Figure 49.India Marine Battery Market, 2020–2030 ($Million)
Figure 50.South Korea Marine Battery Market, 2020–2030 ($Million)
Figure 51.Rest Of Asia-Pacific Marine Battery Market, 2020–2030 ($Million)
Figure 52.Comparative Share Analysis Of Marine Battery Market, By Country, 2020–2030 (%)
Figure 53.Latin America Marine Battery Market, 2020–2030 ($Million)
Figure 54.Middle East Marine Battery Market, 2020–2030 ($Million)
Figure 55.Africa Marine Battery Market, 2020–2030 ($Million)
Figure 56.Akasol Ag.: R&D Expenditure, 2018–2020 ($Million)
Figure 57.Akasol Ag.: Net Sales, 2018–2020 ($Million)
Figure 58.Akasol Ag.: Revenue Share By Segment, 2020 (%)
Figure 59.Akasol Ag.: Revenue Share By Region, 2020 (%)
Figure 60.Enersys: Net Sales, 2018–2020 ($Million)
Figure 61.Enersys: Revenue Share By Segment, 2020 (%)
Figure 62.Enersys: Revenue Share By Region, 2020 (%)
Figure 63.Toshiba Corporation: R&D Expenditure, 2018–2020 ($Million)
Figure 64.Toshiba Corporation: Net Sales, 2018–2020 ($Million)
Figure 65.Toshiba Corporation: Revenue Share By Segment, 2020 (%)
Figure 66.Toshiba Corporation: Revenue Share By Region, 2020 (%)
Figure 67.Siemens: R&D Expenditure, 2018–2020 ($Million)
Figure 68.Siemens: Net Sales, 2018–2020 ($Million)
Figure 69.Siemens: Revenue Share By Segment, 2020 (%)
Figure 70.Siemens: Revenue Share By Region, 2020 (%)
Figure 71.Leclanché Sa: R&D Expenditure, 2018–2020 ($Million)
Figure 72.Leclanché Sa: Net Sales, 2018–2020 ($Million)
Figure 73.Leclanché Sa: Revenue Share By Segment, 2020 (%)
Figure 74.Leclanché Sa: Revenue Share By Region, 2020 (%)
Figure 75.Saft: R&D Expenditure, 2018–2020 ($Million)
Figure 76.Saft: Net Sales, 2018–2020 ($Million)
Figure 77.Saft: Revenue Share By Segment, 2020 (%)
Figure 78.Saft: Revenue Share By Region, 2020 (%)
Figure 79.Spear Power Systems: R&D Expenditure, 2018–2020 ($Million)
Figure 80.Spear Power Systems: Net Sales, 2018–2020 ($Million)
Figure 81.Spear Power Systems: Revenue Share By Segment, 2020 (%)
Figure 82.Spear Power Systems: Revenue Share By Region, 2020 (%)
$5769
$9995
HAVE A QUERY?
OUR CUSTOMER

SIMILAR REPORTS
Add to Cart
Add to Cart
Add to Cart
Add to Cart