
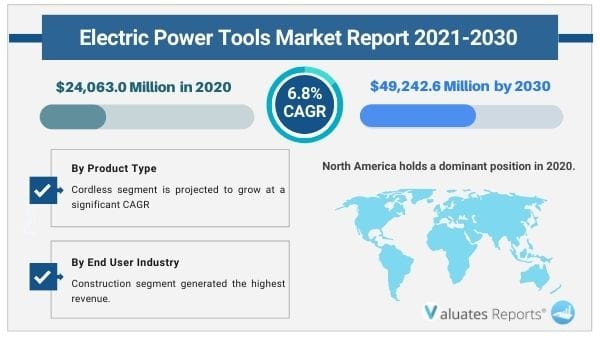
The global electric power tools market size is expected to generate revenue worth $24,063.0 million in 2020 and is projected to reach $49,242.6 million by 2030, registering a CAGR of 6.8% during the forecast period. The COVID 19 outbreak has affected the growth of the electric power tools industry owing to the lockdown measure in different countries and delay in manufacturing and production of wide variety of electric power tools.
Electric power tools have a diversified portfolio that finds application in every construction, manufacturing, or material modification activity. The advancements in electric power tools have revolutionized the way of working, by providing ease and saving time of operation. Thus, the diverse functionality of these tools makes them suitable for use in various applications including professional, residential, and commercial establishments. Electric power tools are available in corded and cordless platforms with varied power capacities. Initially, electric power tools were intended for small jobs, however, the improved mechanisms and batteries have improved the functionality and penetration of use for large scale jobs. Further, electric power tools are used for drilling, sawing, planning, cutting (metal, soft materials, wood, and others), grinding, compacting, hammering, and various other operations.
The growth in construction activities and requirement of efficient power tools for various operations has led to the increased penetration of electric power tools in the construction industry. The basic operations such as cutting, chopping, drilling, hammering, and grinding can be easily completed using cordless power tools with more efficiency and ease. Thus, surge in adoption of electric power tools in the construction industry is expected to drive the electric power tools market growth. Moreover, the necessity of heavy-duty electric power tools has led to constant product developments in terms of batteries, motors, and other technologies.
The recent product development is the integration of brushless motors in the power tools. Although brushless motor technology is not new, the adoption of brushless DC motors in both corded and cordless power tools has upgraded their capabilities to a large extent. Hence, the integration of brushless DC motors (BLDC) in electric power tools has revolutionized the electric power tools industry; thereby, propelling the growth of the electric power tools. Furthermore, growth in popularity of cordless electric power tools, owing to its application in various remote locations, effortlessness of use, and portability are some of the factors that fuel the adoption of cordless tools. This increased adoption drives the overall electric power tools market globally.
Conversely, the high initial cost of electric power tools is one of the major restraining factors for the growth of the market. The pneumatic power tools have been popular for a long time, owing to their high productivity capacities and comparatively lower costs than the electric counterparts. This is likely to negatively affect the growth of the electric power tools market.
The major electric power tool manufacturers have employed automation technologies to manage their electric power tools during the operations. The penetration of automation has made it feasible for the operators to track, connect, and customize their tools on multiple jobsites and hence, attain more productivity through the same electric power tool. Such automation technologies are likely to assist in creating the global electric power tools market opportunities during the forecast period.
The electric power tools market is segmented on the basis of product type, end-user industry, and region. Based on the product type, the market is bifurcated into corded and cordless. By end-user industry, it is classified into construction, automotive, aerospace, and others. The others segment includes energy and DIY end users of electric power tools. The cordless segment is projected to dominate the global electric power tools throughout the forecast period.
The electric power tools market is analyzed across North America (the U.S., Canada, and Mexico), Europe (Germany, France, the UK, Italy, Russia, and rest of Europe), Asia-Pacific (India, China, Japan, and rest of Asia-Pacific), and LAMEA (Latin America, Middle East, and Africa). North America is expected to hold the largest market share throughout the study period, however, LAMEA region is expected to grow at the fastest rate after Asia-Pacific.
The key players profiled in the market report include Apex Tool Group, Atlas Copco AB, Hilti Corporation, Ingersoll Rand Inc., Koki Holding, Co., Ltd., Makita Corporation, Robert Bosch GmbH, Stanley Black & Decker, Inc., Snap-on Incorporated, and Techtronic Industries Co., Ltd.
Major players have adopted acquisition and product launch as key developmental strategies to improve the product portfolio of the global electric power tools market share. For instance, in August 2019, Bosch launched new 18 V cordless screwdrivers for professionals. The products include cordless drill/driver GSR 18V-55 Professional and the cordless combi drill GSB 18V-55 Professional. They offer maximum torque of 55 newton meters and up to 1,800 rpm.
CHAPTER 1:INTRODUCTION
1.1.REPORT DESCRIPTION
1.2.KEY BENEFITS FOR STAKEHOLDERS
1.3.KEY MARKET SEGMENTS
1.4.KEY MARKET PLAYERS
1.5.RESEARCH METHODOLOGY
1.5.1.Primary research
1.5.2.Secondary research
1.5.3.Analyst tools and models
CHAPTER 2:EXECUTIVE SUMMARY
2.1.KEY FINDINGS OF THE ELECTRIC POWER TOOLS MARKET:
2.1.1.Top investment pockets
2.2.CXO PERSPECTIVE
CHAPTER 3:MARKET OVERVIEW
3.1.MARKET DEFINITION AND SCOPE
3.2.KEY FORCES SHAPING ELECTRIC POWER TOOLS INDUSTRY
3.3.KEY MARKET PLAYERS IN ELECTRIC POWER TOOLS MARKET
3.4.GLOBAL ELECTRIC POWER TOOLS MARKET SHARE ANALYSIS 2020
3.5.MARKET DYNAMICS
3.5.1.Drivers
3.5.1.1.Increase in adoption of electric power tools in the construction industry
3.5.1.2.Integration of brushless motors in electric power tools
3.5.1.3.Growth in popularity of cordless power tools
3.5.2.Restraint
3.5.2.1.High initial costs of the electric power tools
3.5.3.Opportunity
3.5.3.1.Technological Innovations
3.6.COVID-19 IMPACT ANALYSIS
CHAPTER 4:ELECTRIC POWER TOOLS MARKET, BY PRODUCT TYPE
4.1.MARKET OVERVIEW
4.1.1.Market size and forecast, by product type
4.2.CORDED POWER TOOLS
4.2.1.Key market trends, growth factors, and opportunities
4.2.2.Market size and forecast, by region
4.2.3.Market analysis, by country
4.3.CORDLESS POWER TOOLS
4.3.1.Key market trends, growth factors, and opportunities
4.3.2.Market size and forecast, by region
4.3.3.Market analysis, by country
CHAPTER 5:ELECTRIC POWER TOOLS MARKET, BY END USER INDUSTRY
5.1.MARKET OVERVIEW
5.1.1.Market size and forecast, by end-user industry
5.2.CONSTRUCTION
5.2.1.Key market trends, growth factors, and opportunities
5.2.2.Market size and forecast, by region
5.2.3.Market analysis, by country
5.3.AUTOMOTIVE
5.3.1.Key market trends, growth factors, and opportunities
5.3.2.Market size and forecast, by region
5.3.3.Market analysis, by country
5.4.AEROSPACE
5.4.1.Key market trends, growth factors, and opportunities
5.4.2.Market size and forecast, by region
5.4.3.Market analysis, by country
5.5.OTHERS
5.5.1.Key market trends, growth factors, and opportunities
5.5.2.Market size and forecast, by region
5.5.3.Market analysis, by country
CHAPTER 6:ELECTRIC POWER TOOLS MARKET, BY REGION
6.1.MARKET OVERVIEW
6.1.1.Market size and forecast, by region
6.2.NORTH AMERICA
6.2.1.Key market trends, growth factors, and opportunities
6.2.2.Market size and forecast, by product type
6.2.3.Market size and forecast, by end-user industry
6.2.4.Market size and forecast, by country
6.2.4.1.U.S.
6.2.4.1.1.U.S. market size and forecast, by product type
6.2.4.2.Canada
6.2.4.2.1.Canada market size and forecast, by product type
6.2.4.3.Mexico
6.2.4.3.1.Mexico market size and forecast, by product type
6.2.4.3.2.Mexico market size and forecast, by end-user industry
6.3.EUROPE
6.3.1.Key market trends, growth factors, and opportunities
6.3.2.Market size and forecast, by product type
6.3.3.Market size and forecast, by end-user industry
6.3.4.Market size and forecast, by country
6.3.4.1.Germany
6.3.4.1.1.Germany market size and forecast, by product type
6.3.4.1.2.Germany market size and forecast, by end-user industry
6.3.4.2.France
6.3.4.2.1.France market size and forecast, by product type
6.3.4.2.2.France market size and forecast, by end-user industry
6.3.4.3.The UK
6.3.4.3.1.The UK market size and forecast, by product type
6.3.4.3.2.The UK market size and forecast, by end-user industry
6.3.4.4.Italy
6.3.4.4.1.Italy market size and forecast, by product type
6.3.4.4.2.Italy market size and forecast, by end-user industry
6.3.4.5.Russia
6.3.4.5.1.Russia market size and forecast, by product type
6.3.4.5.2.Russia market size and forecast, by end-user industry
6.3.4.6.Rest of Europe
6.3.4.6.1.Rest of Europe market size and forecast, by product type
6.3.4.6.2.Rest of Europe market size and forecast, by end-user industry
6.4.ASIA-PACIFIC
6.4.1.Key market trends, growth factors, and opportunities
6.4.2.Asia-Pacific Market size and forecast, by product type
6.4.3.Asia-Pacific Market size and forecast, by end-user industry
6.4.4.Asia-Pacific Market size and forecast, by country
6.4.4.1.China
6.4.4.1.1.China market size and forecast, by product type
6.4.4.1.2.China market size and forecast, by end-user industry
6.4.4.2.India
6.4.4.2.1.India market size and forecast, by product type
6.4.4.2.2.India market size and forecast, by end-user industry
6.4.4.3.Japan
6.4.4.3.1.Japan market size and forecast, by product type
6.4.4.3.2.Japan market size and forecast, by end-user industry
6.4.4.4.Rest of Asia-Pacific
6.4.4.4.1.Rest of Asia-Pacific market size and forecast, by product type
6.4.4.4.2.Rest of Asia-Pacific market size and forecast, by end-user industry
6.5.LAMEA
6.5.1.Key market trends, growth factors, and opportunities
6.5.2.LAMEA Market size and forecast, by product type
6.5.3.LAMEA Market size and forecast, by end-user industry
6.5.4.LAMEA Market size and forecast, by country
6.5.4.1.Latin America
6.5.4.1.1.Latin America market size and forecast, by product type
6.5.4.1.2.Latin America market size and forecast, by end-user industry
6.5.4.2.Middle East
6.5.4.2.1.Middle East market size and forecast, by product type
6.5.4.2.2.Middle East market size and forecast, by end-user industry
6.5.4.3.Africa
6.5.4.3.1.Africa market size and forecast, by product type
6.5.4.3.2.Africa market size and forecast, by end-user industry
CHAPTER 7:COMPETITIVE LANDSCAPE
7.1.INTRODUCTION
7.1.1.Market player positioning, 2020
7.2.TOP WINNING STRATEGIES
7.2.1.Top winning strategies, by year
7.2.2.Top winning strategies, by development
7.2.3.Top winning strategies, by company
7.3.COMPETITIVE DASHBOARD
7.4.KEY DEVELOPMENTS
7.4.1.New product launches
7.4.2.Product developments
7.4.3.Business expansion
7.4.4.Merger
7.4.5.Partnership
CHAPTER 8:COMPANY PROFILES
8.1.APEX TOOL GROUP
8.1.1.Company overview
8.1.2.Key Executives
8.1.3.Company snapshot
8.1.4.Operating business segments
8.1.5.Product portfolio
8.1.6.Key strategic moves and developments
8.2.ATLAS COPCO AB
8.2.1.Company overview
8.2.2.Key executives
8.2.3.Company snapshot
8.2.4.Operating business segments
8.2.5.Product portfolio
8.2.6.Research and development expenses
8.2.7.Business performance
8.3.HILTI CORPORATION
8.3.1.Company overview
8.3.2.Key Executives
8.3.3.Company snapshot
8.3.4.Product portfolio
8.3.5.R&D Expenditure
8.3.6.Business performance
8.3.7.Key strategic moves and developments
8.4.INGERSOLL-RAND PLC
8.4.1.Company overview
8.4.2.Key executives
8.4.3.Company snapshot
8.4.4.Operating business segments
8.4.5.Product portfolio
8.4.6.Research and development expenses
8.4.7.Business performance
8.4.8.Key strategic moves and developments
8.5.KOKI HOLDINGS CO., LTD. (HIKOKI AND METABO)
8.5.1.Company overview
8.5.2.Key executives
8.5.3.Company snapshot
8.5.4.Product portfolio
8.5.5.Product portfolio
8.5.6.Business performance
8.5.7.Locations of electric power tools manufacturing for HiKOKI:
8.5.8.Locations of electric power tools manufacturing for Metabo:
8.5.9.Key strategic moves and developments
8.6.MAKITA CORPORATION
8.6.1.Company overview
8.6.2.Key Executives
8.6.3.Company snapshot
8.6.4.Product portfolio
8.6.5.R&D Expenditure
8.6.6.Business performance
8.6.7.Key strategic moves and developments
8.7.ROBERT BOSCH GMBH
8.7.1.Company overview
8.7.2.Key Executives
8.7.3.Company snapshot
8.7.4.Product portfolio
8.7.5.R&D Expenditure
8.7.6.Business performance
8.7.7.Key strategic moves and developments
8.7.8.Locations of electric power tools manufacturing for Bosch:
8.8.STANLEY BLACK & DECKER, INC.
8.8.1.Company overview
8.8.2.Key Executives
8.8.3.Company snapshot
8.8.4.Product portfolio
8.8.5.R&D Expenditure
8.8.6.Business performance
8.8.7.Key strategic moves and developments
8.8.8.Locations of electric power tools manufacturing for Stanley Black & Decker:
8.9.SNAP-ON INCORPORATED
8.9.1.Company overview
8.9.2.Key executives
8.9.3.Company snapshot
8.9.4.Operating business segments
8.9.5.Product portfolio
8.9.6.Research and development expenses
8.9.7.Business performance
8.9.8.Key strategic moves and developments
8.10.TECHTRONIC INDUSTRIES COMPANY LIMITED
8.10.1.Company overview
8.10.2.Key executives
8.10.3.Company snapshot
8.10.4.Product portfolio
8.10.5.R&D expenditure
8.10.6.Business performance
8.10.7.Key strategic moves and developments
8.10.8.Locations of electric power tools manufacturing for TTI:
Table 01.Company Position In Global Electric Power Tools Market In 2020
Table 02.Elecric Power Tools Market Revenue, By Product Type, 2020–2030 ($Million)
Table 03.Electric Power Tools Market Revenue For Corded Power Tools, By Region, 2020–2030 ($Million)
Table 04.Electric Power Tools Market Revenue For Cordless Power Tools, By Region, 2020–2030 ($Million)
Table 05.Electric Power Tools Market Revenue, By End-User Industry, 2020–2030 ($Million)
Table 06.Electric Power Tools Market Revenue For Construction, By Region, 2020–2030 ($Million)
Table 07.Electric Power Tools Market Revenue For Automotive, By Region, 2020–2030 ($Million)
Table 08.Electric Power Tools Market Revenue For Aerospace, By Region, 2020–2030 ($Million)
Table 09.Electric Power Tools Market Revenue For Others, By Region, 2020–2030 ($Million)
Table 10.Electric Power Tools Market, By Region, 2020–2030 ($Million)
Table 11.North America Electric Power Tools Market, By Product Type, 2020–2030 ($Million)
Table 12.North America Electric Power Tools Market, By End-User Industry, 2020–2030 ($Million)
Table 13.North America Electric Power Tools Market, By Country, 2020–2030 ($Million)
Table 14.U.S. Electric Power Tools Market, By Product Type, 2020–2030 ($Million)
Table 15.U.S. Electric Power Tools Market, By End-User Industry, 2020–2030 ($Million)
Table 16.Canada Electric Power Tools Market, By Product Type, 2020–2030 ($Million)
Table 17.Canada Electric Power Tools Market, By End-User Industry, 2020–2030 ($Million)
Table 18.Mexico Electric Power Tools Market, By Product Type, 2020–2030 ($Million)
Table 19.Mexico Electric Power Tools Market, By End-User Industry, 2020–2030 ($Million)
Table 20.Europe Electric Power Tools Market, By Product Type, 2020–2030 ($Million)
Table 21.Europe Electric Power Tools Market, By End-User Industry, 2020–2030 ($Million)
Table 22.Europe Electric Power Tools Market, By Country, 2020–2030 ($Million)
Table 23.Germany Electric Power Tools Market, By Product Type, 2020–2030 ($Million)
Table 24.Germany Electric Power Tools Market, By End-User Industry, 2020–2030 ($Million)
Table 25.France Electric Power Tools Market, By Product Type, 2020–2030 ($Million)
Table 26.France Electric Power Tools Market, By End-User Industry, 2020–2030 ($Million)
Table 27.The Uk Electric Power Tools Market, By Product Type, 2020–2030 ($Million)
Table 28.The Uk Electric Power Tools Market, By End-User Industry, 2020–2030 ($Million)
Table 29.Italy Electric Power Tools Market, By Product Type, 2020–2030 ($Million)
Table 30.Italy Electric Power Tools Market, By End-User Industry, 2020–2030 ($Million)
Table 31.Russia Electric Power Tools Market, By Product Type, 2020–2030 ($Million)
Table 32.Russia Electric Power Tools Market, By End-User Industry, 2020–2030 ($Million)
Table 33.Rest Of Europe Electric Power Tools Market, By Product Type, 2020–2030 ($Million)
Table 34.Rest Of Europe Electric Power Tools Market, By End-User Industry, 2020–2030 ($Million)
Table 35.Asia-Pacific Electric Power Tools Market, By Product Type, 2020–2030 ($Million)
Table 36.Asia-Pacific Electric Power Tools Market, By End-User Industry, 2020–2030 ($Million)
Table 37.Asia-Pacific Electric Power Tools Market, By Country, 2020–2030 ($Million)
Table 38.China Electric Power Tools Market, By Product Type, 2020–2030 ($Million)
Table 39.China Electric Power Tools Market, By End-User Industry, 2020–2030 ($Million)
Table 40.India Electric Power Tools Market, By Product Type, 2020–2030 ($Million)
Table 41.India Electric Power Tools Market, By End-User Industry, 2020–2030 ($Million)
Table 42.Japan Electric Power Tools Market, By Product Type, 2020–2030 ($Million)
Table 43.Japan Electric Power Tools Market, By End-User Industry, 2020–2030 ($Million)
Table 44.Rest Of Asia-Pacific Electric Power Tools Market, By Product Type, 2020–2030 ($Million)
Table 45.Rest Of Asia-Pacific Electric Power Tools Market, By End-User Industry, 2020–2030 ($Million)
Table 46.Lamea Electric Power Tools Market, By Product Type, 2020–2030 ($Million)
Table 47.Lamea Electric Power Tools Market, By End-User Industry, 2020–2030 ($Million)
Table 48.Lamea Electric Power Tools Market, By Country, 2020–2030 ($Million)
Table 49.Latin America Electric Power Tools Market, By Product Type, 2020–2030 ($Million)
Table 50.Latin America Electric Power Tools Market, By End-User Industry, 2020–2030 ($Million)
Table 51.Middle East Electric Power Tools Market, By Product Type, 2020–2030 ($Million)
Table 52.Middle East Electric Power Tools Market, By End-User Industry, 2020–2030 ($Million)
Table 53.Africa Electric Power Tools Market, By Product Type, 2020–2030 ($Million)
Table 54.Africa Electric Power Tools Market, By End-User Industry, 2020–2030 ($Million)
Table 55.Competitive Dashboard
Table 56.Key New Product Launches (2017-2020)
Table 57.Key Product Developments, (2019)
Table 58.Key Business Expansion, (2017–2020)
Table 59.Key Business Merger, (2017–2020)
Table 60.Key Business Partnerhip, (2017–2020)
Table 61.Apex: Key Executives
Table 62.Apex: Company Snapshot
Table 63.Apex Tool Group: Operating Segments
Table 64.Apex: Product Portfolio
Table 65.Key Executives: Atlas Copco Ab
Table 66.Atlas Copco Ab: Company Snapshot
Table 67.Atlas Copco Ab: Operating Segments
Table 68.Atlas Copco Ab: Product Portfolio
Table 69.Hilti: Key Executives
Table 70.Hilti: Company Snapshot
Table 71.Hilti: Product Portfolio
Table 72.Key Executives: Ingersoll-Rand Plc
Table 73.Ingersoll-Rand Plc: Company Snapshot
Table 74.Ingersoll-Rand Plc: Operating Segments
Table 75.Ingersoll-Rand Plc: Product Portfolio
Table 76.Koki: Key Executives
Table 77.Koki: Company Snapshot
Table 78.Hikoki: Product Portfolio
Table 79.Koki: Product Portfolio
Table 80.Hikoki: Manufacturing Locations
Table 81.Hikoki: Product Offerings
Table 82.Metabo: Manufacturing Locations
Table 83.Metabo: Product Offerings
Table 84.Makita: Key Executives
Table 85.Makita: Company Snapshot
Table 86.Makita: Product Portfolio
Table 87.Bosch: Key Executives
Table 88.Bosch: Company Snapshot
Table 89.Bosch: Product Portfolio
Table 90.Bosch: Manufacturing Locations
Table 91.Bosch: Product Offerings
Table 92.Stanley Black & Decker: Key Executives
Table 93.Stanley Black & Decker: Company Snapshot
Table 94.Stanley Black & Decker: Product Portfolio
Table 95.Stanley Black & Decker: Manufacturing Locations
Table 96.Stanley Black & Decker: Product Offerings
Table 97.Key Executives: Snap-On Incorporated
Table 98.Snap-On Incorporated: Company Snapshot
Table 99.Snap-On Incorporated: Operating Segments
Table 100.Snap-On Incorporated: Product Portfolio
Table 101.Tti: Key Executives
Table 102.Tti: Company Snapshot
Table 103.Tti: Product Portfolio
Table 104.Tti: Manufacturing Locations
Table 105.Tti: Product Offerings
List Of Figures
Figure 01.Key Market Segments
Figure 02.Global Electric Power Tools Market, 2020–2030
Figure 03.Global Electric Power Tools Market, By Country, 2020–2030
Figure 04.Top Investment Pockets
Figure 05.Low-To-Moderate Bargaining Power Of Suppliers
Figure 06.Low-To-Moderate Threat Of New Entrants
Figure 07.Moderate-To-High Threat Of Substitutes
Figure 08.Low-To-High Bargaining Power Of Buyers
Figure 09.Moderate-To-High Intensity Of Rivalry
Figure 10.Global Electric Power Tools Market Share, 2020
Figure 11.Market Dynamics
Figure 12.Global Electric Power Tools Market, By Product Type, 2020–2030
Figure 13.Comparative Share Analysis Of Corded Power Tools Market, By Country, 2020 & 2030 (%)
Figure 14.Comparative Share Analysis Of Cordless Power Tools Market, By Country, 2020 & 2030 (%)
Figure 15.Global Electric Power Tools Market, By End-User Industry, 2020–2030
Figure 16.Comparative Share Analysis Of Construction Market, By Country, 2020 & 2030 (%)
Figure 17.Comparative Share Analysis Of Automotive Market, By Country, 2020 & 2030 (%)
Figure 18.Comparative Share Analysis Of Aerospace Market, By Country, 2020 & 2030 (%)
Figure 19.Comparative Share Analysis Of Others Market, By Country, 2020 & 2030 (%)
Figure 20.Electric Power Tools Market, By Region, 2020–2030
Figure 21.U.S. Electric Power Tools Market Revenue, 2020 & 2030 ($Million)
Figure 22.Canada Electric Power Tools Market Revenue, 2020 & 2030 ($Million)
Figure 23.Mexico Electric Power Tools Market Revenue, 2020 & 2030 ($Million)
Figure 24.Germany Electric Power Tools Market Revenue, 2020 & 2030 ($Million)
Figure 25.France Electric Power Tools Market Revenue, 2020 & 2030 ($Million)
Figure 26.The Uk Electric Power Tools Market Revenue, 2020 & 2030 ($Million)
Figure 27.Italy Electric Power Tools Market Revenue, 2020 & 2030 ($Million)
Figure 28.Russia Electric Power Tools Market Revenue, 2020 & 2030 ($Million)
Figure 29.Rest Of Europe Electric Power Tools Market Revenue, 2020 & 2030 ($Million)
Figure 30.China Electric Power Tools Market Revenue, 2020 & 2030 ($Million)
Figure 31.India Electric Power Tools Market Revenue, 2020 & 2030 ($Million)
Figure 32.Japan Electric Power Tools Market Revenue, 2020 & 2030 ($Million)
Figure 33.Rest Of Asia-Pacific Electric Power Tools Market Revenue, 2020 & 2030 ($Million)
Figure 34.Latin America Electric Power Tools Market Revenue, 2015 To 2027 ($Million)
Figure 35.Middle East Electric Power Tools Market Revenue, 2020 & 2030 ($Million)
Figure 36.Africa Electric Power Tools Market Revenue, 2020 & 2030 ($Million)
Figure 37.Market Player Positioning, 2020
Figure 38.Top Winning Strategies, By Year, 2017–2020
Figure 39.Top Winning Strategies, By Development, 2017–2020 (%)
Figure 40.Top Winning Strategies, By Company, 2017–2020
Figure 41.Atlas Copco Ab: Research And Development Expenses, 2018–2020 ($Million)
Figure 42.Atlas Copco Ab: Revenue, 2018–2020($Million)
Figure 43.Atlas Cocpo Ab: Revenue Share By Segment, 2020 (%)
Figure 44.Atlas Cocpo Ab: Revenue Share By Region, 2020 (%)
Figure 45.Hilti: R&D Expenditure, 2018–2020 ($Million)
Figure 46.Hilti: Revenue, 2018–2020 ($Million)
Figure 47.Hilti: Revenue Share For Electric Power Tools, 2020 (%)
Figure 48.Hilti: Revenue Share By Region, 2020 (%)
Figure 49.Ingersoll-Rand Plc: Research And Development Expenses, 2018–2020($Million)
Figure 50.Ingersoll-Rand Plc: Revenue, 2018–2020($Million)
Figure 51.Ingersoll Rand Plc: Revenue Share By Segment, 2020 (%)
Figure 52.Ingersoll Rand Plc: Revenue Share By Region, 2020 (%)
Figure 53.Koki: Revenue, 2016–2018 ($Million)
Figure 54.Koki: Revenue Share For Electric Power Tools, 2018 (%)
Figure 55.Makita: R&D Expenditure, 2018–2020 ($Million)
Figure 56.Makita: Revenue, 2018–2020 ($Million)
Figure 57.Makita: Revenue Share For Electric Power Tools, 2020 (%)
Figure 58.Makita: Revenue Share By Region, 2020 (%)
Figure 59.Bosch: R&D Expenditure, 2018–2020 ($Million)
Figure 60.Bosch: Revenue, 2018–2020 ($Million)
Figure 61.Bosch: Revenue Share By Segment, 2020 (%)
Figure 62.Bosch: Revenue Share By Region, 2020 (%)
Figure 63.Stanley Black & Decker: R&D Expenditure, 2018–2020 ($Million)
Figure 64.Stanley Black & Decker: Revenue, 2018–2020 ($Million)
Figure 65.Stanley Black & Decker: Revenue Share By Segment, 2020 (%)
Figure 66.Stanley Black & Decker: Revenue Share By Region, 2020 (%)
Figure 67.Snap-On Incorporated: Research And Development Expenses, 2018–2020($Million)
Figure 68.Snap-On Incorporated: Revenue, 2018–2020($Million)
Figure 69.Snap-On Incorporated: Revenue Share By Segment, 2020 (%)
Figure 70.Snap-On Incoporated: Revenue Share By Region, 2020 (%)
Figure 71.Tti: R&D Expenditure, 2018–2020 ($Million)
Figure 72.Tti: Revenue, 2018–2020 ($Million)
Figure 73.Tti: Revenue Share For Electric Power Tools, 2020 (%)
Figure 74.Tti: Revenue Share By Region, 2020 (%)
$6399
$11050
HAVE A QUERY?
OUR CUSTOMER
