
The global tractor market size was $64,800 million in 2020 and is expected to reach $97,906.1 million by 2030, registering a CAGR of 4.0% from 2021 to 2030. A rise in government spending on new infrastructural and construction buildings, which in turn, increases the demand for tractors for transportation applications, drive the growth of the global tractor market. For instance, the Australia government has increased spending on infrastructure activities. The spending was increased by 10.3% from 2018 to 2020. In addition, construction tractor offers operational efficiency, and advancement in tractor technology. This drives the growth of the global tractor market.
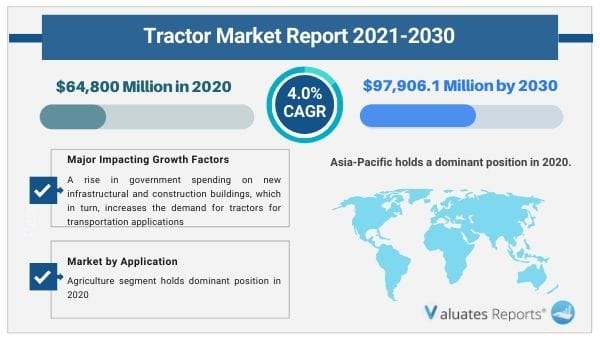
The COVID-19 outbreak had a mixed effect on the growth of the global tractor industry owing to rise in demand for agricultural produces such as cereals, vegetables, and fruits in addition to lockdown measure in different countries and delay in production
A tractor is a vehicle usually available with one or two small wheels in front and two large wheels at the back. It is used in agriculture, construction, and logistics applications to move attached implements such as rotavators, plowing, tilling, sowing, cultivation, and harvesting. Tractors are available in 2 wheel type and 4 wheel type. It is also available in power output of 20 HP to more than 20 Hp.
An increase in mechanization in agricultural equipment such as tractor in countries such as India, Brazil, China, and others, drive the global tractor market growth. Rise in demand for high efficient tractors for various applications such as planting, sowing, and others, drive the growth of the market. Major players such as Mahindra & Mahindra Ltd, and Escorts Limited are engaged in offering tractors with power output range of 50-100 HP. For instance, Mahindra & Mahindra Ltd offers Mahindra NOVO tractor. It has power output of 64.1 HP. It has powerful engine which is best suitable for heavy & sticky soil condition. It has efficient cooling system. It is used for harrow, and mulcher applications.
A rise in demand for high performance tractor for muddy, and heavy soil condition, drive the growth of the global tractor market. For instance, major players such as John Deere India Private Limited, Mahindra & Mahindra Ltd, and VST Tillers and Tractors Ltd are engaged in offering tractors with power output with more than 100 HP. For instance, Deere & Company, offers John Deere 6120 B tractor for agriculture, and mulching applications. It has more reliability, with lower service costs. It is used in agricultural activities such as tilting, sowing, hauling, and puddling. It has power output of 120 HP with 4 cylinders and turbo charged John Deere Power Tech engine.
However, lack of information about efficient tractor among farmers in India, is anticipated to restraint the market growth. Furthermore, a government initiative for assisting and providing subsidy to farmers with low interest rates, is anticipated to provide lucrative opportunities for the growth of the global tractor market. For instance, many government initiatives such as PM Kisan Tractor Yojana, and Telangana Yantra Laxmi Scheme in India are providing 20% to 50% subsidy on tractors to farmers.
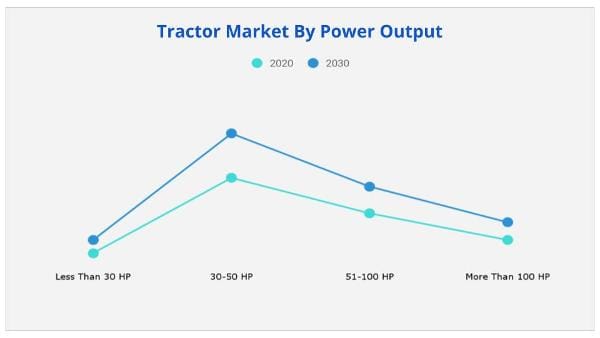
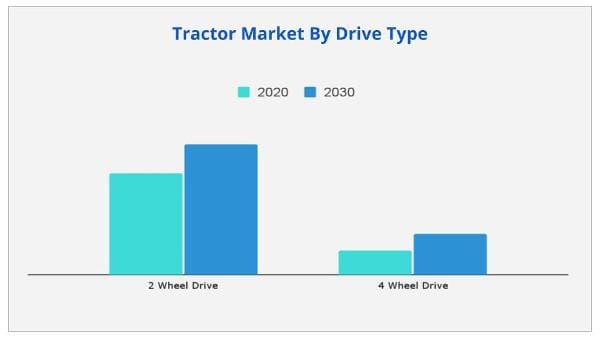
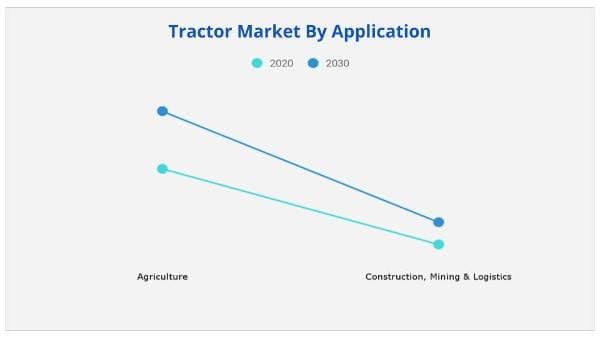
The tractor market is segmented into power output, drive type, application, and region. By power output, the market is categorized into less than 30 HP, 30-50 HP, 50-100 HP, and more than 100 HP. The 30-50 HP segment dominated the market in 2020. By drive type, the market is bifurcated into 2 wheel drive and 4 wheel drive. The 2 wheel drive segment dominated the market in 2020. On the basis of application, it is classified into agriculture, construction, and mining & logistics. The agriculture segment dominated the market in 2020.
Key players profiled in this report include The Mahindra & Mahindra Ltd, Escorts Limited, CNH Industrial N.V., Tractors and Farm Equipment Ltd, Sonalika International Tractors Limited, Deere & Company, HMT Limited, Force Motors Limited, Kubota Corporation, and V.S.T. Tillers Tractors Ltd.
Major players such as Mahindra & Mahindra, Tractor, Kubota Corporation, and Farm Equipment Limited, and HMT limited, are adopting agreement, and product launch as a key developmental strategies to improve the product portfolio of tractor products. For instance, in July 2019, Kubota announced its plan to launch a new series of high-horse power tractors in North America. It entered into a strategic partnership with the OEM Buhler Industries Inc. for the development and production of these tractors to accelerate its business in the North America market.
|
Report Metric |
Details |
|
Report Name |
Tractor Market |
|
The market size in 2020 |
USD 64,800 Million |
|
The revenue forecast in 2030 |
USD 97,906.1 Million |
|
Growth Rate |
Compound Annual Growth Rate (CAGR) of 4.0% from 2021 to 2030 |
|
Market size available for years |
2021-2030 |
|
Forecast units |
Value (USD) |
|
Segments covered |
by Power Output, Drive Type, and Application, and Region |
|
Report coverage |
Revenue & volume forecast, company share, competitive landscape, growth factors, and trends |
|
Geographic regions covered |
North America, Europe, Asia Pacific, Latin America, Middle East & Africa |
Ans. The global tractor market size was $64,800 million in 2020 and is expected to reach $97,906.1 million by 2030, registering a Compound Annual Growth Rate (CAGR) of 4.0% from 2021 to 2030.
Ans. Rising labor costs, rising consumption of plant-based foods, government incentives, seasonal labor shortages, and other reasons are driving the global tractor market.
Ans. Yes, the report includes a COVID-19 impact analysis. Also, it is further extended into every individual segment of the report.
Ans. Asia-Pacific holds a dominant position in 2020.
Ans. Key players operating in the global tractor market include The Mahindra & Mahindra Ltd, Escorts Limited, CNH Industrial N.V., Tractors and Farm Equipment Ltd, Sonalika International Tractors Limited, Deere & Company, HMT Limited, Force Motors Limited, Kubota Corporation, and V.S.T. Tillers Tractors Ltd.
Ans. By Application, Agriculture segment holds dominant position in 2020
CHAPTER 1:INTRODUCTION
1.1.REPORT DESCRIPTION
1.2.KEY BENEFITS FOR STAKEHOLDERS
1.3.KEY MARKET SEGMENTS
1.4.KEY MARKET PLAYERS
1.5.RESEARCH METHODOLOGY
1.5.1.Secondary research
1.5.2.Primary research
1.5.3.Analyst tools & models
CHAPTER 2:EXECUTIVE SUMMARY
2.1.KEY FINDINGS OF THE STUDY
2.2.CXO PERSPECTIVE
CHAPTER 3:MARKET OVERVIEW
3.1.MARKET DEFINITION AND SCOP
3.2.KEY FINDINGS
3.2.1.Top investment pockets
3.2.2.Top winning strategies
3.3.MARKET PLAYER POSITIONING, 2020
3.4.PORTER'S FIVE FORCES ANALYSIS
3.5.MARKET DYNAMICS
3.5.1.Drivers
3.5.1.1.Mechanization In Activities of Agriculture
3.5.1.2.Advancements In Tractor Technology
3.5.1.3.Surge in population
3.5.1.4.Increase in adoption of precision farming
3.5.2.Restraints
3.5.2.1.Lack of information about efficient agriculture tractor among farmers
3.5.2.2.High cost of Agricultural Tractors
3.5.2.3.High Raw Material Prices
3.5.3.Opportunity
3.5.3.1.Government support for the development of agricultural activities
3.6.COVID-19 IMPACT ANALYSIS
CHAPTER 4:GLOBAL TRACTOR MARKET, BY POWER OUTPUT
4.1.OVERVIEW
4.1.1.Market size and forecast, by power output
4.2.LESS THAN 30 HP
4.2.1.Key market trends, growth factors, and opportunities
4.2.2.Market size and forecast, by region
4.2.3.Market analysis, by country
4.3.30-50 HP
4.3.1.Key market trends, growth factors, and opportunities
4.3.2.Market size and forecast, by region
4.3.3.Market analysis, by country
4.4.51-100 HP
4.4.1.Key market trends, growth factors, and opportunities
4.4.2.Market size and forecast, by region
4.4.3.Market analysis, by country
4.5.MORE THAN 100 HP
4.5.1.Key market trends, growth factors, and opportunities
4.5.2.Market size and forecast, by region
4.5.3.Market analysis, by country
CHAPTER 5:GLOBAL TRACTOR MARKET, BY DRIVE TYPE
5.1.OVERVIEW
5.1.1.Market size and forecast, by drive type
5.2.2 WHEEL DRIVE
5.2.1.Key market trends, growth factors, and opportunities
5.2.2.Market size and forecast, by region
5.2.3.Market analysis, by country
5.3.4 WHEEL DRIVE
5.3.1.Key market trends, growth factors, and opportunities
5.3.2.Market size and forecast, by region
5.3.3.Market analysis, by country
CHAPTER 6:GLOBAL TRACTOR MARKET, BY APPLICATION
6.1.OVERVIEW
6.1.1.Market size and forecast, by application
6.2.AGRICULTURE
6.2.1.Key market trends, growth factors, and opportunities
6.2.2.Market size and forecast, by power output
6.2.3.Market size and forecast, by drive type
6.2.4.Market size and forecast, by region
6.2.5.Market analysis, by country
6.3.CONSTRUCTION, MINING AND LOGISTICS
6.3.1.Key market trends, growth factors, and opportunities
6.3.2.Market size and forecast, by power output
6.3.3.Market size and forecast, by drive type
6.3.4.Market size and forecast, by region
6.3.5.Market analysis, by country
CHAPTER 7:TRACTOR MARKET, BY REGION
7.1.OVERVIEW
7.1.1.Market size and forecast, by region
7.2.NORTH AMERICA
7.2.1.Key market trends and opportunities
7.2.2.Market size and forecast, by power output
7.2.3.Market size and forecast, by drive type
7.2.4.Market size and forecast, by application
7.2.4.1.North America market size and forecast, by power output
7.2.4.2.North America market size and forecast, by drive type
7.2.5.Market analysis by country
7.2.5.1.U.S.
7.2.5.1.1.U.S. market size and forecast, by power output
7.2.5.1.2.U.S. Market size and forecast, by drive type
7.2.5.1.3.U.S. Market size and forecast, by application
7.2.5.2.Canada
7.2.5.2.1.Canada market size and forecast, by power output
7.2.5.2.2.Canada Market size and forecast, by drive type
7.2.5.2.3.Canada Market size and forecast, by application
7.2.5.3.Mexico
7.2.5.3.1.Mexico market size and forecast, by power output
7.2.5.3.2.Mexico Market size and forecast, by drive type
7.2.5.3.3.Mexico Market size and forecast, by application
7.3.EUROPE
7.3.1.Key market trends, growth factors, and opportunities
7.3.2.Market size and forecast, by power output
7.3.3.Market size and forecast, by drive type
7.3.4.Market size and forecast, by application
7.3.4.1.Europe market size and forecast, by power output
7.3.4.2.Europe market size and forecast, by drive type
7.3.5.Market analysis by country
7.3.5.1.Germany
7.3.5.1.1.Germany market size and forecast, by power output
7.3.5.1.2.Germany Market size and forecast, by drive type
7.3.5.1.3.Germany Market size and forecast, by application
7.3.5.2.France
7.3.5.2.1.France market size and forecast, by power output
7.3.5.2.2.France Market size and forecast, by drive type
7.3.5.2.3.France Market size and forecast, by application
7.3.5.3.UK
7.3.5.3.1.UK market size and forecast, by power output
7.3.5.3.2.UK Market size and forecast, by drive type
7.3.5.3.3.UK Market size and forecast, by application
7.3.5.4.Italy
7.3.5.4.1.Italy market size and forecast, by power output
7.3.5.4.2.Italy Market size and forecast, by drive type
7.3.5.4.3.Italy Market size and forecast, by application
7.3.5.5.Rest of Europe
7.3.5.5.1.Rest of Europe market size and forecast, by power output
7.3.5.5.2.Rest of Europe Market size and forecast, by drive type
7.3.5.5.3.Rest of Europe Market size and forecast, by application
7.4.ASIA-PACIFIC
7.4.1.Key market trends, growth factors, and opportunities
7.4.2.Market size and forecast, by power output
7.4.3.Market size and forecast, by drive type
7.4.4.Market size and forecast, by application
7.4.4.1.Asia-Pacific market size and forecast, by power output
7.4.4.2.Asia-Pacific market size and forecast, by drive type
7.4.5.Market analysis by country
7.4.5.1.China
7.4.5.1.1.China market size and forecast, by power output
7.4.5.1.2.China Market size and forecast, by drive type
7.4.5.1.3.China Market size and forecast, by application
7.4.5.2.India
7.4.5.2.1.India market size and forecast, by power output
7.4.5.2.2.India Market size and forecast, by drive type
7.4.5.2.3.India Market size and forecast, by application
7.4.5.3.Japan
7.4.5.3.1.Japan market size and forecast, by power output
7.4.5.3.2.Japan Market size and forecast, by drive type
7.4.5.3.3.Japan Market size and forecast, by application
7.4.5.4.Rest of Asia-Pacific
7.4.5.4.1.Rest of Asia-Pacific market size and forecast, by power output
7.4.5.4.2.Rest of Asia-Pacific Market size and forecast, by drive type
7.4.5.4.3.Rest of Asia-Pacific Market size and forecast, by application
7.5.LAMEA
7.5.1.Key market trends, growth factors, and opportunities
7.5.2.Market size and forecast, by power output
7.5.3.Market size and forecast, by drive type
7.5.4.Market size and forecast, by application
7.5.4.1.LAMEA market size and forecast, by power output
7.5.4.2.LAMEA market size and forecast, by drive type
7.5.5.Market analysis by country
7.5.5.1.Latin America
7.5.5.1.1.Latin America market size and forecast, by power output
7.5.5.1.2.Latin America Market size and forecast, by drive type
7.5.5.1.3.Latin America Market size and forecast, by application
7.5.5.2.Middle East
7.5.5.2.1.Middle East market size and forecast, by power output
7.5.5.2.2.Middle East Market size and forecast, by drive type
7.5.5.2.3.Middle East Market size and forecast, by application
7.5.5.3.Africa
7.5.5.3.1.Africa market size and forecast, by power output
7.5.5.3.2.Africa Market size and forecast, by drive type
7.5.5.3.3.Africa Market size and forecast, by application
CHAPTER 8:COMPANY PROFILE
8.1.MAHINDRA & MAHINDRA LTD.
8.1.1.Company overview
8.1.2.Key executives
8.1.3.Company snapshot
8.1.4.Operating business segments
8.1.5.Product portfolio
8.1.6.R & D expenditure
8.1.7.Business performance
8.1.8.Key strategic moves and developments
8.2.TRACTORS AND FARM EQUIPMENT LIMITED
8.2.1.Company overview
8.2.2.Key executive
8.2.3.Company snapshot
8.2.4.Product portfolio
8.2.5.Key strategic moves and developments
8.3.SONALIKA INTERNATIONAL TRACTORS LTD
8.3.1.Company overview
8.3.2.Key executive
8.3.3.Company snapshot
8.3.4.Product portfolio
8.3.5.Key strategic moves and developments
8.4.ESCORTS LIMITED
8.4.1.Company overview
8.4.2.Key executive
8.4.3.Company snapshot
8.4.4.Operating business segments
8.4.5.Product portfolio
8.4.6.R & D expenditure
8.4.7.Business performance
8.4.8.Key strategic moves and developments
8.5.HMT LIMITED
8.5.1.Company overview
8.5.2.Key executive
8.5.3.Company snapshot
8.5.4.Operating business segments
8.5.5.Product portfolio
8.5.6.Business performance
8.6.DEERE & COMPANY
8.6.1.Company overview
8.6.2.Key Executives
8.6.3.Company snapshot
8.6.4.Operating business segments
8.6.5.Product portfolio
8.6.6.R & D expenditure
8.6.7.Business performance
8.7.CNH INDUSTRIAL N.V.
8.7.1.Company overview
8.7.2.Key executive
8.7.3.Company snapshot
8.7.4.Operating business segments
8.7.5.Product portfolio
8.7.6.R & D expenditure
8.7.7.Business performance
8.7.8.Key strategic moves and developments
8.8.FORCE MOTORS LIMITED
8.8.1.Company overview
8.8.2.Key executives
8.8.3.Company snapshot
8.8.4.Product portfolio
8.8.5.R & D expenditure
8.8.6.Business performance
8.9.KUBOTA CORPORATION
8.9.1.Company overview
8.9.2.Key executive
8.9.3.Company snapshot
8.9.4.Operating business segments
8.9.5.Product portfolio
8.9.6.R&D expenditure
8.9.7.Business performance
8.9.8.Key strategic moves and developments
8.10.V.S.T. TILLERS TRACTORS LTD.
8.10.1.Company overview
8.10.2.Key executive
8.10.3.Company snapshot
8.10.4.Operating segments
8.10.5.Product portfolio
8.10.6.R & D expenditure
8.10.7.Business performance
Table 01.global tractor market REVENUE, power output, 2020–2030 ($million)
Table 02.global tractor market REVENUE, power output, 2020–2030 (units)
Table 03.tractor market revenue for less than 30 hp, by region, 2020–2030 ($million)
Table 04.tractor market revenue for less than 30 hp, by region, 2020–2030 (units)
Table 05.tractor Market revenue for 30-50 hp, by region 2020–2030 ($million)
Table 06.tractor Market revenue for 30-50 hp, by region 2020–2030 (units)
Table 07.tractor Market revenue for 51-100 hp, by region 2020–2030 ($million)
Table 08.tractor Market revenue for 51-100 hp, by region 2020–2030 (units)
Table 09.tractor Market revenue for more than 100 hp, by region 2020–2030 ($million)
Table 10.tractor Market revenue for more than 100 hp, by region 2020–2030 (units)
Table 11.tractor MARKET REVENUE, drive type, 2020–2030 ($million)
Table 12.tractor MARKET REVENUE, drive type, 2020–2030 (units)
Table 13.tractor Market revenue for 2 wheel drive, by region, 2020–2030 ($million)
Table 14.tractor Market revenue for 2 wheel drive, by region, 2020–2030 (units)
Table 15.tractor market revenue for 4 wheel drive, by region 2020–2030 ($million)
Table 16.tractor market revenue for 4 wheel drive, by region 2020–2030 (units)
Table 17.tractor market REVENUE, by application, 2020–2030 ($million)
Table 18.tractor market REVENUE, by application, 2020–2030 (units)
Table 19.tractor market revenue for agriculture, by power output, 2020–2030 ($million)
Table 20.tractor market revenue for agriculture, by drive type, 2020–2030 ($million)
Table 21.tractor market revenue for agriculture, by region, 2020–2030 ($million)
Table 22.tractor market revenue for construction, mining & logistics, by power output, 2020–2030 ($million)
Table 23.tractor market revenue for construction, mining & logistics, by drive type, 2020–2030 ($million)
Table 24.tractor market revenue for construction, mining and logistics, by region 2020–2030 ($million)
Table 25.tractor market REVENUE, by REGION, 2020–2030, ($million)
Table 26.tractor market REVENUE, by REGION, 2020–2030, (units)
Table 27.North America tractor market revenue, by power output, 2020–2030 ($MILLION)
Table 28.North America tractor market revenue, by power output, 2020–2030 (units)
Table 29.North America tractor market revenue, by drive type, 2020–2030 ($MILLION)
Table 30.North America tractor market revenue, by drive type, 2020–2030 (units)
Table 31.North America tractor MARKET revenue, by application, 2020–2030 ($MILLION)
Table 32.North America tractor MARKET revenue, by application, 2020–2030 (units)
Table 33.north america tractor market revenue for agriculture, by power output, 2020–2030 ($million)
Table 34.north america tractor market revenue for construction, mining & logistics, by power output, 2020–2030 ($million)
Table 35.north america tractor market revenue for agriculture, by drive type, 2020–2030 ($million)
Table 36.north america tractor market revenue for construction, mining & logistics, by drive type, 2020–2030 ($million)
Table 37.North America tractor MARKET revenue, by country, 2020–2030 ($MILLION)
Table 38.North America tractor MARKET revenue, by country, 2020–2030 (units)
Table 39.U.S. tractor MARKET revenue, by power output, 2020–2030 ($MILLION)
Table 40.U.S. tractor MARKET revenue, by power output, 2020–2030 (units)
Table 41.U.S. tractor MARKET revenue, by drive type, 2020–2030 ($MILLION)
Table 42.U.S. tractor MARKET revenue, by drive type, 2020–2030 (units)
Table 43.U.S. tractor MARKET revenue, by application, 2020–2030 ($MILLION)
Table 44.U.S. tractor MARKET revenue, by application, 2020–2030 (units)
Table 45.canada tractor MARKET revenue, by power output, 2020–2030 ($MILLION)
Table 46.canada tractor MARKET revenue, by power output, 2020–2030 (units)
Table 47.Canada tractor MARKET revenue, by drive type, 2020–2030 ($MILLION)
Table 48.Canada tractor MARKET revenue, by drive type, 2020–2030 (units)
Table 49.canada tractor MARKET revenue, by application, 2020–2030 ($MILLION)
Table 50.canada tractor MARKET revenue, by application, 2020–2030 (units)
Table 51.mexico tractor MARKET revenue, by power output, 2020–2030 ($MILLION)
Table 52.mexico tractor MARKET revenue, by power output, 2020–2030 (units)
Table 53.mexico tractor MARKET revenue, by drive type, 2020–2030 ($MILLION)
Table 54.mexico tractor MARKET revenue, by drive type, 2020–2030 (units)
Table 55.mexico tractor MARKET revenue, by application, 2020–2030 ($MILLION)
Table 56.mexico tractor MARKET revenue, by application, 2020–2030 (units)
Table 57.europe tractor market revenue, by power output, 2020–2030 ($MILLION)
Table 58.europe tractor market revenue, by power output, 2020–2030 (units)
Table 59.europe tractor market revenue, by drive type, 2020–2030 ($MILLION)
Table 60.europe tractor market revenue, by drive type, 2020–2030 (units)
Table 61.europe tractor MARKET revenue, by application, 2020–2030 ($MILLION)
Table 62.europe tractor MARKET revenue, by application, 2020–2030 (units)
Table 63.europe tractor market revenue for agriculture, by power output, 2020–2030 ($million)
Table 64.europe tractor market revenue for construction, mining & logistics, by power output, 2020–2030 ($million)
Table 65.europe tractor market revenue for agriculture, by drive type, 2020–2030 ($million)
Table 66.europe tractor market revenue for construction, mining & logistics, by drive type, 2020–2030 ($million)
Table 67.europe tractor MARKET revenue, by country, 2020–2030 ($MILLION)
Table 68.germany tractor MARKET revenue, by power output, 2020–2030 ($MILLION)
Table 69.germany tractor MARKET revenue, by power output, 2020–2030 (units)
Table 70.germany tractor MARKET revenue, by drive type, 2020–2030 ($MILLION)
Table 71.germany tractor MARKET revenue, by drive type, 2020–2030 (units)
Table 72.germany tractor MARKET revenue, by application, 2020–2030 ($MILLION)
Table 73.germany tractor MARKET revenue, by application, 2020–2030 (units)
Table 74.france tractor MARKET revenue, by power output, 2020–2030 ($MILLION)
Table 75.france tractor MARKET revenue, by power output, 2020–2030 (units)
Table 76.france tractor MARKET revenue, by drive type, 2020–2030 ($MILLION)
Table 77.france tractor MARKET revenue, by drive type, 2020–2030 (units)
Table 78.france tractor MARKET revenue, by application, 2020–2030 ($MILLION)
Table 79.france tractor MARKET revenue, by application, 2020–2030 (units)
Table 80.uk tractor MARKET revenue, by power output, 2020–2030 ($MILLION)
Table 81.uk tractor MARKET revenue, by power output, 2020–2030 (units)
Table 82.uk tractor MARKET revenue, by drive type, 2020–2030 ($MILLION)
Table 83.uk tractor MARKET revenue, by drive type, 2020–2030 (units)
Table 84.uk tractor MARKET revenue, by application, 2020–2030 ($MILLION)
Table 85.uk tractor MARKET revenue, by application, 2020–2030 (units)
Table 86.italy tractor MARKET revenue, by power output, 2020–2030 ($MILLION)
Table 87.italy tractor MARKET revenue, by power output, 2020–2030 (units)
Table 88.italy tractor MARKET revenue, by drive type, 2020–2030 ($MILLION)
Table 89.italy tractor MARKET revenue, by drive type, 2020–2030 (units)
Table 90.italy tractor MARKET revenue, by application, 2020–2030 ($MILLION)
Table 91.italy tractor MARKET revenue, by application, 2020–2030 (units)
Table 92.rest of europe tractor MARKET revenue, by power output, 2020–2030 ($MILLION)
Table 93.rest of europe tractor MARKET revenue, by power output, 2020–2030 (units)
Table 94.rest of europe tractor MARKET revenue, by drive type, 2020–2030 ($MILLION)
Table 95.rest of europe tractor MARKET revenue, by drive type, 2020–2030 (units)
Table 96.rest of europe tractor MARKET revenue, by application, 2020–2030 ($MILLION)
Table 97.rest of europe tractor MARKET revenue, by application, 2020–2030 (units)
Table 98.asia-pacific tractor market revenue, by power output, 2020–2030 ($MILLION)
Table 99.asia-pacific tractor market revenue, by power output, 2020–2030 (units)
Table 100.asia-pacific tractor market revenue, by drive type, 2020–2030 ($MILLION)
Table 101.asia-pacific tractor market revenue, by drive type, 2020–2030 (units)
Table 102.asia-pacific tractor MARKET revenue, by application, 2020–2030 ($MILLION)
Table 103.asia-pacific tractor MARKET revenue, by application, 2020–2030 (units)
Table 104.asia-pacific tractor market revenue for agriculture, by power output, 2020–2030 ($million)
Table 105.asia-pacific tractor market revenue for construction, mining & logistics, by power output, 2020–2030 ($million)
Table 106.asia-pacific tractor market revenue for agriculture, by drive type, 2020–2030 ($million)
Table 107.asia-pacific tractor market revenue for construction, mining & logistics, by drive type, 2020–2030 ($million)
Table 108.asia-pacific tractor MARKET revenue, by country, 2020–2030 ($MILLION)
Table 109.asia-pacific tractor MARKET revenue, by country, 2020–2030 (units)
Table 110.china tractor MARKET revenue, by power output, 2020–2030 ($MILLION)
Table 111.china tractor MARKET revenue, by power output, 2020–2030 (units)
Table 112.china tractor MARKET revenue, by drive type, 2020–2030 ($MILLION)
Table 113.china tractor MARKET revenue, by drive type, 2020–2030 (units)
Table 114.china tractor MARKET revenue, by application, 2020–2030 ($MILLION)
Table 115.china tractor MARKET revenue, by application, 2020–2030 (units)
Table 116.india tractor MARKET revenue, by power output, 2020–2030 ($MILLION)
Table 117.india tractor MARKET revenue, by power output, 2020–2030 (units)
Table 118.india tractor MARKET revenue, by drive type, 2020–2030 ($MILLION)
Table 119.india tractor MARKET revenue, by application, 2020–2030 ($MILLION)
Table 120.india tractor MARKET revenue, by application, 2020–2030 (units)
Table 121.japan tractor MARKET revenue, by power output, 2020–2030 ($MILLION)
Table 122.japan tractor MARKET revenue, by power output, 2020–2030 (units)
Table 123.japan tractor MARKET revenue, by drive type, 2020–2030 ($MILLION)
Table 124.japan tractor MARKET revenue, by drive type, 2020–2030 (units)
Table 125.japan tractor MARKET revenue, by application, 2020–2030 ($MILLION)
Table 126.japan tractor MARKET revenue, by application, 2020–2030 (units)
Table 127.rest of asia-pacific tractor MARKET revenue, by power output, 2020–2030 ($MILLION)
Table 128.rest of asia-pacific tractor MARKET revenue, by power output, 2020–2030 (units)
Table 129.rest of asia-pacific tractor MARKET revenue, by drive type, 2020–2030 ($MILLION)
Table 130.rest of asia-pacific tractor MARKET revenue, by drive type, 2020–2030 (units)
Table 131.rest of asia-pacific tractor MARKET revenue, by application, 2020–2030 ($MILLION)
Table 132.rest of asia-pacific tractor MARKET revenue, by application, 2020–2030 (units)
Table 133.lamea tractor market revenue, by power output, 2020–2030 ($MILLION)
Table 134.lamea tractor market revenue, by power output, 2020–2030 (units)
Table 135.lamea tractor market revenue, by drive type, 2020–2030 ($MILLION)
Table 136.lamea tractor market revenue, by drive type, 2020–2030 (units)
Table 137.lamea tractor MARKET revenue, by application, 2020–2030 ($MILLION)
Table 138.lamea tractor MARKET revenue, by application, 2020–2030 (units)
Table 139.lamea tractor market revenue for agriculture, by power output, 2020–2030 ($million)
Table 140.lamea tractor market revenue for construction, mining & logistics, by power output, 2020–2030 ($million)
Table 141.lamea tractor market revenue for agriculture, by drive type, 2020–2030 ($million)
Table 142.lamea tractor market revenue for construction, mining & logistics, by drive type, 2020–2030 ($million)
Table 143.lamea tractor MARKET revenue, by country, 2020–2030 ($MILLION)
Table 144.latin america tractor MARKET revenue, by power output, 2020–2030 ($MILLION)
Table 145.latin america tractor MARKET revenue, by power output, 2020–2030 (units)
Table 146.latin america tractor MARKET revenue, by drive type, 2020–2030 ($MILLION)
Table 147.latin america tractor MARKET revenue, by drive type, 2020–2030 (units)
Table 148.latin america tractor MARKET revenue, by application, 2020–2030 ($MILLION)
Table 149.latin america tractor MARKET revenue, by application, 2020–2030 (units)
Table 150.middle east tractor MARKET revenue, by power output, 2020–2030 ($MILLION)
Table 151.middle east tractor MARKET revenue, by power output, 2020–2030 (units)
Table 152.middle east tractor MARKET revenue, by drive type, 2020–2030 ($MILLION)
Table 153.middle east tractor MARKET revenue, by drive type, 2020–2030 (units)
Table 154.middle east tractor MARKET revenue, by application, 2020–2030 ($MILLION)
Table 155.middle east tractor MARKET revenue, by application, 2020–2030 (units)
Table 156.africa tractor MARKET revenue, by power output, 2020–2030 ($MILLION)
Table 157.africa tractor MARKET revenue, by power output, 2020–2030 (units)
Table 158.africa tractor MARKET revenue, by drive type, 2020–2030 ($MILLION)
Table 159.africa tractor MARKET revenue, by drive type, 2020–2030 (units)
Table 160.africa tractor MARKET revenue, by application, 2020–2030 ($MILLION)
Table 161.africa tractor MARKET revenue, by application, 2020–2030 (units)
Table 162.mahindra & mahindra ltd: KEY EXECUTIVES
Table 163.mahindra & mahindra ltd: company Snapshot
Table 164.mahindra & mahindra ltd: Operating segments
Table 165.mahindra & mahindra ltd: PRODUCT portfolio
Table 166.tractors and farm equipment limited: KEY EXECUTIVE
Table 167.tractors and fARM EQUIPMENT LIMITED: company Snapshot
Table 168.tractor and farm equipment ltd: PRODUCT portfolio
Table 169.sonalika international tractors ltd: KEY EXECUTIVE
Table 170.sonalika international trACTORS ltd: company Snapshot
Table 171.sonalika international tractors ltd: PRODUCT portfolio
Table 172.escorts limited: KEY EXECUTIVE
Table 173.escorts limited: company Snapshot
Table 174.escorts limited: Operating segments
Table 175.escorts limited: PRODUCT portfolio
Table 176.hmt limited.: KEY EXECUTIVE
Table 177.hmt limited: company Snapshot
Table 178.hmt limited: Operating segments
Table 179.hmt limited: PRODUCT portfolio
Table 180.deere & company: KEY EXECUTIVES
Table 181.Deere & Company: company Snapshot
Table 182.Deere & Company: Operating segments
Table 183.Deere & Company: PRODUCT portfolio
Table 184.cnh industrial n.v.: KEY EXECUTIVE
Table 185.cnh industrial n.v.: company Snapshot
Table 186.cnh industrial n.v.: Operating segments
Table 187.CNH industrial (india) private limited.: PRODUCT portfolio
Table 188.force motors limited KEY EXECUTIVE
Table 189.force motors limited: company Snapshot
Table 190.force motors limited: PRODUCT portfolio
Table 191.Kubota corporation: KEY EXECUTIVE
Table 192.Kubota corporation: company Snapshot
Table 193.Kubota corporation: Operating segments
Table 194.Kubota corporation: PRODUCT portfolio
Table 195.v.s.t. tillers tractors ltd: KEY EXECUTIVE
Table 196.v.s.t. tillers tractors ltd.: company Snapshot
Table 197.v.s.t. tillers tractors ltd: operating segments
Table 198.v.s.t. tillers tractors ltd: PRODUCT portfolio
LIST OF FIGURES
Figure 01.Key market segments
Figure 02.Executive summary
Figure 03.Top investment pockets
Figure 04.Top Winning Strategies, By Year, 2018-2021
Figure 05.Top Winning Strategies, By Development, 2018-2021 (%)
Figure 06.Top Winning Strategies, By Company, 2018-2021
Figure 07.market player positioning, 2020
Figure 08.low to high Bargaining power of Suppliers
Figure 09.low to high bargaining power of Buyers
Figure 10.low Threat of substitutes
Figure 11.low threat of new entrants
Figure 12.moderate-to- high competitive RIVALRY
Figure 13.market dynamics
Figure 14.global tractor Market, BY power output, 2020-2030 (%)
Figure 15.tractor Market for less than 30 hp, BY COUNTRY, 2020 & 2030 (%)
Figure 16.tractor Market for 30-50 hp, BY COUNTRY, 2020 & 2030 (%)
Figure 17.global tractor Market for 51-100 hp, BY COUNTRY, 2020 & 2030 (%)
Figure 18.tractor Market for more than 100 hp, BY COUNTRY, 2020 & 2030 (%)
Figure 19.tractor market, BY drive type, 2020-2030 (%)
Figure 20.tractor Market for 2 wheel drive, BY COUNTRY, 2020 & 2030 (%)
Figure 21.tractor Market for 4 wheel drive, BY COUNTRY, 2020 & 2030 (%)
Figure 22.global tractor Market, BY application, 2020-2030 (%)
Figure 23.tractor Market for agriculture, BY COUNTRY, 2020 & 2030 (%)
Figure 24.tractor market for construction, mining and logistics, BY COUNTRY, 2020 & 2030 (%)
Figure 25.tractor MARKET, By region, 2020–2030
Figure 26.U.S. tractor MARKET revenue, 2020–2030 ($million)
Figure 27.canada tractor MARKET revenue, 2020–2030 ($million)
Figure 28.mexico tractor MARKET revenue, 2020–2030 ($million)
Figure 29.germany tractor MARKET revenue, 2020–2030 ($million)
Figure 30.france tractor MARKET revenue, 2020–2030 ($million)
Figure 31.uk tractor MARKET revenue, 2020–2030 ($million)
Figure 32.italy tractor MARKET revenue, 2020–2030 ($million)
Figure 33.rest of europe tractor MARKET revenue, 2020–2030 ($million)
Figure 34.china tractor MARKET revenue, 2020–2030 ($million)
Figure 35.india tractor MARKET revenue, 2020–2030 ($million)
Figure 36.japan tractor MARKET revenue, 2020–2030 ($million)
Figure 37.rest of asia-pacific tractor MARKET revenue, 2020–2030 ($million)
Figure 38.latin america tractor MARKET revenue, 2020–2030 ($million)
Figure 39.middle east tractor MARKET revenue, 2020–2030 ($million)
Figure 40.africa tractor MARKET revenue, 2020–2030 ($million)
Figure 01.mahindra & mahindra ltd: R&D expenditure, 2019–2021 ($MILLION)
Figure 02.mahindra & mahindra ltd: Revenue, 2019–2021 ($MILLION)
Figure 03.mahindra & mahindra ltd: Revenue share by segment, 2019–2021 ($MILLION)
Figure 04.mahindra & mahindra ltd: Revenue share by Region, 2019–2021 ($MILLION)
Figure 05.escorts ltd: R&D expenditure, 2019–2021 ($MILLION)
Figure 06.escorts limited: Revenue, 2019–2021 ($MILLION)
Figure 07.escorts limited: Revenue SHARE BY segment, 2021 (%)
Figure 08.escorts limited: Revenue SHARE BY region, 2021 (%)
Figure 09.hmt limited: Revenue, 2019–2021 ($MILLION)
Figure 10.hmt limited: Revenue share by segment, 2019–2021 ($MILLION)
Figure 11.deere & company: R&D expenditure, 2018–2020 ($MILLION)
Figure 12.deere & company: Revenue, 2018–2020 ($MILLION)
Figure 13.deere & company: Revenue share by segment, 2018–2020 ($MILLION)
Figure 14.deere & company: Revenue share by Region, 2018–2020 ($MILLION)
Figure 15.cnh industrial n.v.: R&D expenditure, 2018–2020 ($MILLION)
Figure 16.cnh industrial n.v.: Revenue, 2018–2020 ($MILLION)
Figure 17.cnh industrial n.v.: Revenue share by segment, 2018–2020 ($MILLION)
Figure 18.cnh industrial n.v.: Revenue share by Region, 2018–2020 ($MILLION)
Figure 19.force motors limited: R&D expenditure, 2018–2020 ($MILLION)
Figure 20.force motors limited: Revenue, 2018–2020 ($MILLION)
Figure 21.Kubota corporation: R&D expenditure, 2018–2020 ($MILLION)
Figure 22.Kubota corporation: Revenue, 2018-2020 ($MILLION)
Figure 23.Kubota corporation: Revenue share by segment, 2020 (%)
Figure 24.Kubota corporation: Revenue SHARE BY REGION, 2020 (%)
Figure 25.v.s.t. tillers tractors ltd: R&D expenditure, 2018–2020 ($MILLION)
Figure 26.v.s.t. tillers tractors ltd: Revenue, 2018–2020 ($MILLION)
Figure 27.v.s.t. tillers tractors ltd: Revenue share by segment, 2018–2020 ($MILLION)
Figure 28.v.s.t. tillers tractors ltd: Revenue share by Region, 2018–2020 ($MILLION)
$5769
$9995
HAVE A QUERY?
OUR CUSTOMER

SIMILAR REPORTS