
The global Disaster Recovery as a Service (DRaaS) market size was valued at $2608.6 million in 2020 and is projected to reach $11670 million by 2027, growing at a CAGR of 23.7% from 2021 to 2027. As more businesses around the world plan to migrate their IT infrastructure to the cloud, improve business continuity, and improve IT operations, the DRaaS market will continue to grow. Moreover, the advantages such as cost efficiency and reduced downtime offered by DRaaS are expected to drive the growth of the Disaster Recovery as a Service market.
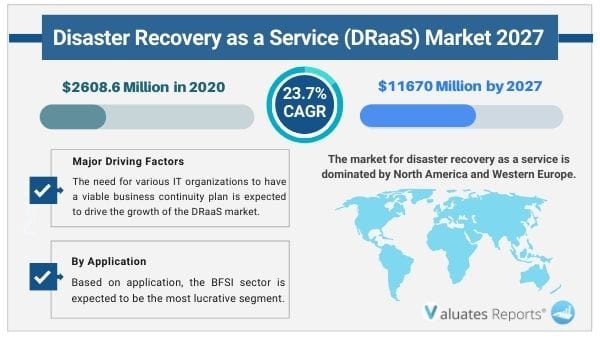
Disaster Recovery as a Service (DRaaS) is the replication and hosting of physical or virtual servers by a third party to provide failover in the event of a man-made or natural catastrophe. Disaster recovery as a service market is dominated by the North America, and Western Europe region. North America has a wide presence of key disaster recovery as a service provider, as well as the U.S. is considered as the high adopter of connected technology. Asia Pacific Excl. Japan as well as the Japan region is expected to witness significant growth in disaster recovery as a service market. The high growth of APEJ is attributed to the growing trend of business automation and the increasing number of cyber-attacks is leading to high investment in disaster recovery as a service solution by organizations based in the region. Eastern Europe and Latin America is expected to see a significant growth rate in disaster recovery as a service market.
With industry-standard accuracy in analysis and high data integrity, the report makes a brilliant attempt to unveil key opportunities available in the global Disaster Recovery as a Service (DRaaS) market to help players in achieving a strong market position. Buyers of the report can access verified and reliable market forecasts, including those for the overall size of the global Disaster Recovery as a Service (DRaaS) market in terms of revenue.
On the whole, the report proves to be an effective tool that players can use to gain a competitive edge over their competitors and ensure lasting success in the global Disaster Recovery as a Service (DRaaS) market. All of the findings, data, and information provided in the report are validated and revalidated with the help of trustworthy sources. The analysts who have authored the report took a unique and industry-best research and analysis approach for an in-depth study of the global Disaster Recovery as a Service (DRaaS) market.
In the competitive analysis section of the report, leading as well as prominent players of the global Disaster Recovery as a Service (DRaaS) market are broadly studied on the basis of key factors. The report offers comprehensive analysis and accurate statistics on revenue by the player for the period 2016-2021. It also offers detailed analysis supported by reliable statistics on price and revenue (global level) by player for the period 2016-2021.
|
Report Metric |
Details |
|
Base Year: |
2021 |
|
Market Size in 2020: |
USD 2608.6 Million |
|
Forecast Period: |
2021 to 2027 |
|
Largest Market |
North America |
|
Fastest Growing Market |
Asia Pacific, Japan |
|
Forecast Period 2021 to 2027 CAGR: |
23.7% |
|
2027 Value Projection: |
USD 11670 Million |
|
No. of Pages: |
121 |
|
Tables & Figures |
143 |
|
Segments covered: |
Type, Application, Region |
Ans. The global Disaster Recovery as a Service (DRaaS) market size was valued at $2608.6 million in 2020 and is projected to reach $11670 million by 2027, growing at a CAGR of 23.7% from 2021 to 2027
Ans. The need for various IT organizations to have a viable business continuity plan is expected to drive the growth of the DRaaS market
Ans. The Global Disaster Recovery as a Service Market is Segmented on the basis of Type, Application, Region.
Ans. The sample report for the Disaster Recovery as a Service Market can be obtained on demand from the website. Also, the 24*7 chat support & direct call services are provided to procure the sample report.
Ans. Based on application, the BFSI sector is expected to be the most lucrative segment.
Ans. The disaster recovery as a service market in the Asia Pacific, excluding Japan is expected to grow significantly.
1 Report Overview
1.1 Study Scope
1.2 Market Analysis by Type
1.2.1 Global Disaster Recovery as a Service (DRaaS) Market Size Growth Rate by Type: 2016 VS 2021 VS 2027
1.2.2 Private Cloud
1.2.3 Public Cloud
1.2.4 Hybrid Cloud
1.3 Market by Application
1.3.1 Global Disaster Recovery as a Service (DRaaS) Market Share by Application: 2016 VS 2021 VS 2027
1.3.2 BFSI
1.3.3 Consumer Goods and Retail
1.3.4 Government and Public Sector
1.3.5 IT and Telecom
1.3.6 Media and Entertainment
1.3.7 Manufacturing and Logistics
1.3.8 Healthcare and Life Sciences
1.3.9 Others
1.4 Study Objectives
1.5 Years Considered
2 Global Growth Trends
2.1 Global Disaster Recovery as a Service (DRaaS) Market Perspective (2016-2027)
2.2 Disaster Recovery as a Service (DRaaS) Growth Trends by Regions
2.2.1 Disaster Recovery as a Service (DRaaS) Market Size by Regions: 2016 VS 2021 VS 2027
2.2.2 Disaster Recovery as a Service (DRaaS) Historic Market Share by Regions (2016-2021)
2.2.3 Disaster Recovery as a Service (DRaaS) Forecasted Market Size by Regions (2022-2027)
2.3 Disaster Recovery as a Service (DRaaS) Industry Dynamic
2.3.1 Disaster Recovery as a Service (DRaaS) Market Trends
2.3.2 Disaster Recovery as a Service (DRaaS) Market Drivers
2.3.3 Disaster Recovery as a Service (DRaaS) Market Challenges
2.3.4 Disaster Recovery as a Service (DRaaS) Market Restraints
3 Competition Landscape by Key Players
3.1 Global Top Disaster Recovery as a Service (DRaaS) Players by Revenue
3.1.1 Global Top Disaster Recovery as a Service (DRaaS) Players by Revenue (2016-2021)
3.1.2 Global Disaster Recovery as a Service (DRaaS) Revenue Market Share by Players (2016-2021)
3.2 Global Disaster Recovery as a Service (DRaaS) Market Share by Company Type (Tier 1, Tier 2 and Tier 3)
3.3 Players Covered: Ranking by Disaster Recovery as a Service (DRaaS) Revenue
3.4 Global Disaster Recovery as a Service (DRaaS) Market Concentration Ratio
3.4.1 Global Disaster Recovery as a Service (DRaaS) Market Concentration Ratio (CR5 and HHI)
3.4.2 Global Top 10 and Top 5 Companies by Disaster Recovery as a Service (DRaaS) Revenue in 2020
3.5 Disaster Recovery as a Service (DRaaS) Key Players Head office and Area Served
3.6 Key Players Disaster Recovery as a Service (DRaaS) Product Solution and Service
3.7 Date of Enter into Disaster Recovery as a Service (DRaaS) Market
3.8 Mergers & Acquisitions, Expansion Plans
4 Disaster Recovery as a Service (DRaaS) Breakdown Data by Type
4.1 Global Disaster Recovery as a Service (DRaaS) Historic Market Size by Type (2016-2021)
4.2 Global Disaster Recovery as a Service (DRaaS) Forecasted Market Size by Type (2022-2027)
5 Disaster Recovery as a Service (DRaaS) Breakdown Data by Application
5.1 Global Disaster Recovery as a Service (DRaaS) Historic Market Size by Application (2016-2021)
5.2 Global Disaster Recovery as a Service (DRaaS) Forecasted Market Size by Application (2022-2027)
6 North America
6.1 North America Disaster Recovery as a Service (DRaaS) Market Size (2016-2027)
6.2 North America Disaster Recovery as a Service (DRaaS) Market Size by Type
6.2.1 North America Disaster Recovery as a Service (DRaaS) Market Size by Type (2016-2021)
6.2.2 North America Disaster Recovery as a Service (DRaaS) Market Size by Type (2022-2027)
6.2.3 North America Disaster Recovery as a Service (DRaaS) Market Size by Type (2016-2027)
6.3 North America Disaster Recovery as a Service (DRaaS) Market Size by Application
6.3.1 North America Disaster Recovery as a Service (DRaaS) Market Size by Application (2016-2021)
6.3.2 North America Disaster Recovery as a Service (DRaaS) Market Size by Application (2022-2027)
6.3.3 North America Disaster Recovery as a Service (DRaaS) Market Size by Application (2016-2027)
6.4 North America Disaster Recovery as a Service (DRaaS) Market Size by Country
6.4.1 North America Disaster Recovery as a Service (DRaaS) Market Size by Country (2016-2021)
6.4.2 North America Disaster Recovery as a Service (DRaaS) Market Size by Country (2022-2027)
6.4.3 United States
6.4.4 Canada
7 Europe
7.1 Europe Disaster Recovery as a Service (DRaaS) Market Size (2016-2027)
7.2 Europe Disaster Recovery as a Service (DRaaS) Market Size by Type
7.2.1 Europe Disaster Recovery as a Service (DRaaS) Market Size by Type (2016-2021)
7.2.2 Europe Disaster Recovery as a Service (DRaaS) Market Size by Type (2022-2027)
7.2.3 Europe Disaster Recovery as a Service (DRaaS) Market Size by Type (2016-2027)
7.3 Europe Disaster Recovery as a Service (DRaaS) Market Size by Application
7.3.1 Europe Disaster Recovery as a Service (DRaaS) Market Size by Application (2016-2021)
7.3.2 Europe Disaster Recovery as a Service (DRaaS) Market Size by Application (2022-2027)
7.3.3 Europe Disaster Recovery as a Service (DRaaS) Market Size by Application (2016-2027)
7.4 Europe Disaster Recovery as a Service (DRaaS) Market Size by Country
7.4.1 Europe Disaster Recovery as a Service (DRaaS) Market Size by Country (2016-2021)
7.4.2 Europe Disaster Recovery as a Service (DRaaS) Market Size by Country (2022-2027)
7.4.3 Germany
7.4.4 France
7.4.5 U.K.
7.4.6 Italy
7.4.7 Russia
7.4.8 Nordic
8 Asia-Pacific
8.1 Asia-Pacific Disaster Recovery as a Service (DRaaS) Market Size (2016-2027)
8.2 Asia-Pacific Disaster Recovery as a Service (DRaaS) Market Size by Type
8.2.1 Asia-Pacific Disaster Recovery as a Service (DRaaS) Market Size by Type (2016-2021)
8.2.2 Asia-Pacific Disaster Recovery as a Service (DRaaS) Market Size by Type (2022-2027)
8.2.3 Asia-Pacific Disaster Recovery as a Service (DRaaS) Market Size by Type (2016-2027)
8.3 Asia-Pacific Disaster Recovery as a Service (DRaaS) Market Size by Application
8.3.1 Asia-Pacific Disaster Recovery as a Service (DRaaS) Market Size by Application (2016-2021)
8.3.2 Asia-Pacific Disaster Recovery as a Service (DRaaS) Market Size by Application (2022-2027)
8.3.3 Asia-Pacific Disaster Recovery as a Service (DRaaS) Market Size by Application (2016-2027)
8.4 Asia-Pacific Disaster Recovery as a Service (DRaaS) Market Size by Region
8.4.1 Asia-Pacific Disaster Recovery as a Service (DRaaS) Market Size by Region (2016-2021)
8.4.2 Asia-Pacific Disaster Recovery as a Service (DRaaS) Market Size by Region (2022-2027)
8.4.3 China
8.4.4 Japan
8.4.5 South Korea
8.4.6 Southeast Asia
8.4.7 India
8.4.8 Australia
9 Latin America
9.1 Latin America Disaster Recovery as a Service (DRaaS) Market Size (2016-2027)
9.2 Latin America Disaster Recovery as a Service (DRaaS) Market Size by Type
9.2.1 Latin America Disaster Recovery as a Service (DRaaS) Market Size by Type (2016-2021)
9.2.2 Latin America Disaster Recovery as a Service (DRaaS) Market Size by Type (2022-2027)
9.2.3 Latin America Disaster Recovery as a Service (DRaaS) Market Size by Type (2016-2027)
9.3 Latin America Disaster Recovery as a Service (DRaaS) Market Size by Application
9.3.1 Latin America Disaster Recovery as a Service (DRaaS) Market Size by Application (2016-2021)
9.3.2 Latin America Disaster Recovery as a Service (DRaaS) Market Size by Application (2022-2027)
9.3.3 Latin America Disaster Recovery as a Service (DRaaS) Market Size by Application (2016-2027)
9.4 Latin America Disaster Recovery as a Service (DRaaS) Market Size by Country
9.4.1 Latin America Disaster Recovery as a Service (DRaaS) Market Size by Country (2016-2021)
9.4.2 Latin America Disaster Recovery as a Service (DRaaS) Market Size by Country (2022-2027)
9.4.3 Mexico
9.4.4 Brazil
10 Middle East & Africa
10.1 Middle East & Africa Disaster Recovery as a Service (DRaaS) Market Size (2016-2027)
10.2 Middle East & Africa Disaster Recovery as a Service (DRaaS) Market Size by Type
10.2.1 Middle East & Africa Disaster Recovery as a Service (DRaaS) Market Size by Type (2016-2021)
10.2.2 Middle East & Africa Disaster Recovery as a Service (DRaaS) Market Size by Type (2022-2027)
10.2.3 Middle East & Africa Disaster Recovery as a Service (DRaaS) Market Size by Type (2016-2027)
10.3 Middle East & Africa Disaster Recovery as a Service (DRaaS) Market Size by Application
10.3.1 Middle East & Africa Disaster Recovery as a Service (DRaaS) Market Size by Application (2016-2021)
10.3.2 Middle East & Africa Disaster Recovery as a Service (DRaaS) Market Size by Application (2022-2027)
10.3.3 Middle East & Africa Disaster Recovery as a Service (DRaaS) Market Size by Application (2016-2027)
10.4 Middle East & Africa Disaster Recovery as a Service (DRaaS) Market Size by Country
10.4.1 Middle East & Africa Disaster Recovery as a Service (DRaaS) Market Size by Country (2016-2021)
10.4.2 Middle East & Africa Disaster Recovery as a Service (DRaaS) Market Size by Country (2022-2027)
10.4.3 Turkey
10.4.4 Saudi Arabia
10.4.5 UAE
11 Key Players Profiles
11.1 IBM
11.1.1 IBM Company Details
11.1.2 IBM Business Overview
11.1.3 IBM Disaster Recovery as a Service (DRaaS) Introduction
11.1.4 IBM Revenue in Disaster Recovery as a Service (DRaaS) Business (2016-2021)
11.1.5 IBM Recent Development
11.2 Microsoft
11.2.1 Microsoft Company Details
11.2.2 Microsoft Business Overview
11.2.3 Microsoft Disaster Recovery as a Service (DRaaS) Introduction
11.2.4 Microsoft Revenue in Disaster Recovery as a Service (DRaaS) Business (2016-2021)
11.2.5 Microsoft Recent Development
11.3 SunGard Availability Services
11.3.1 SunGard Availability Services Company Details
11.3.2 SunGard Availability Services Business Overview
11.3.3 SunGard Availability Services Disaster Recovery as a Service (DRaaS) Introduction
11.3.4 SunGard Availability Services Revenue in Disaster Recovery as a Service (DRaaS) Business (2016-2021)
11.3.5 SunGard Availability Services Recent Development
11.4 VMware Inc.
11.4.1 VMware Inc. Company Details
11.4.2 VMware Inc. Business Overview
11.4.3 VMware Inc. Disaster Recovery as a Service (DRaaS) Introduction
11.4.4 VMware Inc. Revenue in Disaster Recovery as a Service (DRaaS) Business (2016-2021)
11.4.5 VMware Inc. Recent Development
11.5 Cable & Wireless Communications
11.5.1 Cable & Wireless Communications Company Details
11.5.2 Cable & Wireless Communications Business Overview
11.5.3 Cable & Wireless Communications Disaster Recovery as a Service (DRaaS) Introduction
11.5.4 Cable & Wireless Communications Revenue in Disaster Recovery as a Service (DRaaS) Business (2016-2021)
11.5.5 Cable & Wireless Communications Recent Development
11.6 Amazon Web Services
11.6.1 Amazon Web Services Company Details
11.6.2 Amazon Web Services Business Overview
11.6.3 Amazon Web Services Disaster Recovery as a Service (DRaaS) Introduction
11.6.4 Amazon Web Services Revenue in Disaster Recovery as a Service (DRaaS) Business (2016-2021)
11.6.5 Amazon Web Services Recent Development
11.7 Iland
11.7.1 Iland Company Details
11.7.2 Iland Business Overview
11.7.3 Iland Disaster Recovery as a Service (DRaaS) Introduction
11.7.4 Iland Revenue in Disaster Recovery as a Service (DRaaS) Business (2016-2021)
11.7.5 Iland Recent Development
11.8 Tierpoint
11.8.1 Tierpoint Company Details
11.8.2 Tierpoint Business Overview
11.8.3 Tierpoint Disaster Recovery as a Service (DRaaS) Introduction
11.8.4 Tierpoint Revenue in Disaster Recovery as a Service (DRaaS) Business (2016-2021)
11.8.5 Tierpoint Recent Development
11.9 Infrascale
11.9.1 Infrascale Company Details
11.9.2 Infrascale Business Overview
11.9.3 Infrascale Disaster Recovery as a Service (DRaaS) Introduction
11.9.4 Infrascale Revenue in Disaster Recovery as a Service (DRaaS) Business (2016-2021)
11.9.5 Infrascale Recent Development
11.10 Bluelock
11.10.1 Bluelock Company Details
11.10.2 Bluelock Business Overview
11.10.3 Bluelock Disaster Recovery as a Service (DRaaS) Introduction
11.10.4 Bluelock Revenue in Disaster Recovery as a Service (DRaaS) Business (2016-2021)
11.10.5 Bluelock Recent Development
11.11 Recovery Point
11.11.1 Recovery Point Company Details
11.11.2 Recovery Point Business Overview
11.11.3 Recovery Point Disaster Recovery as a Service (DRaaS) Introduction
11.11.4 Recovery Point Revenue in Disaster Recovery as a Service (DRaaS) Business (2016-2021)
11.11.5 Recovery Point Recent Development
11.12 NTT Communications
11.12.1 NTT Communications Company Details
11.12.2 NTT Communications Business Overview
11.12.3 NTT Communications Disaster Recovery as a Service (DRaaS) Introduction
11.12.4 NTT Communications Revenue in Disaster Recovery as a Service (DRaaS) Business (2016-2021)
11.12.5 NTT Communications Recent Development
11.13 Acronis
11.13.1 Acronis Company Details
11.13.2 Acronis Business Overview
11.13.3 Acronis Disaster Recovery as a Service (DRaaS) Introduction
11.13.4 Acronis Revenue in Disaster Recovery as a Service (DRaaS) Business (2016-2021)
11.13.5 Acronis Recent Development
11.14 Geminare
11.14.1 Geminare Company Details
11.14.2 Geminare Business Overview
11.14.3 Geminare Disaster Recovery as a Service (DRaaS) Introduction
11.14.4 Geminare Revenue in Disaster Recovery as a Service (DRaaS) Business (2016-2021)
11.14.5 Geminare Recent Development
11.15 Zetta, Inc.
11.15.1 Zetta, Inc. Company Details
11.15.2 Zetta, Inc. Business Overview
11.15.3 Zetta, Inc. Disaster Recovery as a Service (DRaaS) Introduction
11.15.4 Zetta, Inc. Revenue in Disaster Recovery as a Service (DRaaS) Business (2016-2021)
11.15.5 Zetta, Inc. Recent Development
11.16 Asigra
11.16.1 Asigra Company Details
11.16.2 Asigra Business Overview
11.16.3 Asigra Disaster Recovery as a Service (DRaaS) Introduction
11.16.4 Asigra Revenue in Disaster Recovery as a Service (DRaaS) Business (2016-2021)
11.16.5 Asigra Recent Development
11.17 Veritas
11.17.1 Veritas Company Details
11.17.2 Veritas Business Overview
11.17.3 Veritas Disaster Recovery as a Service (DRaaS) Introduction
11.17.4 Veritas Revenue in Disaster Recovery as a Service (DRaaS) Business (2016-2021)
11.17.5 Veritas Recent Development
11.18 Quorum
11.18.1 Quorum Company Details
11.18.2 Quorum Business Overview
11.18.3 Quorum Disaster Recovery as a Service (DRaaS) Introduction
11.18.4 Quorum Revenue in Disaster Recovery as a Service (DRaaS) Business (2016-2021)
11.18.5 Quorum Recent Development
12 Analyst's Viewpoints/Conclusions
13 Appendix
13.1 Research Methodology
13.1.1 Methodology/Research Approach
13.1.2 Data Source
13.2 Disclaimer
13.3 Author Details
Table 1. Global Disaster Recovery as a Service (DRaaS) Market Size Growth Rate by Type (US$ Million):2016 VS 2021 VS 2027
Table 2. Key Players of Private Cloud
Table 3. Key Players of Public Cloud
Table 4. Key Players of Hybrid Cloud
Table 5. Global Disaster Recovery as a Service (DRaaS) Market Size Growth by Application (US$ Million): 2016 VS 2021 VS 2027
Table 6. Global Disaster Recovery as a Service (DRaaS) Market Size by Regions (US$ Million): 2016 VS 2021 VS 2027
Table 7. Global Disaster Recovery as a Service (DRaaS) Market Size by Regions (2016-2021) & (US$ Million)
Table 8. Global Disaster Recovery as a Service (DRaaS) Market Share by Regions (2016-2021)
Table 9. Global Disaster Recovery as a Service (DRaaS) Forecasted Market Size by Regions (2022-2027) & (US$ Million)
Table 10. Global Disaster Recovery as a Service (DRaaS) Market Share by Regions (2022-2027)
Table 11. Disaster Recovery as a Service (DRaaS) Market Trends
Table 12. Disaster Recovery as a Service (DRaaS) Market Drivers
Table 13. Disaster Recovery as a Service (DRaaS) Market Challenges
Table 14. Disaster Recovery as a Service (DRaaS) Market Restraints
Table 15. Global Disaster Recovery as a Service (DRaaS) Revenue by Players (2016-2021) & (US$ Million)
Table 16. Global Disaster Recovery as a Service (DRaaS) Market Share by Players (2016-2021)
Table 17. Global Top Disaster Recovery as a Service (DRaaS) Players by Company Type (Tier 1, Tier 2 and Tier 3) (based on the Revenue in Disaster Recovery as a Service (DRaaS) as of 2020)
Table 18. Ranking of Global Top Disaster Recovery as a Service (DRaaS) Companies by Revenue (US$ Million) in 2020
Table 19. Global 5 Largest Players Market Share by Disaster Recovery as a Service (DRaaS) Revenue (CR5 and HHI) & (2016-2021)
Table 20. Key Players Headquarters and Area Served
Table 21. Key Players Disaster Recovery as a Service (DRaaS) Product Solution and Service
Table 22. Date of Enter into Disaster Recovery as a Service (DRaaS) Market
Table 23. Mergers & Acquisitions, Expansion Plans
Table 24. Global Disaster Recovery as a Service (DRaaS) Market Size by Type (2016-2021) (US$ Million)
Table 25. Global Disaster Recovery as a Service (DRaaS) Revenue Market Share by Type (2016-2021)
Table 26. Global Disaster Recovery as a Service (DRaaS) Forecasted Market Size by Type (2022-2027) (US$ Million)
Table 27. Global Disaster Recovery as a Service (DRaaS) Revenue Market Share by Type (2022-2027) & (US$ Million)
Table 28. Global Disaster Recovery as a Service (DRaaS) Market Size Share by Application (2016-2021) & (US$ Million)
Table 29. Global Disaster Recovery as a Service (DRaaS) Revenue Market Share by Application (2016-2021)
Table 30. Global Disaster Recovery as a Service (DRaaS) Forecasted Market Size by Application (2022-2027) (US$ Million)
Table 31. Global Disaster Recovery as a Service (DRaaS) Revenue Market Share by Application (2022-2027) & (US$ Million)
Table 32. North America Disaster Recovery as a Service (DRaaS) Market Size by Type (2016-2021) (US$ Million)
Table 33. North America Disaster Recovery as a Service (DRaaS) Market Size by Type (2022-2027) & (US$ Million)
Table 34. North America Disaster Recovery as a Service (DRaaS) Market Size by Application (2016-2021) (US$ Million)
Table 35. North America Disaster Recovery as a Service (DRaaS) Market Size by Application (2022-2027) & (US$ Million)
Table 36. North America Disaster Recovery as a Service (DRaaS) Market Size by Country (2016-2021) & (US$ Million)
Table 37. North America Disaster Recovery as a Service (DRaaS) Market Size by Country (2022-2027) & (US$ Million)
Table 38. Europe Disaster Recovery as a Service (DRaaS) Market Size by Type (2016-2021) (US$ Million)
Table 39. Europe Disaster Recovery as a Service (DRaaS) Market Size by Type (2022-2027) & (US$ Million)
Table 40. Europe Disaster Recovery as a Service (DRaaS) Market Size by Application (2016-2021) (US$ Million)
Table 41. Europe Disaster Recovery as a Service (DRaaS) Market Size by Application (2022-2027) & (US$ Million)
Table 42. Europe Disaster Recovery as a Service (DRaaS) Market Size by Country (2016-2021) & (US$ Million)
Table 43. Europe Disaster Recovery as a Service (DRaaS) Market Size by Country (2022-2027) & (US$ Million)
Table 44. Asia-Pacific Disaster Recovery as a Service (DRaaS) Market Size by Type (2016-2021) (US$ Million)
Table 45. Asia-Pacific Disaster Recovery as a Service (DRaaS) Market Size by Type (2022-2027) & (US$ Million)
Table 46. Asia-Pacific Disaster Recovery as a Service (DRaaS) Market Size by Application (2016-2021) (US$ Million)
Table 47. Asia-Pacific Disaster Recovery as a Service (DRaaS) Market Size by Application (2022-2027) & (US$ Million)
Table 48. Asia-Pacific Disaster Recovery as a Service (DRaaS) Market Size by Region (2016-2021) & (US$ Million)
Table 49. Asia-Pacific Disaster Recovery as a Service (DRaaS) Market Size by Region (2022-2027) & (US$ Million)
Table 50. Latin America Disaster Recovery as a Service (DRaaS) Market Size by Type (2016-2021) (US$ Million)
Table 51. Latin America Disaster Recovery as a Service (DRaaS) Market Size by Type (2022-2027) & (US$ Million)
Table 52. Latin America Disaster Recovery as a Service (DRaaS) Market Size by Application (2016-2021) (US$ Million)
Table 53. Latin America Disaster Recovery as a Service (DRaaS) Market Size by Application (2022-2027) & (US$ Million)
Table 54. Latin America Disaster Recovery as a Service (DRaaS) Market Size by Country (2016-2021) & (US$ Million)
Table 55. Latin America Disaster Recovery as a Service (DRaaS) Market Size by Country (2022-2027) & (US$ Million)
Table 56. Middle East & Africa Disaster Recovery as a Service (DRaaS) Market Size by Type (2016-2021) (US$ Million)
Table 57. Middle East & Africa Disaster Recovery as a Service (DRaaS) Market Size by Type (2022-2027) & (US$ Million)
Table 58. Middle East & Africa Disaster Recovery as a Service (DRaaS) Market Size by Application (2016-2021) (US$ Million)
Table 59. Middle East & Africa Disaster Recovery as a Service (DRaaS) Market Size by Application (2022-2027) & (US$ Million)
Table 60. Middle East & Africa Disaster Recovery as a Service (DRaaS) Market Size by Country (2016-2021) & (US$ Million)
Table 61. Middle East & Africa Disaster Recovery as a Service (DRaaS) Market Size by Country (2022-2027) & (US$ Million)
Table 62. IBM Company Details
Table 63. IBM Business Overview
Table 64. IBM Disaster Recovery as a Service (DRaaS) Product
Table 65. IBM Revenue in Disaster Recovery as a Service (DRaaS) Business (2016-2021) & (US$ Million)
Table 66. IBM Recent Development
Table 67. Microsoft Company Details
Table 68. Microsoft Business Overview
Table 69. Microsoft Disaster Recovery as a Service (DRaaS) Product
Table 70. Microsoft Revenue in Disaster Recovery as a Service (DRaaS) Business (2016-2021) & (US$ Million)
Table 71. Microsoft Recent Development
Table 72. SunGard Availability Services Company Details
Table 73. SunGard Availability Services Business Overview
Table 74. SunGard Availability Services Disaster Recovery as a Service (DRaaS) Product
Table 75. SunGard Availability Services Revenue in Disaster Recovery as a Service (DRaaS) Business (2016-2021) & (US$ Million)
Table 76. SunGard Availability Services Recent Development
Table 77. VMware Inc. Company Details
Table 78. VMware Inc. Business Overview
Table 79. VMware Inc. Disaster Recovery as a Service (DRaaS) Product
Table 80. VMware Inc. Revenue in Disaster Recovery as a Service (DRaaS) Business (2016-2021) & (US$ Million)
Table 81. VMware Inc. Recent Development
Table 82. Cable & Wireless Communications Company Details
Table 83. Cable & Wireless Communications Business Overview
Table 84. Cable & Wireless Communications Disaster Recovery as a Service (DRaaS) Product
Table 85. Cable & Wireless Communications Revenue in Disaster Recovery as a Service (DRaaS) Business (2016-2021) & (US$ Million)
Table 86. Cable & Wireless Communications Recent Development
Table 87. Amazon Web Services Company Details
Table 88. Amazon Web Services Business Overview
Table 89. Amazon Web Services Disaster Recovery as a Service (DRaaS) Product
Table 90. Amazon Web Services Revenue in Disaster Recovery as a Service (DRaaS) Business (2016-2021) & (US$ Million)
Table 91. Amazon Web Services Recent Development
Table 92. Iland Company Details
Table 93. Iland Business Overview
Table 94. Iland Disaster Recovery as a Service (DRaaS) Product
Table 95. Iland Revenue in Disaster Recovery as a Service (DRaaS) Business (2016-2021) & (US$ Million)
Table 96. Iland Recent Development
Table 97. Tierpoint Company Details
Table 98. Tierpoint Business Overview
Table 99. Tierpoint Revenue in Disaster Recovery as a Service (DRaaS) Business (2016-2021) & (US$ Million)
Table 100. Tierpoint Recent Development
Table 101. Infrascale Company Details
Table 102. Infrascale Business Overview
Table 103. Infrascale Disaster Recovery as a Service (DRaaS) Product
Table 104. Infrascale Revenue in Disaster Recovery as a Service (DRaaS) Business (2016-2021) & (US$ Million)
Table 105. Infrascale Recent Development
Table 106. Bluelock Company Details
Table 107. Bluelock Business Overview
Table 108. Bluelock Disaster Recovery as a Service (DRaaS) Product
Table 109. Bluelock Revenue in Disaster Recovery as a Service (DRaaS) Business (2016-2021) & (US$ Million)
Table 110. Bluelock Recent Development
Table 111. Recovery Point Company Details
Table 112. Recovery Point Business Overview
Table 113. Recovery Point Disaster Recovery as a Service (DRaaS) Product
Table 114. Recovery Point Revenue in Disaster Recovery as a Service (DRaaS) Business (2016-2021) & (US$ Million)
Table 115. Recovery Point Recent Development
Table 116. NTT Communications Company Details
Table 117. NTT Communications Business Overview
Table 118. NTT Communications Disaster Recovery as a Service (DRaaS) Product
Table 119. NTT Communications Revenue in Disaster Recovery as a Service (DRaaS) Business (2016-2021) & (US$ Million)
Table 120. NTT Communications Recent Development
Table 121. Acronis Company Details
Table 122. Acronis Business Overview
Table 123. Acronis Disaster Recovery as a Service (DRaaS) Product
Table 124. Acronis Revenue in Disaster Recovery as a Service (DRaaS) Business (2016-2021) & (US$ Million)
Table 125. Acronis Recent Development
Table 126. Geminare Company Details
Table 127. Geminare Business Overview
Table 128. Geminare Disaster Recovery as a Service (DRaaS) Product
Table 129. Geminare Revenue in Disaster Recovery as a Service (DRaaS) Business (2016-2021) & (US$ Million)
Table 130. Geminare Recent Development
Table 131. Zetta, Inc. Company Details
Table 132. Zetta, Inc. Business Overview
Table 133. Zetta, Inc. Disaster Recovery as a Service (DRaaS) Product
Table 134. Zetta, Inc. Revenue in Disaster Recovery as a Service (DRaaS) Business (2016-2021) & (US$ Million)
Table 135. Zetta, Inc. Recent Development
Table 136. Asigra Company Details
Table 137. Asigra Business Overview
Table 138. Asigra Disaster Recovery as a Service (DRaaS) Product
Table 139. Asigra Revenue in Disaster Recovery as a Service (DRaaS) Business (2016-2021) & (US$ Million)
Table 140. Asigra Recent Development
Table 141. Veritas Company Details
Table 142. Veritas Business Overview
Table 143. Veritas Disaster Recovery as a Service (DRaaS) Product
Table 144. Veritas Revenue in Disaster Recovery as a Service (DRaaS) Business (2016-2021) & (US$ Million)
Table 145. Veritas Recent Development
Table 146. Quorum Company Details
Table 147. Quorum Business Overview
Table 148. Quorum Disaster Recovery as a Service (DRaaS) Product
Table 149. Quorum Revenue in Disaster Recovery as a Service (DRaaS) Business (2016-2021) & (US$ Million)
Table 150. Quorum Recent Development
Table 151. Research Programs/Design for This Report
Table 152. Key Data Information from Secondary Sources
Table 153. Key Data Information from Primary Sources
List of Figures
Figure 1. Global Disaster Recovery as a Service (DRaaS) Market Share by Type: 2020 VS 2027
Figure 2. Private Cloud Features
Figure 3. Public Cloud Features
Figure 4. Hybrid Cloud Features
Figure 5. Global Disaster Recovery as a Service (DRaaS) Market Share by Application: 2020 VS 2027
Figure 6. BFSI Case Studies
Figure 7. Consumer Goods and Retail Case Studies
Figure 8. Government and Public Sector Case Studies
Figure 9. IT and Telecom Case Studies
Figure 10. Media and Entertainment Case Studies
Figure 11. Manufacturing and Logistics Case Studies
Figure 12. Healthcare and Life Sciences Case Studies
Figure 13. Others Case Studies
Figure 14. Disaster Recovery as a Service (DRaaS) Report Years Considered
Figure 15. Global Disaster Recovery as a Service (DRaaS) Market Size (US$ Million), Year-over-Year: 2016-2027
Figure 16. Global Disaster Recovery as a Service (DRaaS) Market Size (US$ Million), 2016 VS 2021 VS 2027
Figure 17. Global Disaster Recovery as a Service (DRaaS) Market Share by Regions: 2020 VS 2027
Figure 18. Global Disaster Recovery as a Service (DRaaS) Market Share by Regions (2022-2027)
Figure 19. Global Disaster Recovery as a Service (DRaaS) Market Share by Players in 2020
Figure 20. Global Top Disaster Recovery as a Service (DRaaS) Players by Company Type (Tier 1, Tier 2 and Tier 3) (based on the Revenue in Disaster Recovery as a Service (DRaaS) as of 2020
Figure 21. The Top 10 and 5 Players Market Share by Disaster Recovery as a Service (DRaaS) Revenue in 2020
Figure 22. Global Disaster Recovery as a Service (DRaaS) Revenue Market Share by Type (2016-2021)
Figure 23. Global Disaster Recovery as a Service (DRaaS) Revenue Market Share by Type (2022-2027)
Figure 24. North America Disaster Recovery as a Service (DRaaS) Market Size YoY Growth (2016-2027) & (US$ Million)
Figure 25. North America Disaster Recovery as a Service (DRaaS) Market Share by Type (2016-2027)
Figure 26. North America Disaster Recovery as a Service (DRaaS) Market Share by Application (2016-2027)
Figure 27. North America Disaster Recovery as a Service (DRaaS) Market Share by Country (2016-2027)
Figure 28. United States Disaster Recovery as a Service (DRaaS) Market Size YoY Growth (2016-2027) & (US$ Million)
Figure 29. Canada Disaster Recovery as a Service (DRaaS) Market Size YoY Growth (2016-2027) & (US$ Million)
Figure 30. Europe Disaster Recovery as a Service (DRaaS) Market Size YoY Growth (2016-2027) & (US$ Million)
Figure 31. Europe Disaster Recovery as a Service (DRaaS) Market Share by Type (2016-2027)
Figure 32. Europe Disaster Recovery as a Service (DRaaS) Market Share by Application (2016-2027)
Figure 33. Europe Disaster Recovery as a Service (DRaaS) Market Share by Country (2016-2027)
Figure 34. Germany Disaster Recovery as a Service (DRaaS) Market Size YoY Growth (2016-2027) & (US$ Million)
Figure 35. France Disaster Recovery as a Service (DRaaS) Market Size YoY Growth (2016-2027) & (US$ Million)
Figure 36. U.K. Disaster Recovery as a Service (DRaaS) Market Size YoY Growth (2016-2027) & (US$ Million)
Figure 37. Italy Disaster Recovery as a Service (DRaaS) Market Size YoY Growth (2016-2027) & (US$ Million)
Figure 38. Russia Disaster Recovery as a Service (DRaaS) Market Size YoY Growth (2016-2027) & (US$ Million)
Figure 39. Nordic Disaster Recovery as a Service (DRaaS) Market Size YoY Growth (2016-2027) & (US$ Million)
Figure 40. Asia-Pacific Disaster Recovery as a Service (DRaaS) Market Size YoY Growth (2016-2027) & (US$ Million)
Figure 41. Asia-Pacific Disaster Recovery as a Service (DRaaS) Market Share by Type (2016-2027)
Figure 42. Asia-Pacific Disaster Recovery as a Service (DRaaS) Market Share by Application (2016-2027)
Figure 43. Asia-Pacific Disaster Recovery as a Service (DRaaS) Market Share by Region (2016-2027)
Figure 44. China Disaster Recovery as a Service (DRaaS) Market Size YoY Growth (2016-2027) & (US$ Million)
Figure 45. Japan Disaster Recovery as a Service (DRaaS) Market Size YoY Growth (2016-2027) & (US$ Million)
Figure 46. South Korea Disaster Recovery as a Service (DRaaS) Market Size YoY Growth (2016-2027) & (US$ Million)
Figure 47. Southeast Asia Disaster Recovery as a Service (DRaaS) Market Size YoY Growth (2016-2027) & (US$ Million)
Figure 48. India Disaster Recovery as a Service (DRaaS) Market Size YoY Growth (2016-2027) & (US$ Million)
Figure 49. Australia Disaster Recovery as a Service (DRaaS) Market Size YoY Growth (2016-2027) & (US$ Million)
Figure 50. Latin America Disaster Recovery as a Service (DRaaS) Market Size YoY Growth (2016-2027) & (US$ Million)
Figure 51. Latin America Disaster Recovery as a Service (DRaaS) Market Share by Type (2016-2027)
Figure 52. Latin America Disaster Recovery as a Service (DRaaS) Market Share by Application (2016-2027)
Figure 53. Latin America Disaster Recovery as a Service (DRaaS) Market Share by Country (2016-2027)
Figure 54. Mexico Disaster Recovery as a Service (DRaaS) Market Size YoY Growth (2016-2027) & (US$ Million)
Figure 55. Brazil Disaster Recovery as a Service (DRaaS) Market Size YoY Growth (2016-2027) & (US$ Million)
Figure 56. Middle East & Africa Disaster Recovery as a Service (DRaaS) Market Size YoY Growth (2016-2027) & (US$ Million)
Figure 57. Middle East & Africa Disaster Recovery as a Service (DRaaS) Market Share by Type (2016-2027)
Figure 58. Middle East & Africa Disaster Recovery as a Service (DRaaS) Market Share by Application (2016-2027)
Figure 59. Middle East & Africa Disaster Recovery as a Service (DRaaS) Market Share by Country (2016-2027)
Figure 60. Turkey Disaster Recovery as a Service (DRaaS) Market Size YoY Growth (2016-2027) & (US$ Million)
Figure 61. Saudi Arabia Disaster Recovery as a Service (DRaaS) Market Size YoY Growth (2016-2027) & (US$ Million)
Figure 62. UAE Disaster Recovery as a Service (DRaaS) Market Size YoY Growth (2016-2027) & (US$ Million)
Figure 63. IBM Revenue Growth Rate in Disaster Recovery as a Service (DRaaS) Business (2016-2021)
Figure 64. Microsoft Revenue Growth Rate in Disaster Recovery as a Service (DRaaS) Business (2016-2021)
Figure 65. SunGard Availability Services Revenue Growth Rate in Disaster Recovery as a Service (DRaaS) Business (2016-2021)
Figure 66. VMware Inc. Revenue Growth Rate in Disaster Recovery as a Service (DRaaS) Business (2016-2021)
Figure 67. Cable & Wireless Communications Revenue Growth Rate in Disaster Recovery as a Service (DRaaS) Business (2016-2021)
Figure 68. Amazon Web Services Revenue Growth Rate in Disaster Recovery as a Service (DRaaS) Business (2016-2021)
Figure 69. Iland Revenue Growth Rate in Disaster Recovery as a Service (DRaaS) Business (2016-2021)
Figure 70. Tierpoint Revenue Growth Rate in Disaster Recovery as a Service (DRaaS) Business (2016-2021)
Figure 71. Infrascale Revenue Growth Rate in Disaster Recovery as a Service (DRaaS) Business (2016-2021)
Figure 72. Bluelock Revenue Growth Rate in Disaster Recovery as a Service (DRaaS) Business (2016-2021)
Figure 73. Recovery Point Revenue Growth Rate in Disaster Recovery as a Service (DRaaS) Business (2016-2021)
Figure 74. NTT Communications Revenue Growth Rate in Disaster Recovery as a Service (DRaaS) Business (2016-2021)
Figure 75. Acronis Revenue Growth Rate in Disaster Recovery as a Service (DRaaS) Business (2016-2021)
Figure 76. Geminare Revenue Growth Rate in Disaster Recovery as a Service (DRaaS) Business (2016-2021)
Figure 77. Zetta, Inc. Revenue Growth Rate in Disaster Recovery as a Service (DRaaS) Business (2016-2021)
Figure 78. Asigra Revenue Growth Rate in Disaster Recovery as a Service (DRaaS) Business (2016-2021)
Figure 79. Veritas Revenue Growth Rate in Disaster Recovery as a Service (DRaaS) Business (2016-2021)
Figure 80. Quorum Revenue Growth Rate in Disaster Recovery as a Service (DRaaS) Business (2016-2021)
Figure 81. Bottom-up and Top-down Approaches for This Report
Figure 82. Data Triangulation
Figure 83. Key Executives Interviewed
$3900
$5850
$7800
HAVE A QUERY?
OUR CUSTOMER
SIMILAR REPORTS