0
U.S. (TOLL FREE)
+1 (315) 215-3225
Automative

0
U.S. (TOLL FREE)
+1 (315) 215-3225
Patient Engagement Solutions Market Size, Status and Forecast 2021-2026
Published Date: May 2020
|
Report Code: QYRE-Auto-14N2661
Home | Market Reports | Health
Global Patient Engagement Solutions Market Size Status and Forecast 2020 2026

Patient Engagement Solutions Market Size, Status and Forecast 2021-2026

Code: QYRE-Auto-14N2661
Report
May 2020
90 Pages
QYResearch
Region: Global, North America
DESCRIPTION
TABLE OF CONTENT
TABLES & FIGURES

Patient Engagement Solutions Market Statistics 2026

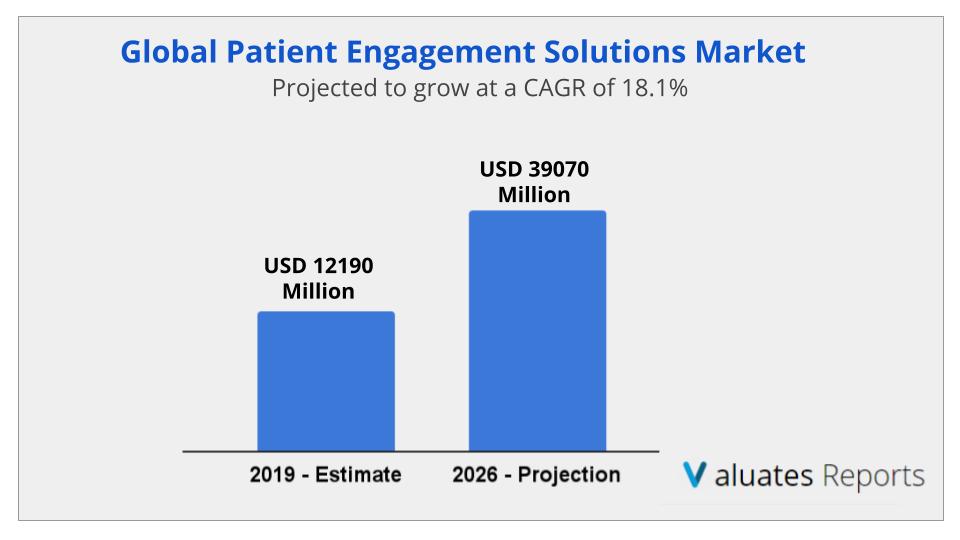
The global Patient Engagement Solutions market size is projected to reach US$ 39070 million by 2026, from US$ 12190 million in 2019, at a CAGR of 18.1% during 2021-2026. Patient engagement solutions enable healthcare providers to make better decisions regarding a patient’s health, by allowing collaboration with patients in the decision-making process. This improves the patient-provider relationship, and overall patient retention.
 
The report includes a country-wise and region-wise market size for the period 2015-2026. It also includes market size and forecast by each application segment in terms of revenue for the period 2015-2026.
 
Implementation of government regulations and initiatives to promote patient-centric care is expected to drive the patient engagement solution market size. Patient engagement is viewed as a key to improved health outcomes and lower healthcare costs by governments across regions. Patient engagement techniques that are well-designed can also improve the patient experience by allowing patients to become more active participants in their own care.
 
Patient engagement solutions enable providers to care for their patients remotely and mediate any small care needs, they can prevent their patients from falling seriously ill in the long run. Ultimately, this reduces the likelihood that patients will be faced with major healthcare costs. Furthermore, patient engagement help streamline operations and increase communication thereby reducing appointment cancellations and help generate more revenue for the care providers. This advantage is, in turn, expected to increase the growth of the patient engagement solution market.
 
Patient Engagement Solutions Market Size
 
 
In the last several years, global market of Patient Engagement Solutions developed rapidly, with an average growth rate of 18.1 %. In 2016, global revenue of Patient Engagement Solutions is nearly 6.1 billion USD. Major factors driving the patient engagement solutions market are legislative reforms of the Affordable Care Act (ACA) in the US, demand for improved quality of care, rise in aging population, and incentives by various governments for adoption of HCIT and patient engagement solutions.

Patient Engagement Solutions Market Segments

On the basis of delivery mode, the patient engagement solutions market is segmented into web-based, cloud-based, and on-premise solutions. The cloud-based solutions segment is expected to command the largest share of the global patient engagement solutions market in 2016 and the revenue market share in about 75%. However, the market for cloud-based solutions is expected to witness the highest growth rate, owing to the higher flexibility, scalability, and affordability offered by these solutions.

Patient Engagement Solutions Market Data by Type

  • Web-based
  • Cloud-based
  • On-premise
On the basis of applications, the market is segmented into health management, social and behavioral management, home health management, and financial management. The health management segment is expected to command the largest share of the global patient engagement solutions market in 2016 and the market share is about 47.5%.

Patient Engagement Solutions Market Data by Application

  • Health Management
  • Social and Behavioral Management
  • Home Health Management
  • Financial Health Management

Patient Engagement Solutions Market: Regional and Country-Level Analysis

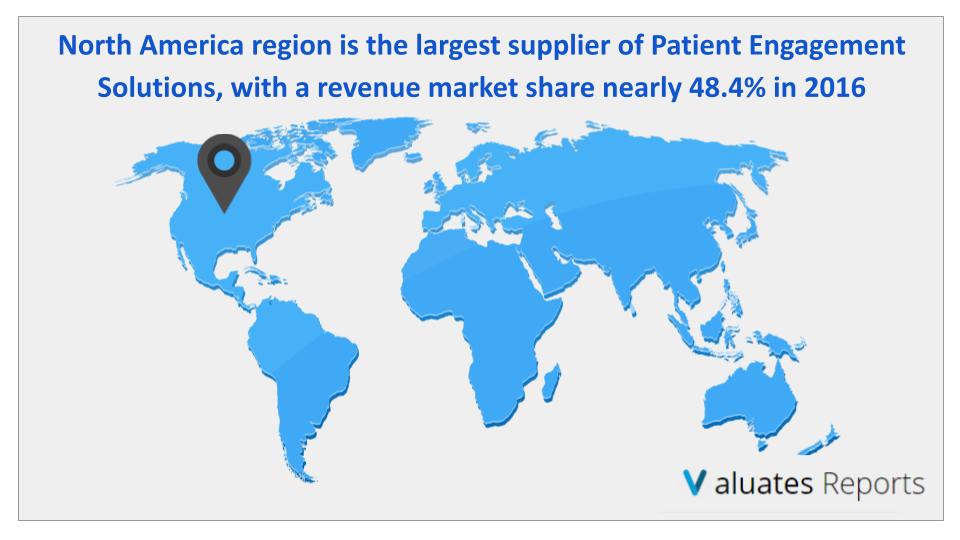
North America region is the largest supplier of Patient Engagement Solutions, with a revenue market share of nearly 48.4% in 2016. Europe is the second-largest supplier of Patient Engagement Solutions, enjoying a revenue market share of nearly 30.1% in 2016.
 
Patient Engagement Solutions Market Share
 
North America is the largest sales place, with a sales market share of nearly 42.1% in 2016. Following North America, Europe is the second-largest sales place with a sales market share of 33.5%.
 
The report offers an exhaustive geographical analysis of the global Patient Engagement Solutions market, covering important regions, viz, North America, Europe, China, Japan, Southeast Asia, India and Central & South America. It also covers key countries (regions), viz, U.S., Canada, Germany, France, U.K., Italy, Russia, China, Japan, South Korea, India, Australia, Taiwan, Indonesia, Thailand, Malaysia, Philippines, Vietnam, Mexico, Brazil, Turkey, Saudi Arabia, UAE, etc.

Patient Engagement Solutions Market: Competition Analysis

Market competition is intense. Cerner Corporation, IBM, Epic Systems, McKesson Corporation, etc. are the leaders of the industry. They hold the key technologies and patents, with high-end customers. They have formed global market channel of the industry. However, with the future expanding market, there will be more manufacturers in the future.
 
In the competitive analysis section of the report, leading as well as prominent players of the global Patient Engagement Solutions market are broadly studied on the basis of key factors. The report offers comprehensive analysis and accurate statistics on revenue by the player for the period 2015-2020. It also offers detailed analysis supported by reliable statistics on price and revenue (global level) by player for the period 2015-2020.
 
On the whole, the report proves to be an effective tool that players can use to gain a competitive edge over their competitors and ensure lasting success in the global Patient Engagement Solutions market. All of the findings, data, and information provided in the report are validated and revalidated with the help of trustworthy sources. The analysts who have authored the report took a unique and industry-best research and analysis approach for an in-depth study of the global Patient Engagement Solutions market.

Major Players in the Patient Engagement Solutions Market Report

  • Cerner Corporation
  • IBM
  • Epic Systems
  • McKesson Corporation
  • Medecision
  • Athenahealth
  • Healthagen
  • Allscripts
  • GetWell Network
  • Lincor Solutions
  • Orion Health
  • Others
1 Report Overview
1.1 Study Scope
1.2 Key Market Segments
1.3 Players Covered: Ranking by Patient Engagement Solutions Revenue
1.4 Market Analysis by Type
1.4.1 Global Patient Engagement Solutions Market Size Growth Rate by Type: 2020 VS 2026
1.4.2 Web-based
1.4.3 Cloud-based
1.4.4 On-premise
1.5 Market by Application
1.5.1 Global Patient Engagement Solutions Market Share by Application: 2020 VS 2026
1.5.2 Health Management
1.5.3 Social and Behavioral Management
1.5.4 Home Health Management
1.5.5 Financial Health Management
1.6 Coronavirus Disease 2019 (Covid-19): Patient Engagement Solutions Industry Impact
1.6.1 How the Covid-19 is Affecting the Patient Engagement Solutions Industry
1.6.1.1 Patient Engagement Solutions Business Impact Assessment - Covid-19
1.6.1.2 Supply Chain Challenges
1.6.1.3 COVID-19’s Impact On Crude Oil and Refined Products
1.6.2 Market Trends and Patient Engagement Solutions Potential Opportunities in the COVID-19 Landscape
1.6.3 Measures / Proposal against Covid-19
1.6.3.1 Government Measures to Combat Covid-19 Impact
1.6.3.2 Proposal for Patient Engagement Solutions Players to Combat Covid-19 Impact
1.7 Study Objectives
1.8 Years Considered
2 Global Growth Trends by Regions
2.1 Patient Engagement Solutions Market Perspective (2015-2026)
2.2 Patient Engagement Solutions Growth Trends by Regions
2.2.1 Patient Engagement Solutions Market Size by Regions: 2015 VS 2020 VS 2026
2.2.2 Patient Engagement Solutions Historic Market Share by Regions (2015-2020)
2.2.3 Patient Engagement Solutions Forecasted Market Size by Regions (2021-2026)
2.3 Industry Trends and Growth Strategy
2.3.1 Market Top Trends
2.3.2 Market Drivers
2.3.3 Market Challenges
2.3.4 Porter’s Five Forces Analysis
2.3.5 Patient Engagement Solutions Market Growth Strategy
2.3.6 Primary Interviews with Key Patient Engagement Solutions Players (Opinion Leaders)
3 Competition Landscape by Key Players
3.1 Global Top Patient Engagement Solutions Players by Market Size
3.1.1 Global Top Patient Engagement Solutions Players by Revenue (2015-2020)
3.1.2 Global Patient Engagement Solutions Revenue Market Share by Players (2015-2020)
3.1.3 Global Patient Engagement Solutions Market Share by Company Type (Tier 1, Tier 2 and Tier 3)
3.2 Global Patient Engagement Solutions Market Concentration Ratio
3.2.1 Global Patient Engagement Solutions Market Concentration Ratio (CR5 and HHI)
3.2.2 Global Top 10 and Top 5 Companies by Patient Engagement Solutions Revenue in 2019
3.3 Patient Engagement Solutions Key Players Head office and Area Served
3.4 Key Players Patient Engagement Solutions Product Solution and Service
3.5 Date of Enter into Patient Engagement Solutions Market
3.6 Mergers & Acquisitions, Expansion Plans
4 Breakdown Data by Type (2015-2026)
4.1 Global Patient Engagement Solutions Historic Market Size by Type (2015-2020)
4.2 Global Patient Engagement Solutions Forecasted Market Size by Type (2021-2026)
5 Patient Engagement Solutions Breakdown Data by Application (2015-2026)
5.1 Global Patient Engagement Solutions Market Size by Application (2015-2020)
5.2 Global Patient Engagement Solutions Forecasted Market Size by Application (2021-2026)
6 North America
6.1 North America Patient Engagement Solutions Market Size (2015-2020)
6.2 Patient Engagement Solutions Key Players in North America (2019-2020)
6.3 North America Patient Engagement Solutions Market Size by Type (2015-2020)
6.4 North America Patient Engagement Solutions Market Size by Application (2015-2020)
7 Europe
7.1 Europe Patient Engagement Solutions Market Size (2015-2020)
7.2 Patient Engagement Solutions Key Players in Europe (2019-2020)
7.3 Europe Patient Engagement Solutions Market Size by Type (2015-2020)
7.4 Europe Patient Engagement Solutions Market Size by Application (2015-2020)
8 China
8.1 China Patient Engagement Solutions Market Size (2015-2020)
8.2 Patient Engagement Solutions Key Players in China (2019-2020)
8.3 China Patient Engagement Solutions Market Size by Type (2015-2020)
8.4 China Patient Engagement Solutions Market Size by Application (2015-2020)
9 Japan
9.1 Japan Patient Engagement Solutions Market Size (2015-2020)
9.2 Patient Engagement Solutions Key Players in Japan (2019-2020)
9.3 Japan Patient Engagement Solutions Market Size by Type (2015-2020)
9.4 Japan Patient Engagement Solutions Market Size by Application (2015-2020)
10 Southeast Asia
10.1 Southeast Asia Patient Engagement Solutions Market Size (2015-2020)
10.2 Patient Engagement Solutions Key Players in Southeast Asia (2019-2020)
10.3 Southeast Asia Patient Engagement Solutions Market Size by Type (2015-2020)
10.4 Southeast Asia Patient Engagement Solutions Market Size by Application (2015-2020)
11 India
11.1 India Patient Engagement Solutions Market Size (2015-2020)
11.2 Patient Engagement Solutions Key Players in India (2019-2020)
11.3 India Patient Engagement Solutions Market Size by Type (2015-2020)
11.4 India Patient Engagement Solutions Market Size by Application (2015-2020)
12 Central & South America
12.1 Central & South America Patient Engagement Solutions Market Size (2015-2020)
12.2 Patient Engagement Solutions Key Players in Central & South America (2019-2020)
12.3 Central & South America Patient Engagement Solutions Market Size by Type (2015-2020)
12.4 Central & South America Patient Engagement Solutions Market Size by Application (2015-2020)
13 Key Players Profiles
13.1 Cerner Corporation
13.1.1 Cerner Corporation Company Details
13.1.2 Cerner Corporation Business Overview and Its Total Revenue
13.1.3 Cerner Corporation Patient Engagement Solutions Introduction
13.1.4 Cerner Corporation Revenue in Patient Engagement Solutions Business (2015-2020))
13.1.5 Cerner Corporation Recent Development
13.2 IBM
13.2.1 IBM Company Details
13.2.2 IBM Business Overview and Its Total Revenue
13.2.3 IBM Patient Engagement Solutions Introduction
13.2.4 IBM Revenue in Patient Engagement Solutions Business (2015-2020)
13.2.5 IBM Recent Development
13.3 Epic Systems
13.3.1 Epic Systems Company Details
13.3.2 Epic Systems Business Overview and Its Total Revenue
13.3.3 Epic Systems Patient Engagement Solutions Introduction
13.3.4 Epic Systems Revenue in Patient Engagement Solutions Business (2015-2020)
13.3.5 Epic Systems Recent Development
13.4 McKesson Corporation
13.4.1 McKesson Corporation Company Details
13.4.2 McKesson Corporation Business Overview and Its Total Revenue
13.4.3 McKesson Corporation Patient Engagement Solutions Introduction
13.4.4 McKesson Corporation Revenue in Patient Engagement Solutions Business (2015-2020)
13.4.5 McKesson Corporation Recent Development
13.5 Medecision
13.5.1 Medecision Company Details
13.5.2 Medecision Business Overview and Its Total Revenue
13.5.3 Medecision Patient Engagement Solutions Introduction
13.5.4 Medecision Revenue in Patient Engagement Solutions Business (2015-2020)
13.5.5 Medecision Recent Development
13.6 Athenahealth
13.6.1 Athenahealth Company Details
13.6.2 Athenahealth Business Overview and Its Total Revenue
13.6.3 Athenahealth Patient Engagement Solutions Introduction
13.6.4 Athenahealth Revenue in Patient Engagement Solutions Business (2015-2020)
13.6.5 Athenahealth Recent Development
13.7 Healthagen
13.7.1 Healthagen Company Details
13.7.2 Healthagen Business Overview and Its Total Revenue
13.7.3 Healthagen Patient Engagement Solutions Introduction
13.7.4 Healthagen Revenue in Patient Engagement Solutions Business (2015-2020)
13.7.5 Healthagen Recent Development
13.8 Allscripts
13.8.1 Allscripts Company Details
13.8.2 Allscripts Business Overview and Its Total Revenue
13.8.3 Allscripts Patient Engagement Solutions Introduction
13.8.4 Allscripts Revenue in Patient Engagement Solutions Business (2015-2020)
13.8.5 Allscripts Recent Development
13.9 GetWell Network
13.9.1 GetWell Network Company Details
13.9.2 GetWell Network Business Overview and Its Total Revenue
13.9.3 GetWell Network Patient Engagement Solutions Introduction
13.9.4 GetWell Network Revenue in Patient Engagement Solutions Business (2015-2020)
13.9.5 GetWell Network Recent Development
13.10 Lincor Solutions
13.10.1 Lincor Solutions Company Details
13.10.2 Lincor Solutions Business Overview and Its Total Revenue
13.10.3 Lincor Solutions Patient Engagement Solutions Introduction
13.10.4 Lincor Solutions Revenue in Patient Engagement Solutions Business (2015-2020)
13.10.5 Lincor Solutions Recent Development
13.11 Orion Health
10.11.1 Orion Health Company Details
10.11.2 Orion Health Business Overview and Its Total Revenue
10.11.3 Orion Health Patient Engagement Solutions Introduction
10.11.4 Orion Health Revenue in Patient Engagement Solutions Business (2015-2020)
10.11.5 Orion Health Recent Development
14 Analyst's Viewpoints/Conclusions
15 Appendix
15.1 Research Methodology
15.1.1 Methodology/Research Approach
15.1.2 Data Source
15.2 Disclaimer
15.3 Author Details
List of Tables
    Table 1. Patient Engagement Solutions Key Market Segments
    Table 2. Key Players Covered: Ranking by Patient Engagement Solutions Revenue
    Table 3. Ranking of Global Top Patient Engagement Solutions Manufacturers by Revenue (US$ Million) in 2019
    Table 4. Global Patient Engagement Solutions Market Size Growth Rate by Type (US$ Million): 2020 VS 2026
    Table 5. Key Players of Web-based
    Table 6. Key Players of Cloud-based
    Table 7. Key Players of On-premise
    Table 8. COVID-19 Impact Global Market: (Four Patient Engagement Solutions Market Size Forecast Scenarios)
    Table 9. Opportunities and Trends for Patient Engagement Solutions Players in the COVID-19 Landscape
    Table 10. Present Opportunities in China & Elsewhere Due to the Coronavirus Crisis
    Table 11. Key Regions/Countries Measures against Covid-19 Impact
    Table 12. Proposal for Patient Engagement Solutions Players to Combat Covid-19 Impact
    Table 13. Global Patient Engagement Solutions Market Size Growth by Application (US$ Million): 2020 VS 2026
    Table 14. Global Patient Engagement Solutions Market Size by Regions (US$ Million): 2020 VS 2026
    Table 15. Global Patient Engagement Solutions Market Size by Regions (2015-2020) (US$ Million)
    Table 16. Global Patient Engagement Solutions Market Share by Regions (2015-2020)
    Table 17. Global Patient Engagement Solutions Forecasted Market Size by Regions (2021-2026) (US$ Million)
    Table 18. Global Patient Engagement Solutions Market Share by Regions (2021-2026)
    Table 19. Market Top Trends
    Table 20. Key Drivers: Impact Analysis
    Table 21. Key Challenges
    Table 22. Patient Engagement Solutions Market Growth Strategy
    Table 23. Main Points Interviewed from Key Patient Engagement Solutions Players
    Table 24. Global Patient Engagement Solutions Revenue by Players (2015-2020) (Million US$)
    Table 25. Global Patient Engagement Solutions Market Share by Players (2015-2020)
    Table 26. Global Top Patient Engagement Solutions Players by Company Type (Tier 1, Tier 2 and Tier 3) (based on the Revenue in Patient Engagement Solutions as of 2019)
    Table 27. Global Patient Engagement Solutions by Players Market Concentration Ratio (CR5 and HHI)
    Table 28. Key Players Headquarters and Area Served
    Table 29. Key Players Patient Engagement Solutions Product Solution and Service
    Table 30. Date of Enter into Patient Engagement Solutions Market
    Table 31. Mergers & Acquisitions, Expansion Plans
    Table 32. Global Patient Engagement Solutions Market Size by Type (2015-2020) (Million US$)
    Table 33. Global Patient Engagement Solutions Market Size Share by Type (2015-2020)
    Table 34. Global Patient Engagement Solutions Revenue Market Share by Type (2021-2026)
    Table 35. Global Patient Engagement Solutions Market Size Share by Application (2015-2020)
    Table 36. Global Patient Engagement Solutions Market Size by Application (2015-2020) (Million US$)
    Table 37. Global Patient Engagement Solutions Market Size Share by Application (2021-2026)
    Table 38. North America Key Players Patient Engagement Solutions Revenue (2019-2020) (Million US$)
    Table 39. North America Key Players Patient Engagement Solutions Market Share (2019-2020)
    Table 40. North America Patient Engagement Solutions Market Size by Type (2015-2020) (Million US$)
    Table 41. North America Patient Engagement Solutions Market Share by Type (2015-2020)
    Table 42. North America Patient Engagement Solutions Market Size by Application (2015-2020) (Million US$)
    Table 43. North America Patient Engagement Solutions Market Share by Application (2015-2020)
    Table 44. Europe Key Players Patient Engagement Solutions Revenue (2019-2020) (Million US$)
    Table 45. Europe Key Players Patient Engagement Solutions Market Share (2019-2020)
    Table 46. Europe Patient Engagement Solutions Market Size by Type (2015-2020) (Million US$)
    Table 47. Europe Patient Engagement Solutions Market Share by Type (2015-2020)
    Table 48. Europe Patient Engagement Solutions Market Size by Application (2015-2020) (Million US$)
    Table 49. Europe Patient Engagement Solutions Market Share by Application (2015-2020)
    Table 50. China Key Players Patient Engagement Solutions Revenue (2019-2020) (Million US$)
    Table 51. China Key Players Patient Engagement Solutions Market Share (2019-2020)
    Table 52. China Patient Engagement Solutions Market Size by Type (2015-2020) (Million US$)
    Table 53. China Patient Engagement Solutions Market Share by Type (2015-2020)
    Table 54. China Patient Engagement Solutions Market Size by Application (2015-2020) (Million US$)
    Table 55. China Patient Engagement Solutions Market Share by Application (2015-2020)
    Table 56. Japan Key Players Patient Engagement Solutions Revenue (2019-2020) (Million US$)
    Table 57. Japan Key Players Patient Engagement Solutions Market Share (2019-2020)
    Table 58. Japan Patient Engagement Solutions Market Size by Type (2015-2020) (Million US$)
    Table 59. Japan Patient Engagement Solutions Market Share by Type (2015-2020)
    Table 60. Japan Patient Engagement Solutions Market Size by Application (2015-2020) (Million US$)
    Table 61. Japan Patient Engagement Solutions Market Share by Application (2015-2020)
    Table 62. Southeast Asia Key Players Patient Engagement Solutions Revenue (2019-2020) (Million US$)
    Table 63. Southeast Asia Key Players Patient Engagement Solutions Market Share (2019-2020)
    Table 64. Southeast Asia Patient Engagement Solutions Market Size by Type (2015-2020) (Million US$)
    Table 65. Southeast Asia Patient Engagement Solutions Market Share by Type (2015-2020)
    Table 66. Southeast Asia Patient Engagement Solutions Market Size by Application (2015-2020) (Million US$)
    Table 67. Southeast Asia Patient Engagement Solutions Market Share by Application (2015-2020)
    Table 68. India Key Players Patient Engagement Solutions Revenue (2019-2020) (Million US$)
    Table 69. India Key Players Patient Engagement Solutions Market Share (2019-2020)
    Table 70. India Patient Engagement Solutions Market Size by Type (2015-2020) (Million US$)
    Table 71. India Patient Engagement Solutions Market Share by Type (2015-2020)
    Table 72. India Patient Engagement Solutions Market Size by Application (2015-2020) (Million US$)
    Table 73. India Patient Engagement Solutions Market Share by Application (2015-2020)
    Table 74. Central & South America Key Players Patient Engagement Solutions Revenue (2019-2020) (Million US$)
    Table 75. Central & South America Key Players Patient Engagement Solutions Market Share (2019-2020)
    Table 76. Central & South America Patient Engagement Solutions Market Size by Type (2015-2020) (Million US$)
    Table 77. Central & South America Patient Engagement Solutions Market Share by Type (2015-2020)
    Table 78. Central & South America Patient Engagement Solutions Market Size by Application (2015-2020) (Million US$)
    Table 79. Central & South America Patient Engagement Solutions Market Share by Application (2015-2020)
    Table 80. Cerner Corporation Company Details
    Table 81. Cerner Corporation Business Overview
    Table 82. Cerner Corporation Product
    Table 83. Cerner Corporation Revenue in Patient Engagement Solutions Business (2015-2020) (Million US$)
    Table 84. Cerner Corporation Recent Development
    Table 85. IBM Company Details
    Table 86. IBM Business Overview
    Table 87. IBM Product
    Table 88. IBM Revenue in Patient Engagement Solutions Business (2015-2020) (Million US$)
    Table 89. IBM Recent Development
    Table 90. Epic Systems Company Details
    Table 91. Epic Systems Business Overview
    Table 92. Epic Systems Product
    Table 93. Epic Systems Revenue in Patient Engagement Solutions Business (2015-2020) (Million US$)
    Table 94. Epic Systems Recent Development
    Table 95. McKesson Corporation Company Details
    Table 96. McKesson Corporation Business Overview
    Table 97. McKesson Corporation Product
    Table 98. McKesson Corporation Revenue in Patient Engagement Solutions Business (2015-2020) (Million US$)
    Table 99. McKesson Corporation Recent Development
    Table 100. Medecision Company Details
    Table 101. Medecision Business Overview
    Table 102. Medecision Product
    Table 103. Medecision Revenue in Patient Engagement Solutions Business (2015-2020) (Million US$)
    Table 104. Medecision Recent Development
    Table 105. Athenahealth Company Details
    Table 106. Athenahealth Business Overview
    Table 107. Athenahealth Product
    Table 108. Athenahealth Revenue in Patient Engagement Solutions Business (2015-2020) (Million US$)
    Table 109. Athenahealth Recent Development
    Table 110. Healthagen Company Details
    Table 111. Healthagen Business Overview
    Table 112. Healthagen Product
    Table 113. Healthagen Revenue in Patient Engagement Solutions Business (2015-2020) (Million US$)
    Table 114. Healthagen Recent Development
    Table 115. Allscripts Business Overview
    Table 116. Allscripts Product
    Table 117. Allscripts Company Details
    Table 118. Allscripts Revenue in Patient Engagement Solutions Business (2015-2020) (Million US$)
    Table 119. Allscripts Recent Development
    Table 120. GetWell Network Company Details
    Table 121. GetWell Network Business Overview
    Table 122. GetWell Network Product
    Table 123. GetWell Network Revenue in Patient Engagement Solutions Business (2015-2020) (Million US$)
    Table 124. GetWell Network Recent Development
    Table 125. Lincor Solutions Company Details
    Table 126. Lincor Solutions Business Overview
    Table 127. Lincor Solutions Product
    Table 128. Lincor Solutions Revenue in Patient Engagement Solutions Business (2015-2020) (Million US$)
    Table 129. Lincor Solutions Recent Development
    Table 130. Orion Health Company Details
    Table 131. Orion Health Business Overview
    Table 132. Orion Health Product
    Table 133. Orion Health Revenue in Patient Engagement Solutions Business (2015-2020) (Million US$)
    Table 134. Orion Health Recent Development
    Table 135. Research Programs/Design for This Report
    Table 136. Key Data Information from Secondary Sources
    Table 137. Key Data Information from Primary Sources
List of Figures
    Figure 1. Global Patient Engagement Solutions Market Share by Type: 2020 VS 2026
    Figure 2. Web-based Features
    Figure 3. Cloud-based Features
    Figure 4. On-premise Features
    Figure 5. Global Patient Engagement Solutions Market Share by Application: 2020 VS 2026
    Figure 6. Health Management Case Studies
    Figure 7. Social and Behavioral Management Case Studies
    Figure 8. Home Health Management Case Studies
    Figure 9. Financial Health Management Case Studies
    Figure 10. Patient Engagement Solutions Report Years Considered
    Figure 11. Global Patient Engagement Solutions Market Size YoY Growth 2015-2026 (US$ Million)
    Figure 12. Global Patient Engagement Solutions Market Share by Regions: 2020 VS 2026
    Figure 13. Global Patient Engagement Solutions Market Share by Regions (2021-2026)
    Figure 14. Porter's Five Forces Analysis
    Figure 15. Global Patient Engagement Solutions Market Share by Players in 2019
    Figure 16. Global Top Patient Engagement Solutions Players by Company Type (Tier 1, Tier 2 and Tier 3) (based on the Revenue in Patient Engagement Solutions as of 2019
    Figure 17. The Top 10 and 5 Players Market Share by Patient Engagement Solutions Revenue in 2019
    Figure 18. North America Patient Engagement Solutions Market Size YoY Growth (2015-2020) (Million US$)
    Figure 19. Europe Patient Engagement Solutions Market Size YoY Growth (2015-2020) (Million US$)
    Figure 20. China Patient Engagement Solutions Market Size YoY Growth (2015-2020) (Million US$)
    Figure 21. Japan Patient Engagement Solutions Market Size YoY Growth (2015-2020) (Million US$)
    Figure 22. Southeast Asia Patient Engagement Solutions Market Size YoY Growth (2015-2020) (Million US$)
    Figure 23. India Patient Engagement Solutions Market Size YoY Growth (2015-2020) (Million US$)
    Figure 24. Central & South America Patient Engagement Solutions Market Size YoY Growth (2015-2020) (Million US$)
    Figure 25. Cerner Corporation Total Revenue (US$ Million): 2019 Compared with 2018
    Figure 26. Cerner Corporation Revenue Growth Rate in Patient Engagement Solutions Business (2015-2020)
    Figure 27. IBM Total Revenue (US$ Million): 2019 Compared with 2018
    Figure 28. IBM Revenue Growth Rate in Patient Engagement Solutions Business (2015-2020)
    Figure 29. Epic Systems Total Revenue (US$ Million): 2019 Compared with 2018
    Figure 30. Epic Systems Revenue Growth Rate in Patient Engagement Solutions Business (2015-2020)
    Figure 31. McKesson Corporation Total Revenue (US$ Million): 2019 Compared with 2018
    Figure 32. McKesson Corporation Revenue Growth Rate in Patient Engagement Solutions Business (2015-2020)
    Figure 33. Medecision Total Revenue (US$ Million): 2019 Compared with 2018
    Figure 34. Medecision Revenue Growth Rate in Patient Engagement Solutions Business (2015-2020)
    Figure 35. Athenahealth Total Revenue (US$ Million): 2019 Compared with 2018
    Figure 36. Athenahealth Revenue Growth Rate in Patient Engagement Solutions Business (2015-2020)
    Figure 37. Healthagen Total Revenue (US$ Million): 2019 Compared with 2018
    Figure 38. Healthagen Revenue Growth Rate in Patient Engagement Solutions Business (2015-2020)
    Figure 39. Allscripts Total Revenue (US$ Million): 2019 Compared with 2018
    Figure 40. Allscripts Revenue Growth Rate in Patient Engagement Solutions Business (2015-2020)
    Figure 41. GetWell Network Total Revenue (US$ Million): 2019 Compared with 2018
    Figure 42. GetWell Network Revenue Growth Rate in Patient Engagement Solutions Business (2015-2020)
    Figure 43. Lincor Solutions Total Revenue (US$ Million): 2019 Compared with 2018
    Figure 44. Lincor Solutions Revenue Growth Rate in Patient Engagement Solutions Business (2015-2020)
    Figure 45. Orion Health Total Revenue (US$ Million): 2019 Compared with 2018
    Figure 46. Orion Health Revenue Growth Rate in Patient Engagement Solutions Business (2015-2020)
    Figure 47. Bottom-up and Top-down Approaches for This Report
    Figure 48. Data Triangulation
    Figure 49. Key Executives Interviewed
SELECT A FORMAT
Added to Cart
Electronic (PDF)

$3900

This license allows only one user to access the PDF.
Electronic (PDF)

$5850

This license allows 1 - 5 user to access the PDF, license is suitable for small groups of 5 users working together
Electronic (PDF)

$7800

This license allows users/teams in a same Enterprise to use this report, various departments within an enterpise can use this report
Add to Cart
Buy Now (10% Discount)

OUR CUSTOMER

SecuX Technology Inc

SIMILAR REPORTS

RELATED REPORTS

Global Dental Root Canal File Market Insights, Forecast to 2029

120 Pages
Type: Report
Code: QYRE-Auto-14Y12293
Wed Sep 06 00:00:00 UTC 2023

Add to Cart

Global Swine Parvovirus Disease Vaccine Market Insights, Forecast to 2029

120 Pages
Type: Report
Code: QYRE-Auto-30N14925
Wed Sep 06 00:00:00 UTC 2023

Add to Cart

Global Anti–Oral Mucositis Drug Market Insights, Forecast to 2029

120 Pages
Type: Report
Code: QYRE-Auto-5V5924
Tue Sep 05 00:00:00 UTC 2023

Add to Cart

Global Zirconium Dioxide Dental Material Market Insights, Forecast to 2029

120 Pages
Type: Report
Code: QYRE-Auto-6A8446
Tue Sep 05 00:00:00 UTC 2023

Add to Cart