Table of Contents
1 Market Overview
1.1 Virtual Fitting Room Product Introduction
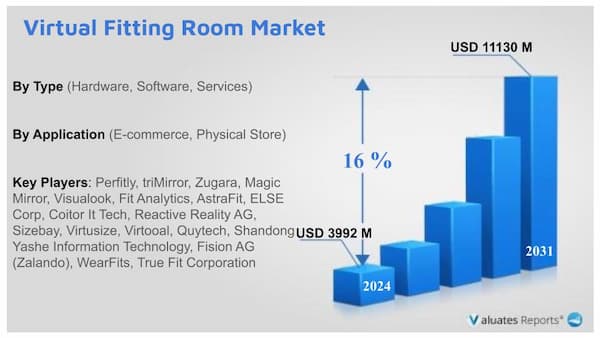
1.2 Global Virtual Fitting Room Market Size Forecast (2020-2031)
1.3 Virtual Fitting Room Market Trends & Drivers
1.3.1 Virtual Fitting Room Industry Trends
1.3.2 Virtual Fitting Room Market Drivers & Opportunity
1.3.3 Virtual Fitting Room Market Challenges
1.3.4 Virtual Fitting Room Market Restraints
1.4 Assumptions and Limitations
1.5 Study Objectives
1.6 Years Considered
2 Competitive Analysis by Company
2.1 Global Virtual Fitting Room Players Revenue Ranking (2024)
2.2 Global Virtual Fitting Room Revenue by Company (2020-2025)
2.3 Key Companies Virtual Fitting Room Manufacturing Base Distribution and Headquarters
2.4 Key Companies Virtual Fitting Room Product Offered
2.5 Key Companies Time to Begin Mass Production of Virtual Fitting Room
2.6 Virtual Fitting Room Market Competitive Analysis
2.6.1 Virtual Fitting Room Market Concentration Rate (2020-2025)
2.6.2 Global 5 and 10 Largest Companies by Virtual Fitting Room Revenue in 2024
2.6.3 Global Top Companies by Company Type (Tier 1, Tier 2, and Tier 3) & (based on the Revenue in Virtual Fitting Room as of 2024)
2.7 Mergers & Acquisitions, Expansion
3 Segmentation by Type
3.1 Introduction by Type
3.1.1 Hardware
3.1.2 Software
3.1.3 Services
3.2 Global Virtual Fitting Room Sales Value by Type
3.2.1 Global Virtual Fitting Room Sales Value by Type (2020 VS 2024 VS 2031)
3.2.2 Global Virtual Fitting Room Sales Value, by Type (2020-2031)
3.2.3 Global Virtual Fitting Room Sales Value, by Type (%) (2020-2031)
4 Segmentation by Application
4.1 Introduction by Application
4.1.1 E-commerce
4.1.2 Physical Store
4.2 Global Virtual Fitting Room Sales Value by Application
4.2.1 Global Virtual Fitting Room Sales Value by Application (2020 VS 2024 VS 2031)
4.2.2 Global Virtual Fitting Room Sales Value, by Application (2020-2031)
4.2.3 Global Virtual Fitting Room Sales Value, by Application (%) (2020-2031)
5 Segmentation by Region
5.1 Global Virtual Fitting Room Sales Value by Region
5.1.1 Global Virtual Fitting Room Sales Value by Region: 2020 VS 2024 VS 2031
5.1.2 Global Virtual Fitting Room Sales Value by Region (2020-2025)
5.1.3 Global Virtual Fitting Room Sales Value by Region (2026-2031)
5.1.4 Global Virtual Fitting Room Sales Value by Region (%), (2020-2031)
5.2 North America
5.2.1 North America Virtual Fitting Room Sales Value, 2020-2031
5.2.2 North America Virtual Fitting Room Sales Value by Country (%), 2024 VS 2031
5.3 Europe
5.3.1 Europe Virtual Fitting Room Sales Value, 2020-2031
5.3.2 Europe Virtual Fitting Room Sales Value by Country (%), 2024 VS 2031
5.4 Asia Pacific
5.4.1 Asia Pacific Virtual Fitting Room Sales Value, 2020-2031
5.4.2 Asia Pacific Virtual Fitting Room Sales Value by Region (%), 2024 VS 2031
5.5 South America
5.5.1 South America Virtual Fitting Room Sales Value, 2020-2031
5.5.2 South America Virtual Fitting Room Sales Value by Country (%), 2024 VS 2031
5.6 Middle East & Africa
5.6.1 Middle East & Africa Virtual Fitting Room Sales Value, 2020-2031
5.6.2 Middle East & Africa Virtual Fitting Room Sales Value by Country (%), 2024 VS 2031
6 Segmentation by Key Countries/Regions
6.1 Key Countries/Regions Virtual Fitting Room Sales Value Growth Trends, 2020 VS 2024 VS 2031
6.2 Key Countries/Regions Virtual Fitting Room Sales Value, 2020-2031
6.3 United States
6.3.1 United States Virtual Fitting Room Sales Value, 2020-2031
6.3.2 United States Virtual Fitting Room Sales Value by Type (%), 2024 VS 2031
6.3.3 United States Virtual Fitting Room Sales Value by Application, 2024 VS 2031
6.4 Europe
6.4.1 Europe Virtual Fitting Room Sales Value, 2020-2031
6.4.2 Europe Virtual Fitting Room Sales Value by Type (%), 2024 VS 2031
6.4.3 Europe Virtual Fitting Room Sales Value by Application, 2024 VS 2031
6.5 China
6.5.1 China Virtual Fitting Room Sales Value, 2020-2031
6.5.2 China Virtual Fitting Room Sales Value by Type (%), 2024 VS 2031
6.5.3 China Virtual Fitting Room Sales Value by Application, 2024 VS 2031
6.6 Japan
6.6.1 Japan Virtual Fitting Room Sales Value, 2020-2031
6.6.2 Japan Virtual Fitting Room Sales Value by Type (%), 2024 VS 2031
6.6.3 Japan Virtual Fitting Room Sales Value by Application, 2024 VS 2031
6.7 South Korea
6.7.1 South Korea Virtual Fitting Room Sales Value, 2020-2031
6.7.2 South Korea Virtual Fitting Room Sales Value by Type (%), 2024 VS 2031
6.7.3 South Korea Virtual Fitting Room Sales Value by Application, 2024 VS 2031
6.8 Southeast Asia
6.8.1 Southeast Asia Virtual Fitting Room Sales Value, 2020-2031
6.8.2 Southeast Asia Virtual Fitting Room Sales Value by Type (%), 2024 VS 2031
6.8.3 Southeast Asia Virtual Fitting Room Sales Value by Application, 2024 VS 2031
6.9 India
6.9.1 India Virtual Fitting Room Sales Value, 2020-2031
6.9.2 India Virtual Fitting Room Sales Value by Type (%), 2024 VS 2031
6.9.3 India Virtual Fitting Room Sales Value by Application, 2024 VS 2031
7 Company Profiles
7.1 Perfitly
7.1.1 Perfitly Profile
7.1.2 Perfitly Main Business
7.1.3 Perfitly Virtual Fitting Room Products, Services and Solutions
7.1.4 Perfitly Virtual Fitting Room Revenue (US$ Million) & (2020-2025)
7.1.5 Perfitly Recent Developments
7.2 triMirror
7.2.1 triMirror Profile
7.2.2 triMirror Main Business
7.2.3 triMirror Virtual Fitting Room Products, Services and Solutions
7.2.4 triMirror Virtual Fitting Room Revenue (US$ Million) & (2020-2025)
7.2.5 triMirror Recent Developments
7.3 Zugara
7.3.1 Zugara Profile
7.3.2 Zugara Main Business
7.3.3 Zugara Virtual Fitting Room Products, Services and Solutions
7.3.4 Zugara Virtual Fitting Room Revenue (US$ Million) & (2020-2025)
7.3.5 Zugara Recent Developments
7.4 Magic Mirror
7.4.1 Magic Mirror Profile
7.4.2 Magic Mirror Main Business
7.4.3 Magic Mirror Virtual Fitting Room Products, Services and Solutions
7.4.4 Magic Mirror Virtual Fitting Room Revenue (US$ Million) & (2020-2025)
7.4.5 Magic Mirror Recent Developments
7.5 Visualook
7.5.1 Visualook Profile
7.5.2 Visualook Main Business
7.5.3 Visualook Virtual Fitting Room Products, Services and Solutions
7.5.4 Visualook Virtual Fitting Room Revenue (US$ Million) & (2020-2025)
7.5.5 Visualook Recent Developments
7.6 Fit Analytics
7.6.1 Fit Analytics Profile
7.6.2 Fit Analytics Main Business
7.6.3 Fit Analytics Virtual Fitting Room Products, Services and Solutions
7.6.4 Fit Analytics Virtual Fitting Room Revenue (US$ Million) & (2020-2025)
7.6.5 Fit Analytics Recent Developments
7.7 AstraFit
7.7.1 AstraFit Profile
7.7.2 AstraFit Main Business
7.7.3 AstraFit Virtual Fitting Room Products, Services and Solutions
7.7.4 AstraFit Virtual Fitting Room Revenue (US$ Million) & (2020-2025)
7.7.5 AstraFit Recent Developments
7.8 ELSE Corp
7.8.1 ELSE Corp Profile
7.8.2 ELSE Corp Main Business
7.8.3 ELSE Corp Virtual Fitting Room Products, Services and Solutions
7.8.4 ELSE Corp Virtual Fitting Room Revenue (US$ Million) & (2020-2025)
7.8.5 ELSE Corp Recent Developments
7.9 Coitor It Tech
7.9.1 Coitor It Tech Profile
7.9.2 Coitor It Tech Main Business
7.9.3 Coitor It Tech Virtual Fitting Room Products, Services and Solutions
7.9.4 Coitor It Tech Virtual Fitting Room Revenue (US$ Million) & (2020-2025)
7.9.5 Coitor It Tech Recent Developments
7.10 Reactive Reality AG
7.10.1 Reactive Reality AG Profile
7.10.2 Reactive Reality AG Main Business
7.10.3 Reactive Reality AG Virtual Fitting Room Products, Services and Solutions
7.10.4 Reactive Reality AG Virtual Fitting Room Revenue (US$ Million) & (2020-2025)
7.10.5 Reactive Reality AG Recent Developments
7.11 Sizebay
7.11.1 Sizebay Profile
7.11.2 Sizebay Main Business
7.11.3 Sizebay Virtual Fitting Room Products, Services and Solutions
7.11.4 Sizebay Virtual Fitting Room Revenue (US$ Million) & (2020-2025)
7.11.5 Sizebay Recent Developments
7.12 Virtusize
7.12.1 Virtusize Profile
7.12.2 Virtusize Main Business
7.12.3 Virtusize Virtual Fitting Room Products, Services and Solutions
7.12.4 Virtusize Virtual Fitting Room Revenue (US$ Million) & (2020-2025)
7.12.5 Virtusize Recent Developments
7.13 Virtooal
7.13.1 Virtooal Profile
7.13.2 Virtooal Main Business
7.13.3 Virtooal Virtual Fitting Room Products, Services and Solutions
7.13.4 Virtooal Virtual Fitting Room Revenue (US$ Million) & (2020-2025)
7.13.5 Virtooal Recent Developments
7.14 Quytech
7.14.1 Quytech Profile
7.14.2 Quytech Main Business
7.14.3 Quytech Virtual Fitting Room Products, Services and Solutions
7.14.4 Quytech Virtual Fitting Room Revenue (US$ Million) & (2020-2025)
7.14.5 Quytech Recent Developments
7.15 Shandong Yashe Information Technology
7.15.1 Shandong Yashe Information Technology Profile
7.15.2 Shandong Yashe Information Technology Main Business
7.15.3 Shandong Yashe Information Technology Virtual Fitting Room Products, Services and Solutions
7.15.4 Shandong Yashe Information Technology Virtual Fitting Room Revenue (US$ Million) & (2020-2025)
7.15.5 Shandong Yashe Information Technology Recent Developments
7.16 Fision AG (Zalando)
7.16.1 Fision AG (Zalando) Profile
7.16.2 Fision AG (Zalando) Main Business
7.16.3 Fision AG (Zalando) Virtual Fitting Room Products, Services and Solutions
7.16.4 Fision AG (Zalando) Virtual Fitting Room Revenue (US$ Million) & (2020-2025)
7.16.5 Fision AG (Zalando) Recent Developments
7.17 WearFits
7.17.1 WearFits Profile
7.17.2 WearFits Main Business
7.17.3 WearFits Virtual Fitting Room Products, Services and Solutions
7.17.4 WearFits Virtual Fitting Room Revenue (US$ Million) & (2020-2025)
7.17.5 WearFits Recent Developments
7.18 True Fit Corporation
7.18.1 True Fit Corporation Profile
7.18.2 True Fit Corporation Main Business
7.18.3 True Fit Corporation Virtual Fitting Room Products, Services and Solutions
7.18.4 True Fit Corporation Virtual Fitting Room Revenue (US$ Million) & (2020-2025)
7.18.5 True Fit Corporation Recent Developments
8 Industry Chain Analysis
8.1 Virtual Fitting Room Industrial Chain
8.2 Virtual Fitting Room Upstream Analysis
8.2.1 Key Raw Materials
8.2.2 Raw Materials Key Suppliers
8.2.3 Manufacturing Cost Structure
8.3 Midstream Analysis
8.4 Downstream Analysis (Customers Analysis)
8.5 Sales Model and Sales Channels
8.5.1 Virtual Fitting Room Sales Model
8.5.2 Sales Channel
8.5.3 Virtual Fitting Room Distributors
9 Research Findings and Conclusion
10 Appendix
10.1 Research Methodology
10.1.1 Methodology/Research Approach
10.1.1.1 Research Programs/Design
10.1.1.2 Market Size Estimation
10.1.1.3 Market Breakdown and Data Triangulation
10.1.2 Data Source
10.1.2.1 Secondary Sources
10.1.2.2 Primary Sources
10.2 Author Details
10.3 Disclaimer
FEATURED COMPANIES
Perfitly
Trimirror
Zugara
Magic Mirror
Visualook
Fit Analytics
AstraFit
ELSE Corp
Coitor IT Tech
Reactive Reality AG
Sizebay
Virtusize AB
Virtooal
Quytech
Shandong Yashe Information Technology
Fision AG (Zalando)
WearFits
True Fit Corporation
Table of Figures
List of Tables
Table 1. Virtual Fitting Room Market Trends
Table 2. Virtual Fitting Room Market Drivers & Opportunity
Table 3. Virtual Fitting Room Market Challenges
Table 4. Virtual Fitting Room Market Restraints
Table 5. Global Virtual Fitting Room Revenue by Company (2020-2025) & (US$ Million)
Table 6. Global Virtual Fitting Room Revenue Market Share by Company (2020-2025)
Table 7. Key Companies Virtual Fitting Room Manufacturing Base Distribution and Headquarters
Table 8. Key Companies Virtual Fitting Room Product Type
Table 9. Key Companies Time to Begin Mass Production of Virtual Fitting Room
Table 10. Global Virtual Fitting Room Companies Market Concentration Ratio (CR5 and HHI)
Table 11. Global Top Companies Market Share by Company Type (Tier 1, Tier 2, and Tier 3) & (based on the Revenue in Virtual Fitting Room as of 2024)
Table 12. Mergers & Acquisitions, Expansion Plans
Table 13. Global Virtual Fitting Room Sales Value by Type: 2020 VS 2024 VS 2031 (US$ Million)
Table 14. Global Virtual Fitting Room Sales Value by Type (2020-2025) & (US$ Million)
Table 15. Global Virtual Fitting Room Sales Value by Type (2026-2031) & (US$ Million)
Table 16. Global Virtual Fitting Room Sales Market Share in Value by Type (2020-2025)
Table 17. Global Virtual Fitting Room Sales Market Share in Value by Type (2026-2031)
Table 18. Global Virtual Fitting Room Sales Value by Application: 2020 VS 2024 VS 2031 (US$ Million)
Table 19. Global Virtual Fitting Room Sales Value by Application (2020-2025) & (US$ Million)
Table 20. Global Virtual Fitting Room Sales Value by Application (2026-2031) & (US$ Million)
Table 21. Global Virtual Fitting Room Sales Market Share in Value by Application (2020-2025)
Table 22. Global Virtual Fitting Room Sales Market Share in Value by Application (2026-2031)
Table 23. Global Virtual Fitting Room Sales Value by Region, (2020 VS 2024 VS 2031) & (US$ Million)
Table 24. Global Virtual Fitting Room Sales Value by Region (2020-2025) & (US$ Million)
Table 25. Global Virtual Fitting Room Sales Value by Region (2026-2031) & (US$ Million)
Table 26. Global Virtual Fitting Room Sales Value by Region (2020-2025) & (%)
Table 27. Global Virtual Fitting Room Sales Value by Region (2026-2031) & (%)
Table 28. Key Countries/Regions Virtual Fitting Room Sales Value Growth Trends, (US$ Million): 2020 VS 2024 VS 2031
Table 29. Key Countries/Regions Virtual Fitting Room Sales Value, (2020-2025) & (US$ Million)
Table 30. Key Countries/Regions Virtual Fitting Room Sales Value, (2026-2031) & (US$ Million)
Table 31. Perfitly Basic Information List
Table 32. Perfitly Description and Business Overview
Table 33. Perfitly Virtual Fitting Room Products, Services and Solutions
Table 34. Revenue (US$ Million) in Virtual Fitting Room Business of Perfitly (2020-2025)
Table 35. Perfitly Recent Developments
Table 36. triMirror Basic Information List
Table 37. triMirror Description and Business Overview
Table 38. triMirror Virtual Fitting Room Products, Services and Solutions
Table 39. Revenue (US$ Million) in Virtual Fitting Room Business of triMirror (2020-2025)
Table 40. triMirror Recent Developments
Table 41. Zugara Basic Information List
Table 42. Zugara Description and Business Overview
Table 43. Zugara Virtual Fitting Room Products, Services and Solutions
Table 44. Revenue (US$ Million) in Virtual Fitting Room Business of Zugara (2020-2025)
Table 45. Zugara Recent Developments
Table 46. Magic Mirror Basic Information List
Table 47. Magic Mirror Description and Business Overview
Table 48. Magic Mirror Virtual Fitting Room Products, Services and Solutions
Table 49. Revenue (US$ Million) in Virtual Fitting Room Business of Magic Mirror (2020-2025)
Table 50. Magic Mirror Recent Developments
Table 51. Visualook Basic Information List
Table 52. Visualook Description and Business Overview
Table 53. Visualook Virtual Fitting Room Products, Services and Solutions
Table 54. Revenue (US$ Million) in Virtual Fitting Room Business of Visualook (2020-2025)
Table 55. Visualook Recent Developments
Table 56. Fit Analytics Basic Information List
Table 57. Fit Analytics Description and Business Overview
Table 58. Fit Analytics Virtual Fitting Room Products, Services and Solutions
Table 59. Revenue (US$ Million) in Virtual Fitting Room Business of Fit Analytics (2020-2025)
Table 60. Fit Analytics Recent Developments
Table 61. AstraFit Basic Information List
Table 62. AstraFit Description and Business Overview
Table 63. AstraFit Virtual Fitting Room Products, Services and Solutions
Table 64. Revenue (US$ Million) in Virtual Fitting Room Business of AstraFit (2020-2025)
Table 65. AstraFit Recent Developments
Table 66. ELSE Corp Basic Information List
Table 67. ELSE Corp Description and Business Overview
Table 68. ELSE Corp Virtual Fitting Room Products, Services and Solutions
Table 69. Revenue (US$ Million) in Virtual Fitting Room Business of ELSE Corp (2020-2025)
Table 70. ELSE Corp Recent Developments
Table 71. Coitor It Tech Basic Information List
Table 72. Coitor It Tech Description and Business Overview
Table 73. Coitor It Tech Virtual Fitting Room Products, Services and Solutions
Table 74. Revenue (US$ Million) in Virtual Fitting Room Business of Coitor It Tech (2020-2025)
Table 75. Coitor It Tech Recent Developments
Table 76. Reactive Reality AG Basic Information List
Table 77. Reactive Reality AG Description and Business Overview
Table 78. Reactive Reality AG Virtual Fitting Room Products, Services and Solutions
Table 79. Revenue (US$ Million) in Virtual Fitting Room Business of Reactive Reality AG (2020-2025)
Table 80. Reactive Reality AG Recent Developments
Table 81. Sizebay Basic Information List
Table 82. Sizebay Description and Business Overview
Table 83. Sizebay Virtual Fitting Room Products, Services and Solutions
Table 84. Revenue (US$ Million) in Virtual Fitting Room Business of Sizebay (2020-2025)
Table 85. Sizebay Recent Developments
Table 86. Virtusize Basic Information List
Table 87. Virtusize Description and Business Overview
Table 88. Virtusize Virtual Fitting Room Products, Services and Solutions
Table 89. Revenue (US$ Million) in Virtual Fitting Room Business of Virtusize (2020-2025)
Table 90. Virtusize Recent Developments
Table 91. Virtooal Basic Information List
Table 92. Virtooal Description and Business Overview
Table 93. Virtooal Virtual Fitting Room Products, Services and Solutions
Table 94. Revenue (US$ Million) in Virtual Fitting Room Business of Virtooal (2020-2025)
Table 95. Virtooal Recent Developments
Table 96. Quytech Basic Information List
Table 97. Quytech Description and Business Overview
Table 98. Quytech Virtual Fitting Room Products, Services and Solutions
Table 99. Revenue (US$ Million) in Virtual Fitting Room Business of Quytech (2020-2025)
Table 100. Quytech Recent Developments
Table 101. Shandong Yashe Information Technology Basic Information List
Table 102. Shandong Yashe Information Technology Description and Business Overview
Table 103. Shandong Yashe Information Technology Virtual Fitting Room Products, Services and Solutions
Table 104. Revenue (US$ Million) in Virtual Fitting Room Business of Shandong Yashe Information Technology (2020-2025)
Table 105. Shandong Yashe Information Technology Recent Developments
Table 106. Fision AG (Zalando) Basic Information List
Table 107. Fision AG (Zalando) Description and Business Overview
Table 108. Fision AG (Zalando) Virtual Fitting Room Products, Services and Solutions
Table 109. Revenue (US$ Million) in Virtual Fitting Room Business of Fision AG (Zalando) (2020-2025)
Table 110. Fision AG (Zalando) Recent Developments
Table 111. WearFits Basic Information List
Table 112. WearFits Description and Business Overview
Table 113. WearFits Virtual Fitting Room Products, Services and Solutions
Table 114. Revenue (US$ Million) in Virtual Fitting Room Business of WearFits (2020-2025)
Table 115. WearFits Recent Developments
Table 116. True Fit Corporation Basic Information List
Table 117. True Fit Corporation Description and Business Overview
Table 118. True Fit Corporation Virtual Fitting Room Products, Services and Solutions
Table 119. Revenue (US$ Million) in Virtual Fitting Room Business of True Fit Corporation (2020-2025)
Table 120. True Fit Corporation Recent Developments
Table 121. Key Raw Materials Lists
Table 122. Raw Materials Key Suppliers Lists
Table 123. Virtual Fitting Room Downstream Customers
Table 124. Virtual Fitting Room Distributors List
Table 125. Research Programs/Design for This Report
Table 126. Key Data Information from Secondary Sources
Table 127. Key Data Information from Primary Sources
Table 128. Business Unit and Senior & Team Lead Analysts
List of Figures
Figure 1. Virtual Fitting Room Product Picture
Figure 2. Global Virtual Fitting Room Sales Value, 2020 VS 2024 VS 2031 (US$ Million)
Figure 3. Global Virtual Fitting Room Sales Value (2020-2031) & (US$ Million)
Figure 4. Virtual Fitting Room Report Years Considered
Figure 5. Global Virtual Fitting Room Players Revenue Ranking (2024) & (US$ Million)
Figure 6. The 5 and 10 Largest Companies in the World: Market Share by Virtual Fitting Room Revenue in 2024
Figure 7. Virtual Fitting Room Market Share by Company Type (Tier 1, Tier 2, and Tier 3): 2020 VS 2024
Figure 8. Hardware Picture
Figure 9. Software Picture
Figure 10. Services Picture
Figure 11. Global Virtual Fitting Room Sales Value by Type (2020 VS 2024 VS 2031) & (US$ Million)
Figure 12. Global Virtual Fitting Room Sales Value Market Share by Type, 2024 & 2031
Figure 13. Product Picture of E-commerce
Figure 14. Product Picture of Physical Store
Figure 15. Global Virtual Fitting Room Sales Value by Application (2020 VS 2024 VS 2031) & (US$ Million)
Figure 16. Global Virtual Fitting Room Sales Value Market Share by Application, 2024 & 2031
Figure 17. North America Virtual Fitting Room Sales Value (2020-2031) & (US$ Million)
Figure 18. North America Virtual Fitting Room Sales Value by Country (%), 2024 VS 2031
Figure 19. Europe Virtual Fitting Room Sales Value, (2020-2031) & (US$ Million)
Figure 20. Europe Virtual Fitting Room Sales Value by Country (%), 2024 VS 2031
Figure 21. Asia Pacific Virtual Fitting Room Sales Value, (2020-2031) & (US$ Million)
Figure 22. Asia Pacific Virtual Fitting Room Sales Value by Region (%), 2024 VS 2031
Figure 23. South America Virtual Fitting Room Sales Value, (2020-2031) & (US$ Million)
Figure 24. South America Virtual Fitting Room Sales Value by Country (%), 2024 VS 2031
Figure 25. Middle East & Africa Virtual Fitting Room Sales Value, (2020-2031) & (US$ Million)
Figure 26. Middle East & Africa Virtual Fitting Room Sales Value by Country (%), 2024 VS 2031
Figure 27. Key Countries/Regions Virtual Fitting Room Sales Value (%), (2020-2031)
Figure 28. United States Virtual Fitting Room Sales Value, (2020-2031) & (US$ Million)
Figure 29. United States Virtual Fitting Room Sales Value by Type (%), 2024 VS 2031
Figure 30. United States Virtual Fitting Room Sales Value by Application (%), 2024 VS 2031
Figure 31. Europe Virtual Fitting Room Sales Value, (2020-2031) & (US$ Million)
Figure 32. Europe Virtual Fitting Room Sales Value by Type (%), 2024 VS 2031
Figure 33. Europe Virtual Fitting Room Sales Value by Application (%), 2024 VS 2031
Figure 34. China Virtual Fitting Room Sales Value, (2020-2031) & (US$ Million)
Figure 35. China Virtual Fitting Room Sales Value by Type (%), 2024 VS 2031
Figure 36. China Virtual Fitting Room Sales Value by Application (%), 2024 VS 2031
Figure 37. Japan Virtual Fitting Room Sales Value, (2020-2031) & (US$ Million)
Figure 38. Japan Virtual Fitting Room Sales Value by Type (%), 2024 VS 2031
Figure 39. Japan Virtual Fitting Room Sales Value by Application (%), 2024 VS 2031
Figure 40. South Korea Virtual Fitting Room Sales Value, (2020-2031) & (US$ Million)
Figure 41. South Korea Virtual Fitting Room Sales Value by Type (%), 2024 VS 2031
Figure 42. South Korea Virtual Fitting Room Sales Value by Application (%), 2024 VS 2031
Figure 43. Southeast Asia Virtual Fitting Room Sales Value, (2020-2031) & (US$ Million)
Figure 44. Southeast Asia Virtual Fitting Room Sales Value by Type (%), 2024 VS 2031
Figure 45. Southeast Asia Virtual Fitting Room Sales Value by Application (%), 2024 VS 2031
Figure 46. India Virtual Fitting Room Sales Value, (2020-2031) & (US$ Million)
Figure 47. India Virtual Fitting Room Sales Value by Type (%), 2024 VS 2031
Figure 48. India Virtual Fitting Room Sales Value by Application (%), 2024 VS 2031
Figure 49. Virtual Fitting Room Industrial Chain
Figure 50. Virtual Fitting Room Manufacturing Cost Structure
Figure 51. Channels of Distribution (Direct Sales, and Distribution)
Figure 52. Bottom-up and Top-down Approaches for This Report
Figure 53. Data Triangulation
Figure 54. Key Executives Interviewed