0
U.S. (TOLL FREE)
+1 (315) 215-3225
Automative

0
U.S. (TOLL FREE)
+1 (315) 215-3225
Global GaN Semiconductor Devices Market Research Report 2023
Published Date: February 2023
|
Report Code: QYRE-Auto-26Q7186
Home | Market Reports | Computers & Electronics| Electronics & Electrical| Electronic Components
Global GaN Semiconductor Devices Market Insights and Forecast to 2028

Global GaN Semiconductor Devices Market Research Report 2023

Code: QYRE-Auto-26Q7186
Report
February 2023
108 Pages
QYResearch
Region: Global
DESCRIPTION
TABLE OF CONTENT
TABLES & FIGURES

Global GaN Semiconductor Devices Market

The global GaN Semiconductor Devices market was valued at US$ 1011.1 million in 2022 and is anticipated to reach US$ 4490.5 million by 2029, witnessing a CAGR of 23.3% during the forecast period 2023-2029. The continual advancement of technologies within the GaN ecosystem and the suitability of GaN semiconductor devices for RF applications are two major factors driving the market growth for GaN Semiconductor Devices.

The market for GaN semiconductor devices is anticipated to be further impacted by applications in electric and hybrid cars, as well as by expansion in the communication and healthcare sectors. 

 
GaN Semiconductor Devices Market
 

GaN Semiconductor Devices Market Trends

GaN's ability to conduct electrons more than a billion times better than silicon while still being more easily made is already well-known. Since GaN devices are made using traditional silicon manufacturing techniques in the same factories that currently make traditional silicon semiconductors, the cost to produce a GaN device is inherently lower than the cost to produce a MOSFET device. Additionally, the resulting devices are much smaller for the same functional performance. GaN devices are always less expensive to produce than their silicon counterparts since each individual device is much smaller and can be produced in much greater quantities per wafer. As GaN technology develops, the cost gap gets even wider. This factor is expected to drive the growth of the GaN Semiconductor Devices market.

The RF semiconductor device sector, which has a huge demand, is the main driver of the GaN Semiconductor Devices market. Electronic devices must operate at a number of communication frequency ranges depending on the application in the RF sector, which is closely related to the communications sector. Due to their ability to create high-power amplification at incredibly high frequency ranges, GaN semiconductor devices have gained momentum in the market for RF power semiconductor devices. The development of monolithic microwave integrated circuits (MMICs) made of GaN has sped up the acceptance of GaN RF applications.

As EV and HEV technology develops, there is still lot of space for the GaN Semiconductor Devices market to expand. The rapidly growing market for EVs and HEVs offers promising growth opportunities for GaN power semiconductor devices as well as opto-semiconductor devices in the power and optoelectronic systems used in this application area. The electronic systems present in EVs and HEVs are expected to enhance demand for GaN semiconductor devices.

Because of its superior efficiency and lower power consumption, GaN is a silicon alternative whose demand and application have increased in the healthcare sector as well. As a result, the demand for gallium nitride semiconductor devices is anticipated to increase significantly. Hospital robots do delicate procedures using parts made of gallium nitride. This factor is expected to drive the growth of the GaN Semiconductor Devices market.

 
GaN Semiconductor Devices Market by product type

GaN Semiconductor Devices Market Share Analysis

Some of the top manufacturers of GaN semiconductor devices on a global scale include Toshiba, Wolfspeed, GaN Systems, Infineon Technologies, and others. The top five producers globally control over 88% of the market.

North America is the top region for GaN semiconductor devices, with a market share of about 45%.

More than 63% of all applications are related to consumer electronics. One of the end markets for GaN semiconductors that is expanding the fastest is the consumer electronics sector, and GaN opto-semiconductor devices considerably boost revenue in this sector. Consumer markets for laptops, displays, mobile devices, and other products are increasingly using GaN semiconductor devices, which is propelling revenue growth.

Key Segmentations

By Company

  • Toshiba
  • Wolfspeed
  • GaN Systems
  • Infineon Technologies
  • Efficient Power Conversion (EPC)
  • Mitsubishi Electric
  • STMicroelectronics
  • Transphorm
  • NexGen
  • ROHM Semiconductor
  • Sumitomo Electric Device Innovations Inc (SEDI)
  • Qorvo
  • MACOM
  • Renesas Electronics
  • Dynax Semiconductor
  • Jiangsu Corenergy Semiconductor
  • Ampleon
  • Innoscience
  • NXP Semiconductors

Segment by Type

  • GaN Power Devices (Schottky Diodes, Field Effect Transistors (FETs))
  • GaN RF Devices (Power Amplifier PA, Low Noise Amplifier LNA, RF Switch SWITCH, Monolithic Integrated Circuit MMIC)

Segment by Application

  • Consumer Electronics
  • Telecom & Datacom
  • Industrial Industry
  • Defence & Aerospace
  • Energy Industry
  • Automobile & Mobility
  • Others

Production by Region

  • North America
  • Europe
  • China
  • Japan

Consumption by Region

  • North America
  • United States
  • Canada
  • Europe
  • Germany
  • France
  • U.K.
  • Italy
  • Russia
  • Asia-Pacific
  • China
  • Japan
  • South Korea
  • Taiwan
  • Southeast Asia
  • India
  • Latin America
  • Mexico
  • Brazil

Core Chapters

  • Chapter 1: Introduces the report scope of the report, executive summary of different market segments (by region, by type, by application, etc), including the market size of each market segment, future development potential, and so on. It offers a high-level view of the current state of the market and its likely evolution in the short to mid-term, and long term.
  • Chapter 2: Detailed analysis of GaN Semiconductor Devices manufacturers competitive landscape, price, production and value market share, latest development plan, merger, and acquisition information, etc.
  • Chapter 3: Production/output, value of GaN Semiconductor Devices by region/country. It provides a quantitative analysis of the market size and development potential of each region in the next six years.
  • Chapter 4: Consumption of GaN Semiconductor Devices in regional level and country level. It provides a quantitative analysis of the market size and development potential of each region and its main countries and introduces the market development, future development prospects, market space, and production of each country in the world.
  • Chapter 5: Provides the analysis of various market segments by type, covering the market size and development potential of each market segment, to help readers find the blue ocean market in different market segments.
  • Chapter 6: Provides the analysis of various market segments by application, covering the market size and development potential of each market segment, to help readers find the blue ocean market in different downstream markets.
  • Chapter 7: Provides profiles of key players, introducing the basic situation of the key companies in the market in detail, including product production/output, value, price, gross margin, product introduction, recent development, etc.
  • Chapter 8: Analysis of industrial chain, including the upstream and downstream of the industry.
  • Chapter 9: Introduces the market dynamics, latest developments of the market, the driving factors and restrictive factors of the market, the challenges and risks faced by manufacturers in the industry, and the analysis of relevant policies in the industry.
  • Chapter 10: The main points and conclusions of the report.

Scope of the GaN Semiconductor Devices Market Report

Report Metric Details
Report Name GaN Semiconductor Devices Market
The market size in 2022 USD 1011.1 Million
The revenue forecast in 2029 USD 4490.5 Million
Growth Rate Compound Annual Growth Rate (CAGR) of 23.3% from 2023 to 2029
Market size available for years 2023-2029
Forecast units Value (USD)
Segments covered Type, Application and Region
Report coverage Revenue & volume forecast, company share, competitive landscape, growth factors, and trends
Geographic regions covered North America, Europe, Asia Pacific, Latin America, Middle East & Africa

Frequently Asked Questions About This Report

1. How Big is the GaN Semiconductor Devices Market?

Ans. The global GaN Semiconductor Devices market was valued at US$ 1011.1 million in 2022 and is anticipated to reach US$ 4490.5 million by 2029.

2. What is the GaN Semiconductor Devices Market Growth?

Ans. The global GaN Semiconductor Devices market is expected to grow at a compound annual growth rate of 23.3% from 2023 to 2029.

3. Who are the major key players of the GaN Semiconductor Devices Market?

Ans. Global key players of GaN semiconductor devices include Toshiba, Wolfspeed, GaN Systems, Infineon Technologies, etc. Global top five manufacturers hold a share over 88%. 

4. Which region has the major share for GaN Semiconductor Devices Market?

Ans.  North America is the largest producer of GaN semiconductor devices holds a share over 45%.

5. Which Application has the major share for GaN Semiconductor Devices Market?

Ans.  And in terms of application, the largest application is consumer electronics, with a share over 63%.

6. Which segment by product type has the major share for GaN Semiconductor Devices Market?

Ans.  GaN RF devices is the largest segment, with a share over 82%.

1 GaN Semiconductor Devices Market Overview
1.1 Product Definition
1.2 GaN Semiconductor Devices Segment by Type
1.2.1 Global GaN Semiconductor Devices Market Value Growth Rate Analysis by Type 2022 VS 2029
1.2.2 GaN Power Devices (Schottky Diodes, Field Effect Transistors (FETs))
1.2.3 GaN RF Devices (Power Amplifier PA, Low Noise Amplifier LNA, RF Switch SWITCH, Monolithic Integrated Circuit MMIC)
1.3 GaN Semiconductor Devices Segment by Application
1.3.1 Global GaN Semiconductor Devices Market Value Growth Rate Analysis by Application: 2022 VS 2029
1.3.2 Consumer Electronics
1.3.3 Telecom & Datacom
1.3.4 Industrial Industry
1.3.5 Defence & Aerospace
1.3.6 Energy Industry
1.3.7 Automobile & Mobility
1.3.8 Others
1.4 Global Market Growth Prospects
1.4.1 Global GaN Semiconductor Devices Production Value Estimates and Forecasts (2018-2029)
1.4.2 Global GaN Semiconductor Devices Production Capacity Estimates and Forecasts (2018-2029)
1.4.3 Global GaN Semiconductor Devices Production Estimates and Forecasts (2018-2029)
1.4.4 Global GaN Semiconductor Devices Market Average Price Estimates and Forecasts (2018-2029)
1.5 Assumptions and Limitations
2 Market Competition by Manufacturers
2.1 Global GaN Semiconductor Devices Production Market Share by Manufacturers (2018-2023)
2.2 Global GaN Semiconductor Devices Production Value Market Share by Manufacturers (2018-2023)
2.3 Global Key Players of GaN Semiconductor Devices, Industry Ranking, 2021 VS 2022 VS 2023
2.4 Global GaN Semiconductor Devices Market Share by Company Type (Tier 1, Tier 2 and Tier 3)
2.5 Global GaN Semiconductor Devices Average Price by Manufacturers (2018-2023)
2.6 Global Key Manufacturers of GaN Semiconductor Devices, Manufacturing Base Distribution and Headquarters
2.7 Global Key Manufacturers of GaN Semiconductor Devices, Product Offered and Application
2.8 Global Key Manufacturers of GaN Semiconductor Devices, Date of Enter into This Industry
2.9 GaN Semiconductor Devices Market Competitive Situation and Trends
2.9.1 GaN Semiconductor Devices Market Concentration Rate
2.9.2 Global 5 and 10 Largest GaN Semiconductor Devices Players Market Share by Revenue
2.10 Mergers & Acquisitions, Expansion
3 GaN Semiconductor Devices Production by Region
3.1 Global GaN Semiconductor Devices Production Value Estimates and Forecasts by Region: 2018 VS 2022 VS 2029
3.2 Global GaN Semiconductor Devices Production Value by Region (2018-2029)
3.2.1 Global GaN Semiconductor Devices Production Value Market Share by Region (2018-2023)
3.2.2 Global Forecasted Production Value of GaN Semiconductor Devices by Region (2024-2029)
3.3 Global GaN Semiconductor Devices Production Estimates and Forecasts by Region: 2018 VS 2022 VS 2029
3.4 Global GaN Semiconductor Devices Production by Region (2018-2029)
3.4.1 Global GaN Semiconductor Devices Production Market Share by Region (2018-2023)
3.4.2 Global Forecasted Production of GaN Semiconductor Devices by Region (2024-2029)
3.5 Global GaN Semiconductor Devices Market Price Analysis by Region (2018-2023)
3.6 Global GaN Semiconductor Devices Production and Value, Year-over-Year Growth
3.6.1 North America GaN Semiconductor Devices Production Value Estimates and Forecasts (2018-2029)
3.6.2 Europe GaN Semiconductor Devices Production Value Estimates and Forecasts (2018-2029)
3.6.3 China GaN Semiconductor Devices Production Value Estimates and Forecasts (2018-2029)
3.6.4 Japan GaN Semiconductor Devices Production Value Estimates and Forecasts (2018-2029)
4 GaN Semiconductor Devices Consumption by Region
4.1 Global GaN Semiconductor Devices Consumption Estimates and Forecasts by Region: 2018 VS 2022 VS 2029
4.2 Global GaN Semiconductor Devices Consumption by Region (2018-2029)
4.2.1 Global GaN Semiconductor Devices Consumption by Region (2018-2023)
4.2.2 Global GaN Semiconductor Devices Forecasted Consumption by Region (2024-2029)
4.3 North America
4.3.1 North America GaN Semiconductor Devices Consumption Growth Rate by Country: 2018 VS 2022 VS 2029
4.3.2 North America GaN Semiconductor Devices Consumption by Country (2018-2029)
4.3.3 United States
4.3.4 Canada
4.4 Europe
4.4.1 Europe GaN Semiconductor Devices Consumption Growth Rate by Country: 2018 VS 2022 VS 2029
4.4.2 Europe GaN Semiconductor Devices Consumption by Country (2018-2029)
4.4.3 Germany
4.4.4 France
4.4.5 U.K.
4.4.6 Italy
4.4.7 Russia
4.5 Asia Pacific
4.5.1 Asia Pacific GaN Semiconductor Devices Consumption Growth Rate by Region: 2018 VS 2022 VS 2029
4.5.2 Asia Pacific GaN Semiconductor Devices Consumption by Region (2018-2029)
4.5.3 China
4.5.4 Japan
4.5.5 South Korea
4.5.6 China Taiwan
4.5.7 Southeast Asia
4.5.8 India
4.6 Latin America, Middle East & Africa
4.6.1 Latin America, Middle East & Africa GaN Semiconductor Devices Consumption Growth Rate by Country: 2018 VS 2022 VS 2029
4.6.2 Latin America, Middle East & Africa GaN Semiconductor Devices Consumption by Country (2018-2029)
4.6.3 Mexico
4.6.4 Brazil
4.6.5 Turkey
5 Segment by Type
5.1 Global GaN Semiconductor Devices Production by Type (2018-2029)
5.1.1 Global GaN Semiconductor Devices Production by Type (2018-2023)
5.1.2 Global GaN Semiconductor Devices Production by Type (2024-2029)
5.1.3 Global GaN Semiconductor Devices Production Market Share by Type (2018-2029)
5.2 Global GaN Semiconductor Devices Production Value by Type (2018-2029)
5.2.1 Global GaN Semiconductor Devices Production Value by Type (2018-2023)
5.2.2 Global GaN Semiconductor Devices Production Value by Type (2024-2029)
5.2.3 Global GaN Semiconductor Devices Production Value Market Share by Type (2018-2029)
5.3 Global GaN Semiconductor Devices Price by Type (2018-2029)
6 Segment by Application
6.1 Global GaN Semiconductor Devices Production by Application (2018-2029)
6.1.1 Global GaN Semiconductor Devices Production by Application (2018-2023)
6.1.2 Global GaN Semiconductor Devices Production by Application (2024-2029)
6.1.3 Global GaN Semiconductor Devices Production Market Share by Application (2018-2029)
6.2 Global GaN Semiconductor Devices Production Value by Application (2018-2029)
6.2.1 Global GaN Semiconductor Devices Production Value by Application (2018-2023)
6.2.2 Global GaN Semiconductor Devices Production Value by Application (2024-2029)
6.2.3 Global GaN Semiconductor Devices Production Value Market Share by Application (2018-2029)
6.3 Global GaN Semiconductor Devices Price by Application (2018-2029)
7 Key Companies Profiled
7.1 Toshiba
7.1.1 Toshiba GaN Semiconductor Devices Corporation Information
7.1.2 Toshiba GaN Semiconductor Devices Product Portfolio
7.1.3 Toshiba GaN Semiconductor Devices Production, Value, Price and Gross Margin (2018-2023)
7.1.4 Toshiba Main Business and Markets Served
7.1.5 Toshiba Recent Developments/Updates
7.2 Wolfspeed
7.2.1 Wolfspeed GaN Semiconductor Devices Corporation Information
7.2.2 Wolfspeed GaN Semiconductor Devices Product Portfolio
7.2.3 Wolfspeed GaN Semiconductor Devices Production, Value, Price and Gross Margin (2018-2023)
7.2.4 Wolfspeed Main Business and Markets Served
7.2.5 Wolfspeed Recent Developments/Updates
7.3 GaN Systems
7.3.1 GaN Systems GaN Semiconductor Devices Corporation Information
7.3.2 GaN Systems GaN Semiconductor Devices Product Portfolio
7.3.3 GaN Systems GaN Semiconductor Devices Production, Value, Price and Gross Margin (2018-2023)
7.3.4 GaN Systems Main Business and Markets Served
7.3.5 GaN Systems Recent Developments/Updates
7.4 Infineon Technologies
7.4.1 Infineon Technologies GaN Semiconductor Devices Corporation Information
7.4.2 Infineon Technologies GaN Semiconductor Devices Product Portfolio
7.4.3 Infineon Technologies GaN Semiconductor Devices Production, Value, Price and Gross Margin (2018-2023)
7.4.4 Infineon Technologies Main Business and Markets Served
7.4.5 Infineon Technologies Recent Developments/Updates
7.5 Efficient Power Conversion (EPC)
7.5.1 Efficient Power Conversion (EPC) GaN Semiconductor Devices Corporation Information
7.5.2 Efficient Power Conversion (EPC) GaN Semiconductor Devices Product Portfolio
7.5.3 Efficient Power Conversion (EPC) GaN Semiconductor Devices Production, Value, Price and Gross Margin (2018-2023)
7.5.4 Efficient Power Conversion (EPC) Main Business and Markets Served
7.5.5 Efficient Power Conversion (EPC) Recent Developments/Updates
7.6 Mitsubishi Electric
7.6.1 Mitsubishi Electric GaN Semiconductor Devices Corporation Information
7.6.2 Mitsubishi Electric GaN Semiconductor Devices Product Portfolio
7.6.3 Mitsubishi Electric GaN Semiconductor Devices Production, Value, Price and Gross Margin (2018-2023)
7.6.4 Mitsubishi Electric Main Business and Markets Served
7.6.5 Mitsubishi Electric Recent Developments/Updates
7.7 STMicroelectronics
7.7.1 STMicroelectronics GaN Semiconductor Devices Corporation Information
7.7.2 STMicroelectronics GaN Semiconductor Devices Product Portfolio
7.7.3 STMicroelectronics GaN Semiconductor Devices Production, Value, Price and Gross Margin (2018-2023)
7.7.4 STMicroelectronics Main Business and Markets Served
7.7.5 STMicroelectronics Recent Developments/Updates
7.8 Transphorm
7.8.1 Transphorm GaN Semiconductor Devices Corporation Information
7.8.2 Transphorm GaN Semiconductor Devices Product Portfolio
7.8.3 Transphorm GaN Semiconductor Devices Production, Value, Price and Gross Margin (2018-2023)
7.8.4 Transphorm Main Business and Markets Served
7.7.5 Transphorm Recent Developments/Updates
7.9 NexGen
7.9.1 NexGen GaN Semiconductor Devices Corporation Information
7.9.2 NexGen GaN Semiconductor Devices Product Portfolio
7.9.3 NexGen GaN Semiconductor Devices Production, Value, Price and Gross Margin (2018-2023)
7.9.4 NexGen Main Business and Markets Served
7.9.5 NexGen Recent Developments/Updates
7.10 ROHM Semiconductor
7.10.1 ROHM Semiconductor GaN Semiconductor Devices Corporation Information
7.10.2 ROHM Semiconductor GaN Semiconductor Devices Product Portfolio
7.10.3 ROHM Semiconductor GaN Semiconductor Devices Production, Value, Price and Gross Margin (2018-2023)
7.10.4 ROHM Semiconductor Main Business and Markets Served
7.10.5 ROHM Semiconductor Recent Developments/Updates
7.11 Sumitomo Electric Device Innovations Inc (SEDI)
7.11.1 Sumitomo Electric Device Innovations Inc (SEDI) GaN Semiconductor Devices Corporation Information
7.11.2 Sumitomo Electric Device Innovations Inc (SEDI) GaN Semiconductor Devices Product Portfolio
7.11.3 Sumitomo Electric Device Innovations Inc (SEDI) GaN Semiconductor Devices Production, Value, Price and Gross Margin (2018-2023)
7.11.4 Sumitomo Electric Device Innovations Inc (SEDI) Main Business and Markets Served
7.11.5 Sumitomo Electric Device Innovations Inc (SEDI) Recent Developments/Updates
7.12 Qorvo
7.12.1 Qorvo GaN Semiconductor Devices Corporation Information
7.12.2 Qorvo GaN Semiconductor Devices Product Portfolio
7.12.3 Qorvo GaN Semiconductor Devices Production, Value, Price and Gross Margin (2018-2023)
7.12.4 Qorvo Main Business and Markets Served
7.12.5 Qorvo Recent Developments/Updates
7.13 MACOM
7.13.1 MACOM GaN Semiconductor Devices Corporation Information
7.13.2 MACOM GaN Semiconductor Devices Product Portfolio
7.13.3 MACOM GaN Semiconductor Devices Production, Value, Price and Gross Margin (2018-2023)
7.13.4 MACOM Main Business and Markets Served
7.13.5 MACOM Recent Developments/Updates
7.14 Renesas Electronics
7.14.1 Renesas Electronics GaN Semiconductor Devices Corporation Information
7.14.2 Renesas Electronics GaN Semiconductor Devices Product Portfolio
7.14.3 Renesas Electronics GaN Semiconductor Devices Production, Value, Price and Gross Margin (2018-2023)
7.14.4 Renesas Electronics Main Business and Markets Served
7.14.5 Renesas Electronics Recent Developments/Updates
7.15 Dynax Semiconductor
7.15.1 Dynax Semiconductor GaN Semiconductor Devices Corporation Information
7.15.2 Dynax Semiconductor GaN Semiconductor Devices Product Portfolio
7.15.3 Dynax Semiconductor GaN Semiconductor Devices Production, Value, Price and Gross Margin (2018-2023)
7.15.4 Dynax Semiconductor Main Business and Markets Served
7.15.5 Dynax Semiconductor Recent Developments/Updates
7.16 Jiangsu Corenergy Semiconductor
7.16.1 Jiangsu Corenergy Semiconductor GaN Semiconductor Devices Corporation Information
7.16.2 Jiangsu Corenergy Semiconductor GaN Semiconductor Devices Product Portfolio
7.16.3 Jiangsu Corenergy Semiconductor GaN Semiconductor Devices Production, Value, Price and Gross Margin (2018-2023)
7.16.4 Jiangsu Corenergy Semiconductor Main Business and Markets Served
7.16.5 Jiangsu Corenergy Semiconductor Recent Developments/Updates
7.17 Ampleon
7.17.1 Ampleon GaN Semiconductor Devices Corporation Information
7.17.2 Ampleon GaN Semiconductor Devices Product Portfolio
7.17.3 Ampleon GaN Semiconductor Devices Production, Value, Price and Gross Margin (2018-2023)
7.17.4 Ampleon Main Business and Markets Served
7.17.5 Ampleon Recent Developments/Updates
7.18 Innoscience
7.18.1 Innoscience GaN Semiconductor Devices Corporation Information
7.18.2 Innoscience GaN Semiconductor Devices Product Portfolio
7.18.3 Innoscience GaN Semiconductor Devices Production, Value, Price and Gross Margin (2018-2023)
7.18.4 Innoscience Main Business and Markets Served
7.18.5 Innoscience Recent Developments/Updates
7.19 NXP Semiconductors
7.19.1 NXP Semiconductors GaN Semiconductor Devices Corporation Information
7.19.2 NXP Semiconductors GaN Semiconductor Devices Product Portfolio
7.19.3 NXP Semiconductors GaN Semiconductor Devices Production, Value, Price and Gross Margin (2018-2023)
7.19.4 NXP Semiconductors Main Business and Markets Served
7.19.5 NXP Semiconductors Recent Developments/Updates
8 Industry Chain and Sales Channels Analysis
8.1 GaN Semiconductor Devices Industry Chain Analysis
8.2 GaN Semiconductor Devices Key Raw Materials
8.2.1 Key Raw Materials
8.2.2 Raw Materials Key Suppliers
8.3 GaN Semiconductor Devices Production Mode & Process
8.4 GaN Semiconductor Devices Sales and Marketing
8.4.1 GaN Semiconductor Devices Sales Channels
8.4.2 GaN Semiconductor Devices Distributors
8.5 GaN Semiconductor Devices Customers
9 GaN Semiconductor Devices Market Dynamics
9.1 GaN Semiconductor Devices Industry Trends
9.2 GaN Semiconductor Devices Market Drivers
9.3 GaN Semiconductor Devices Market Challenges
9.4 GaN Semiconductor Devices Market Restraints
10 Research Finding and Conclusion
11 Methodology and Data Source
11.1 Methodology/Research Approach
11.1.1 Research Programs/Design
11.1.2 Market Size Estimation
11.1.3 Market Breakdown and Data Triangulation
11.2 Data Source
11.2.1 Secondary Sources
11.2.2 Primary Sources
11.3 Author List
11.4 Disclaimer
List of Tables
    Table 1. Global GaN Semiconductor Devices Market Value by Type, (US$ Million) & (2022 VS 2029)
    Table 2. Global GaN Semiconductor Devices Market Value by Application, (US$ Million) & (2022 VS 2029)
    Table 3. Global GaN Semiconductor Devices Production Capacity (K Units) by Manufacturers in 2022
    Table 4. Global GaN Semiconductor Devices Production by Manufacturers (2018-2023) & (K Units)
    Table 5. Global GaN Semiconductor Devices Production Market Share by Manufacturers (2018-2023)
    Table 6. Global GaN Semiconductor Devices Production Value by Manufacturers (2018-2023) & (US$ Million)
    Table 7. Global GaN Semiconductor Devices Production Value Share by Manufacturers (2018-2023)
    Table 8. Global GaN Semiconductor Devices Industry Ranking 2021 VS 2022 VS 2023
    Table 9. Company Type (Tier 1, Tier 2 and Tier 3) & (based on the Revenue in GaN Semiconductor Devices as of 2022)
    Table 10. Global Market GaN Semiconductor Devices Average Price by Manufacturers (US$/Unit) & (2018-2023)
    Table 11. Manufacturers GaN Semiconductor Devices Production Sites and Area Served
    Table 12. Manufacturers GaN Semiconductor Devices Product Types
    Table 13. Global GaN Semiconductor Devices Manufacturers Market Concentration Ratio (CR5 and HHI)
    Table 14. Mergers & Acquisitions, Expansion
    Table 15. Global GaN Semiconductor Devices Production Value by Region: 2018 VS 2022 VS 2029 (US$ Million)
    Table 16. Global GaN Semiconductor Devices Production Value (US$ Million) by Region (2018-2023)
    Table 17. Global GaN Semiconductor Devices Production Value Market Share by Region (2018-2023)
    Table 18. Global GaN Semiconductor Devices Production Value (US$ Million) Forecast by Region (2024-2029)
    Table 19. Global GaN Semiconductor Devices Production Value Market Share Forecast by Region (2024-2029)
    Table 20. Global GaN Semiconductor Devices Production Comparison by Region: 2018 VS 2022 VS 2029 (K Units)
    Table 21. Global GaN Semiconductor Devices Production (K Units) by Region (2018-2023)
    Table 22. Global GaN Semiconductor Devices Production Market Share by Region (2018-2023)
    Table 23. Global GaN Semiconductor Devices Production (K Units) Forecast by Region (2024-2029)
    Table 24. Global GaN Semiconductor Devices Production Market Share Forecast by Region (2024-2029)
    Table 25. Global GaN Semiconductor Devices Market Average Price (US$/Unit) by Region (2018-2023)
    Table 26. Global GaN Semiconductor Devices Market Average Price (US$/Unit) by Region (2024-2029)
    Table 27. Global GaN Semiconductor Devices Consumption Growth Rate by Region: 2018 VS 2022 VS 2029 (K Units)
    Table 28. Global GaN Semiconductor Devices Consumption by Region (2018-2023) & (K Units)
    Table 29. Global GaN Semiconductor Devices Consumption Market Share by Region (2018-2023)
    Table 30. Global GaN Semiconductor Devices Forecasted Consumption by Region (2024-2029) & (K Units)
    Table 31. Global GaN Semiconductor Devices Forecasted Consumption Market Share by Region (2018-2023)
    Table 32. North America GaN Semiconductor Devices Consumption Growth Rate by Country: 2018 VS 2022 VS 2029 (K Units)
    Table 33. North America GaN Semiconductor Devices Consumption by Country (2018-2023) & (K Units)
    Table 34. North America GaN Semiconductor Devices Consumption by Country (2024-2029) & (K Units)
    Table 35. Europe GaN Semiconductor Devices Consumption Growth Rate by Country: 2018 VS 2022 VS 2029 (K Units)
    Table 36. Europe GaN Semiconductor Devices Consumption by Country (2018-2023) & (K Units)
    Table 37. Europe GaN Semiconductor Devices Consumption by Country (2024-2029) & (K Units)
    Table 38. Asia Pacific GaN Semiconductor Devices Consumption Growth Rate by Region: 2018 VS 2022 VS 2029 (K Units)
    Table 39. Asia Pacific GaN Semiconductor Devices Consumption by Region (2018-2023) & (K Units)
    Table 40. Asia Pacific GaN Semiconductor Devices Consumption by Region (2024-2029) & (K Units)
    Table 41. Latin America, Middle East & Africa GaN Semiconductor Devices Consumption Growth Rate by Country: 2018 VS 2022 VS 2029 (K Units)
    Table 42. Latin America, Middle East & Africa GaN Semiconductor Devices Consumption by Country (2018-2023) & (K Units)
    Table 43. Latin America, Middle East & Africa GaN Semiconductor Devices Consumption by Country (2024-2029) & (K Units)
    Table 44. Global GaN Semiconductor Devices Production (K Units) by Type (2018-2023)
    Table 45. Global GaN Semiconductor Devices Production (K Units) by Type (2024-2029)
    Table 46. Global GaN Semiconductor Devices Production Market Share by Type (2018-2023)
    Table 47. Global GaN Semiconductor Devices Production Market Share by Type (2024-2029)
    Table 48. Global GaN Semiconductor Devices Production Value (US$ Million) by Type (2018-2023)
    Table 49. Global GaN Semiconductor Devices Production Value (US$ Million) by Type (2024-2029)
    Table 50. Global GaN Semiconductor Devices Production Value Share by Type (2018-2023)
    Table 51. Global GaN Semiconductor Devices Production Value Share by Type (2024-2029)
    Table 52. Global GaN Semiconductor Devices Price (US$/Unit) by Type (2018-2023)
    Table 53. Global GaN Semiconductor Devices Price (US$/Unit) by Type (2024-2029)
    Table 54. Global GaN Semiconductor Devices Production (K Units) by Application (2018-2023)
    Table 55. Global GaN Semiconductor Devices Production (K Units) by Application (2024-2029)
    Table 56. Global GaN Semiconductor Devices Production Market Share by Application (2018-2023)
    Table 57. Global GaN Semiconductor Devices Production Market Share by Application (2024-2029)
    Table 58. Global GaN Semiconductor Devices Production Value (US$ Million) by Application (2018-2023)
    Table 59. Global GaN Semiconductor Devices Production Value (US$ Million) by Application (2024-2029)
    Table 60. Global GaN Semiconductor Devices Production Value Share by Application (2018-2023)
    Table 61. Global GaN Semiconductor Devices Production Value Share by Application (2024-2029)
    Table 62. Global GaN Semiconductor Devices Price (US$/Unit) by Application (2018-2023)
    Table 63. Global GaN Semiconductor Devices Price (US$/Unit) by Application (2024-2029)
    Table 64. Toshiba GaN Semiconductor Devices Corporation Information
    Table 65. Toshiba Specification and Application
    Table 66. Toshiba GaN Semiconductor Devices Production (K Units), Value (US$ Million), Price (US$/Unit) and Gross Margin (2018-2023)
    Table 67. Toshiba Main Business and Markets Served
    Table 68. Toshiba Recent Developments/Updates
    Table 69. Wolfspeed GaN Semiconductor Devices Corporation Information
    Table 70. Wolfspeed Specification and Application
    Table 71. Wolfspeed GaN Semiconductor Devices Production (K Units), Value (US$ Million), Price (US$/Unit) and Gross Margin (2018-2023)
    Table 72. Wolfspeed Main Business and Markets Served
    Table 73. Wolfspeed Recent Developments/Updates
    Table 74. GaN Systems GaN Semiconductor Devices Corporation Information
    Table 75. GaN Systems Specification and Application
    Table 76. GaN Systems GaN Semiconductor Devices Production (K Units), Value (US$ Million), Price (US$/Unit) and Gross Margin (2018-2023)
    Table 77. GaN Systems Main Business and Markets Served
    Table 78. GaN Systems Recent Developments/Updates
    Table 79. Infineon Technologies GaN Semiconductor Devices Corporation Information
    Table 80. Infineon Technologies Specification and Application
    Table 81. Infineon Technologies GaN Semiconductor Devices Production (K Units), Value (US$ Million), Price (US$/Unit) and Gross Margin (2018-2023)
    Table 82. Infineon Technologies Main Business and Markets Served
    Table 83. Infineon Technologies Recent Developments/Updates
    Table 84. Efficient Power Conversion (EPC) GaN Semiconductor Devices Corporation Information
    Table 85. Efficient Power Conversion (EPC) Specification and Application
    Table 86. Efficient Power Conversion (EPC) GaN Semiconductor Devices Production (K Units), Value (US$ Million), Price (US$/Unit) and Gross Margin (2018-2023)
    Table 87. Efficient Power Conversion (EPC) Main Business and Markets Served
    Table 88. Efficient Power Conversion (EPC) Recent Developments/Updates
    Table 89. Mitsubishi Electric GaN Semiconductor Devices Corporation Information
    Table 90. Mitsubishi Electric Specification and Application
    Table 91. Mitsubishi Electric GaN Semiconductor Devices Production (K Units), Value (US$ Million), Price (US$/Unit) and Gross Margin (2018-2023)
    Table 92. Mitsubishi Electric Main Business and Markets Served
    Table 93. Mitsubishi Electric Recent Developments/Updates
    Table 94. STMicroelectronics GaN Semiconductor Devices Corporation Information
    Table 95. STMicroelectronics Specification and Application
    Table 96. STMicroelectronics GaN Semiconductor Devices Production (K Units), Value (US$ Million), Price (US$/Unit) and Gross Margin (2018-2023)
    Table 97. STMicroelectronics Main Business and Markets Served
    Table 98. STMicroelectronics Recent Developments/Updates
    Table 99. Transphorm GaN Semiconductor Devices Corporation Information
    Table 100. Transphorm Specification and Application
    Table 101. Transphorm GaN Semiconductor Devices Production (K Units), Value (US$ Million), Price (US$/Unit) and Gross Margin (2018-2023)
    Table 102. Transphorm Main Business and Markets Served
    Table 103. Transphorm Recent Developments/Updates
    Table 104. NexGen GaN Semiconductor Devices Corporation Information
    Table 105. NexGen Specification and Application
    Table 106. NexGen GaN Semiconductor Devices Production (K Units), Value (US$ Million), Price (US$/Unit) and Gross Margin (2018-2023)
    Table 107. NexGen Main Business and Markets Served
    Table 108. NexGen Recent Developments/Updates
    Table 109. ROHM Semiconductor GaN Semiconductor Devices Corporation Information
    Table 110. ROHM Semiconductor Specification and Application
    Table 111. ROHM Semiconductor GaN Semiconductor Devices Production (K Units), Value (US$ Million), Price (US$/Unit) and Gross Margin (2018-2023)
    Table 112. ROHM Semiconductor Main Business and Markets Served
    Table 113. ROHM Semiconductor Recent Developments/Updates
    Table 114. Sumitomo Electric Device Innovations Inc (SEDI) GaN Semiconductor Devices Corporation Information
    Table 115. Sumitomo Electric Device Innovations Inc (SEDI) Specification and Application
    Table 116. Sumitomo Electric Device Innovations Inc (SEDI) GaN Semiconductor Devices Production (K Units), Value (US$ Million), Price (US$/Unit) and Gross Margin (2018-2023)
    Table 117. Sumitomo Electric Device Innovations Inc (SEDI) Main Business and Markets Served
    Table 118. Sumitomo Electric Device Innovations Inc (SEDI) Recent Developments/Updates
    Table 119. Qorvo GaN Semiconductor Devices Corporation Information
    Table 120. Qorvo Specification and Application
    Table 121. Qorvo GaN Semiconductor Devices Production (K Units), Value (US$ Million), Price (US$/Unit) and Gross Margin (2018-2023)
    Table 122. Qorvo Main Business and Markets Served
    Table 123. Qorvo Recent Developments/Updates
    Table 124. MACOM GaN Semiconductor Devices Corporation Information
    Table 125. MACOM Specification and Application
    Table 126. MACOM GaN Semiconductor Devices Production (K Units), Value (US$ Million), Price (US$/Unit) and Gross Margin (2018-2023)
    Table 127. MACOM Main Business and Markets Served
    Table 128. MACOM Recent Developments/Updates
    Table 129. Renesas Electronics GaN Semiconductor Devices Corporation Information
    Table 130. Renesas Electronics Specification and Application
    Table 131. Renesas Electronics GaN Semiconductor Devices Production (K Units), Value (US$ Million), Price (US$/Unit) and Gross Margin (2018-2023)
    Table 132. Renesas Electronics Main Business and Markets Served
    Table 133. Renesas Electronics Recent Developments/Updates
    Table 134. Renesas Electronics GaN Semiconductor Devices Corporation Information
    Table 135. Dynax Semiconductor Specification and Application
    Table 136. Dynax Semiconductor GaN Semiconductor Devices Production (K Units), Value (US$ Million), Price (US$/Unit) and Gross Margin (2018-2023)
    Table 137. Dynax Semiconductor Main Business and Markets Served
    Table 138. Dynax Semiconductor Recent Developments/Updates
    Table 139. Jiangsu Corenergy Semiconductor GaN Semiconductor Devices Corporation Information
    Table 140. Jiangsu Corenergy Semiconductor GaN Semiconductor Devices Production (K Units), Value (US$ Million), Price (US$/Unit) and Gross Margin (2018-2023)
    Table 141. Jiangsu Corenergy Semiconductor Main Business and Markets Served
    Table 142. Jiangsu Corenergy Semiconductor Recent Developments/Updates
    Table 143. Ampleon GaN Semiconductor Devices Corporation Information
    Table 144. Ampleon Specification and Application
    Table 145. Ampleon GaN Semiconductor Devices Production (K Units), Value (US$ Million), Price (US$/Unit) and Gross Margin (2018-2023)
    Table 146. Ampleon Main Business and Markets Served
    Table 147. Ampleon Recent Developments/Updates
    Table 148. Innoscience GaN Semiconductor Devices Corporation Information
    Table 149. Innoscience Specification and Application
    Table 150. Innoscience GaN Semiconductor Devices Production (K Units), Value (US$ Million), Price (US$/Unit) and Gross Margin (2018-2023)
    Table 151. Innoscience Main Business and Markets Served
    Table 152. Innoscience Recent Developments/Updates
    Table 153. NXP Semiconductors GaN Semiconductor Devices Corporation Information
    Table 154. NXP Semiconductors Specification and Application
    Table 155. NXP Semiconductors GaN Semiconductor Devices Production (K Units), Value (US$ Million), Price (US$/Unit) and Gross Margin (2018-2023)
    Table 156. NXP Semiconductors Main Business and Markets Served
    Table 157. NXP Semiconductors Recent Developments/Updates
    Table 158. Key Raw Materials Lists
    Table 159. Raw Materials Key Suppliers Lists
    Table 160. GaN Semiconductor Devices Distributors List
    Table 161. GaN Semiconductor Devices Customers List
    Table 162. GaN Semiconductor Devices Market Trends
    Table 163. GaN Semiconductor Devices Market Drivers
    Table 164. GaN Semiconductor Devices Market Challenges
    Table 165. GaN Semiconductor Devices Market Restraints
    Table 166. Research Programs/Design for This Report
    Table 167. Key Data Information from Secondary Sources
    Table 168. Key Data Information from Primary Sources
List of Figures
    Figure 1. Product Picture of GaN Semiconductor Devices
    Figure 2. Global GaN Semiconductor Devices Market Value by Type, (US$ Million) & (2022 VS 2029)
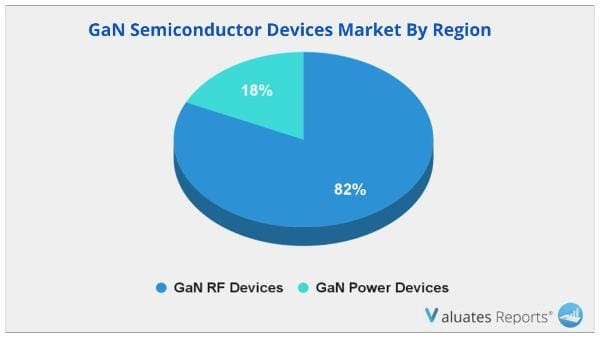
    Figure 3. Global GaN Semiconductor Devices Market Share by Type: 2022 VS 2029
    Figure 4. GaN Power Devices (Schottky Diodes, Field Effect Transistors (FETs)) Product Picture
    Figure 5. GaN RF Devices (Power Amplifier PA, Low Noise Amplifier LNA, RF Switch SWITCH, Monolithic Integrated Circuit MMIC) Product Picture
    Figure 6. Global GaN Semiconductor Devices Market Value by Application, (US$ Million) & (2022 VS 2029)
    Figure 7. Global GaN Semiconductor Devices Market Share by Application: 2022 VS 2029
    Figure 8. Consumer Electronics
    Figure 9. Telecom & Datacom
    Figure 10. Industrial Industry
    Figure 11. Defence & Aerospace
    Figure 12. Energy Industry
    Figure 13. Automobile & Mobility
    Figure 14. Others
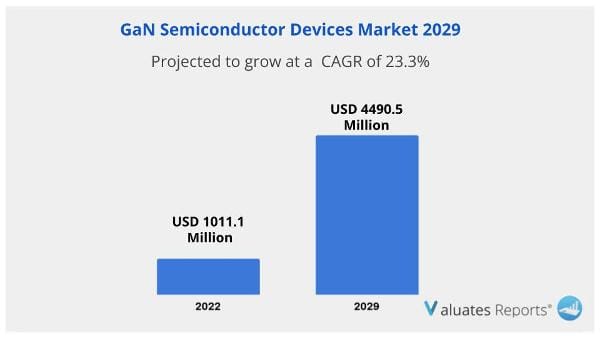
    Figure 15. Global GaN Semiconductor Devices Production Value (US$ Million), 2018 VS 2022 VS 2029
    Figure 16. Global GaN Semiconductor Devices Production Value (US$ Million) & (2018-2029)
    Figure 17. Global GaN Semiconductor Devices Production (K Units) & (2018-2029)
    Figure 18. Global GaN Semiconductor Devices Average Price (US$/Unit) & (2018-2029)
    Figure 19. GaN Semiconductor Devices Report Years Considered
    Figure 20. GaN Semiconductor Devices Production Share by Manufacturers in 2022
    Figure 21. GaN Semiconductor Devices Market Share by Company Type (Tier 1, Tier 2, and Tier 3): 2018 VS 2022
    Figure 22. The Global 5 and 10 Largest Players: Market Share by GaN Semiconductor Devices Revenue in 2022
    Figure 23. Global GaN Semiconductor Devices Production Value by Region: 2018 VS 2022 VS 2029 (US$ Million)
    Figure 24. Global GaN Semiconductor Devices Production Value Market Share by Region: 2018 VS 2022 VS 2029
    Figure 25. Global GaN Semiconductor Devices Production Comparison by Region: 2018 VS 2022 VS 2029 (K Units)
    Figure 26. Global GaN Semiconductor Devices Production Market Share by Region: 2018 VS 2022 VS 2029
    Figure 27. North America GaN Semiconductor Devices Production Value (US$ Million) Growth Rate (2018-2029)
    Figure 28. Europe GaN Semiconductor Devices Production Value (US$ Million) Growth Rate (2018-2029)
    Figure 29. China GaN Semiconductor Devices Production Value (US$ Million) Growth Rate (2018-2029)
    Figure 30. Japan GaN Semiconductor Devices Production Value (US$ Million) Growth Rate (2018-2029)
    Figure 31. Global GaN Semiconductor Devices Consumption by Region: 2018 VS 2022 VS 2029 (K Units)
    Figure 32. Global GaN Semiconductor Devices Consumption Market Share by Region: 2018 VS 2022 VS 2029
    Figure 33. North America GaN Semiconductor Devices Consumption and Growth Rate (2018-2023) & (K Units)
    Figure 34. North America GaN Semiconductor Devices Consumption Market Share by Country (2018-2029)
    Figure 35. Canada GaN Semiconductor Devices Consumption and Growth Rate (2018-2023) & (K Units)
    Figure 36. U.S. GaN Semiconductor Devices Consumption and Growth Rate (2018-2023) & (K Units)
    Figure 37. Europe GaN Semiconductor Devices Consumption and Growth Rate (2018-2023) & (K Units)
    Figure 38. Europe GaN Semiconductor Devices Consumption Market Share by Country (2018-2029)
    Figure 39. Germany GaN Semiconductor Devices Consumption and Growth Rate (2018-2023) & (K Units)
    Figure 40. France GaN Semiconductor Devices Consumption and Growth Rate (2018-2023) & (K Units)
    Figure 41. U.K. GaN Semiconductor Devices Consumption and Growth Rate (2018-2023) & (K Units)
    Figure 42. Italy GaN Semiconductor Devices Consumption and Growth Rate (2018-2023) & (K Units)
    Figure 43. Russia GaN Semiconductor Devices Consumption and Growth Rate (2018-2023) & (K Units)
    Figure 44. Asia Pacific GaN Semiconductor Devices Consumption and Growth Rate (2018-2023) & (K Units)
    Figure 45. Asia Pacific GaN Semiconductor Devices Consumption Market Share by Regions (2018-2029)
    Figure 46. China GaN Semiconductor Devices Consumption and Growth Rate (2018-2023) & (K Units)
    Figure 47. Japan GaN Semiconductor Devices Consumption and Growth Rate (2018-2023) & (K Units)
    Figure 48. South Korea GaN Semiconductor Devices Consumption and Growth Rate (2018-2023) & (K Units)
    Figure 49. China Taiwan GaN Semiconductor Devices Consumption and Growth Rate (2018-2023) & (K Units)
    Figure 50. Southeast Asia GaN Semiconductor Devices Consumption and Growth Rate (2018-2023) & (K Units)
    Figure 51. India GaN Semiconductor Devices Consumption and Growth Rate (2018-2023) & (K Units)
    Figure 52. Latin America, Middle East & Africa GaN Semiconductor Devices Consumption and Growth Rate (2018-2023) & (K Units)
    Figure 53. Latin America, Middle East & Africa GaN Semiconductor Devices Consumption Market Share by Country (2018-2029)
    Figure 54. Mexico GaN Semiconductor Devices Consumption and Growth Rate (2018-2023) & (K Units)
    Figure 55. Brazil GaN Semiconductor Devices Consumption and Growth Rate (2018-2023) & (K Units)
    Figure 56. Turkey GaN Semiconductor Devices Consumption and Growth Rate (2018-2023) & (K Units)
    Figure 57. GCC Countries GaN Semiconductor Devices Consumption and Growth Rate (2018-2023) & (K Units)
    Figure 58. Global Production Market Share of GaN Semiconductor Devices by Type (2018-2029)
    Figure 59. Global Production Value Market Share of GaN Semiconductor Devices by Type (2018-2029)
    Figure 60. Global GaN Semiconductor Devices Price (US$/Unit) by Type (2018-2029)
    Figure 61. Global Production Market Share of GaN Semiconductor Devices by Application (2018-2029)
    Figure 62. Global Production Value Market Share of GaN Semiconductor Devices by Application (2018-2029)
    Figure 63. Global GaN Semiconductor Devices Price (US$/Unit) by Application (2018-2029)
    Figure 64. GaN Semiconductor Devices Value Chain
    Figure 65. GaN Semiconductor Devices Production Process
    Figure 66. Channels of Distribution (Direct Vs Distribution)
    Figure 67. Distributors Profiles
    Figure 68. Bottom-up and Top-down Approaches for This Report
    Figure 69. Data Triangulation
SELECT A FORMAT
Added to Cart
Electronic (PDF)

$2900

This license allows only one user to access the PDF.
Electronic (PDF)

$4350

This license allows 1 - 5 user to access the PDF, license is suitable for small groups of 5 users working together
Electronic (PDF)

$5800

This license allows users/teams in a same Enterprise to use this report, various departments within an enterpise can use this report
Add to Cart
Buy Now (10% Discount)

OUR CUSTOMER

SIS Group of Schools

SIMILAR REPORTS

RELATED REPORTS

Global Film Capacitor Market Research Report 2023

120 Pages
Type: Report
Code: QYRE-Auto-36L9131
Sun Aug 27 00:00:00 UTC 2023

Add to Cart

Global Single Photon Avalanche Photodiode Market Research Report 2023

120 Pages
Type: Report
Code: QYRE-Auto-12I13045
Sun Aug 27 00:00:00 UTC 2023

Add to Cart

Global RF and Microwave Ceramic Capacitors Market Research Report 2023

120 Pages
Type: Report
Code: QYRE-Auto-5X9253
Sun Aug 27 00:00:00 UTC 2023

Add to Cart

Global RF and Microwave Switches Market Research Report 2023

120 Pages
Type: Report
Code: QYRE-Auto-25L9049
Sun Aug 27 00:00:00 UTC 2023

Add to Cart