Ceramic Fiber Market Statistics 2027
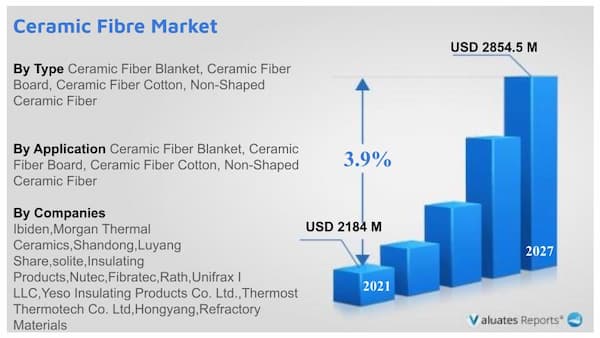
In 2020, the global Ceramic Fiber market size was US$ 2184 million and it is expected to reach US$ 2854.5 million by the end of 2027, with a Compound Annual Growth Rate (CAGR) of 3.9% during the forecast period 2021-2027. Due to properties such as lightweight, high thermal conductivity, thermal shock resistance, high-temperature stability, and high chemical resistance, the rising use of ceramic fibers in end-use industries is expected to fuel the ceramic fiber market expansion. Furthermore, the ceramic fiber market is predicted to increase significantly due to the rising use of ceramic fiber for insulation reasons in the iron and steel, and petrochemical industries.
Trends Influencing The Growth Of The Fiber Market
Ceramic fiber's increasing use in a range of end-user applications is expected to drive the Ceramic Fiber market. High-temperature-resistant ceramic blankets and boards are used as insulation in shipbuilding to prevent fires from spreading and to contain heat. Blankets, rigid boards, and semirigid boards can all be used to ship compartment walls and ceilings because of this. Ceramic blankets are used as catalytic converter insulation in the automobile industry, as well as in aircraft and spacecraft engines. In the metal industry, ceramic blankets are utilized as furnace interior insulation. Boards are used in conjunction with blankets to provide insulation. Ceramic boards are also used as a backup insulation for furnaces and kilns, thermal covering for stationary steam generators, molten metal ladles linings, and cover insulation for magnesium cells and high-temperature reactors in the chemical-process industry.
The ceramic fiber market is predicted to develop due to the rising demand for ceramic fiber insulation in high-temperature applications. Ceramic fiber has poor thermal conductivity and can withstand high temperatures. It has a low density and thermal inertia as well. Ceramic fiber products are used as insulation materials in high-temperature applications because they provide good heat containment and energy conservation. The goods include blankets, boards, bulk fibers, modules, paper, textiles, and other items. The end-use industries that benefit from their lightweight, thermal shock resistance, and strength include petrochemical, iron & steel, aluminum, ceramic, power generation, automotive, aerospace, and glass.
Ceramic fiber demand is expected to grow significantly during the projected period, driven by end-user industries' rising need to save energy and reduce production costs. Ceramic fiber is extensively used as a refractory liner for thermal processing and heating furnaces in the iron and steel industries. When compared to insulating fire bricks, it has a higher energy conductivity per unit thickness. By preventing heat from escaping from furnaces and kilns, ceramic fiber helps save energy. It has low conductivity and is lightweight. The ceramic fiber market is predicted to grow as a result of this property.
The rising aircraft sector in the world is expected to boost the ceramic fiber market over the forecast period. Because of its lightweight, high-temperature resistance, electrical insulation, high energy of ablation, corrosion resistance, chemical stability, wear resistance, and vibration resistance, ceramic fibers are used in the aerospace industry.
Ceramic Fiber Market share Analysis
North America is the largest market by region, with a share of approximately 40%, followed by China and Europe, with a combined share of over 50%. The growth in shale exploration activity is credited with North America's dominance.
Ceramic Fiber Blanket is the most popular product, accounting for around 45 percent of the market. The maritime, industrial, automotive, and aerospace industries have all seen an increase in demand for insulating materials. Ceramic fiber blankets are a popular item on the market. High-temperature-resistant ceramic blankets are used as insulation in shipbuilding to avoid fire spread and general heating containment. Blankets are frequently used on ship cabin ceilings and walls.
Based on application, the largest application is Chemical Industry, followed by the Aerospace And Defense Industry, Steel Industry, Electrical Appliances, etc.
Ceramic Fiber Market by Type
- Ceramic Fiber Blanket
- Ceramic Fiber Board
- Ceramic Fiber Cotton
- Non-Shaped Ceramic Fiber
Ceramic Fiber Market by Application
- Aerospace And Defense
- Chemical
- Steel Industry
- Electrical Appliances
- Others
Major Players in the Ceramic Fiber Market
- Ibiden
- Morgan Thermal Ceramics
- Shandong Luyang Share
- Isolite Insulating Products
- Nutec Fibratec
- Rath
- Unifrax I LLC
- Yeso Insulating Products Co. Ltd.
- Thermost Thermotech Co. Ltd
- Hongyang Refractory Materials
- Others
Scope of the Ceramic Fiber Market Report
|
Report Metric |
Details |
|
Report Name |
Ceramic Fiber Market |
|
The market size in 2020 |
USD 2184 Million |
|
The revenue forecast in 2027 |
USD 2854.5 Million |
|
Growth Rate |
Compound Annual Growth Rate (CAGR) of 3.9% from 2021 to 2027 |
|
Market size available for years |
2021-2027 |
|
Forecast units |
Value (USD) |
|
Segments covered |
Type, End-User, Offerings, and Region |
|
Report coverage |
Revenue & volume forecast, company share, competitive landscape, growth factors, and trends |
|
Geographic regions covered |
North America, Europe, Asia Pacific, Latin America, Middle East & Africa |
Frequently Asked Questions About This Report
1. How big is the Ceramic Fiber Market?
Ans. In 2020, the global Ceramic Fiber market size was US$ 2184 million and it is expected to reach US$ 2854.5 million by the end of 2027, with a Compound Annual Growth Rate (CAGR) of 3.9% during the forecast period 2021-2027.
2. Which regional market holds the maximum market share of the Ceramic Fiber Industry?
Ans. North America is the largest market by region, with a share of approximately 40%, followed by China and Europe, with a combined share of over 50%.
3. What are the upcoming trends in Ceramic Fiber Market?
Ans. Ceramic fiber's increasing use in a range of end-user applications is expected to drive the Ceramic Fiber market.
4. Which is the most influencing segment growing in the Ceramic Fiber Market report?
Ans. Based on application, the largest application is Chemical Industry, followed by the Aerospace And Defense Industry, Steel Industry, Electrical Appliances, etc.
5. Who are the top companies hold the market share in the global Ceramic Fiber Market?
Ans. Global Ceramic Fiber Market key players include Ibiden, Isolite Insulating Products, Luyang Energy-Saving Materials, Morgan Thermal Ceramics, Unifrax, etc. Global top five players hold a share about 30%.
6. Does the report provide COVID-19 impact analysis?
Ans. Yes, the report includes a COVID-19 impact analysis. Also, it is further extended into every individual segment of the report.
Table of Content
1 Study Coverage
1.1 Ceramic Fiber Product Introduction
1.2 Market by Type
1.2.1 Global Ceramic Fiber Market Size Growth Rate by Type
1.2.2 Ceramic Fiber Blanket
1.2.3 Ceramic Fiber Board
1.2.4 Ceramic Fiber Cotton
1.2.5 Non-Shaped Ceramic Fiber
1.3 Market by Application
1.3.1 Global Ceramic Fiber Market Size Growth Rate by Application
1.3.2 Aerospace And Defense
1.3.3 Chemical
1.3.4 Steel Industry
1.3.5 Electrical Appliances
1.3.6 Others
1.4 Study Objectives
1.5 Years Considered
2 Executive Summary
2.1 Global Ceramic Fiber Market Size Estimates and Forecasts
2.1.1 Global Ceramic Fiber Revenue 2016-2027
2.1.2 Global Ceramic Fiber Sales 2016-2027
2.2 Ceramic Fiber Market Size by Region: 2021 Versus 2027
2.3 Ceramic Fiber Sales by Region (2016-2027)
2.3.1 Global Ceramic Fiber Sales by Region: 2016-2021
2.3.2 Global Ceramic Fiber Sales Forecast by Region (2022-2027)
2.3.3 Global Ceramic Fiber Sales Market Share by Region (2016-2027)
2.4 Ceramic Fiber Market Estimates and Projections by Region (2022-2027)
2.4.1 Global Ceramic Fiber Revenue by Region: 2016-2021
2.4.2 Global Ceramic Fiber Revenue Forecast by Region (2022-2027)
2.4.3 Global Ceramic Fiber Revenue Market Share by Region (2016-2027)
3 Global Ceramic Fiber by Manufacturers
3.1 Global Top Ceramic Fiber Manufacturers by Sales
3.1.1 Global Ceramic Fiber Sales by Manufacturer (2016-2021)
3.1.2 Global Ceramic Fiber Sales Market Share by Manufacturer (2016-2021)
3.2 Global Top Ceramic Fiber Manufacturers by Revenue
3.2.1 Global Ceramic Fiber Revenue by Manufacturer (2016-2021)
3.2.2 Global Ceramic Fiber Revenue Share by Manufacturer (2016-2021)
3.3 Global Ceramic Fiber Price by Manufacturer (2016-2021)
3.4 Competitive Landscape
3.4.1 Key Ceramic Fiber Manufacturers Covered: Ranking by Revenue
3.4.2 Global Ceramic Fiber Market Concentration Ratio (CR5 and HHI) & (2016-2021)
3.4.3 Global Ceramic Fiber Market Share by Company Type (Tier 1, Tier 2 and Tier 3)
3.5 Global Ceramic Fiber Manufacturing Base Distribution, Product Type
3.5.1 Ceramic Fiber Manufacturers Manufacturing Base Distribution, Headquarters
3.5.2 Manufacturers Ceramic Fiber Product Type
3.5.3 Date of International Manufacturers Enter into Ceramic Fiber Market
3.6 Manufacturers Mergers & Acquisitions, Expansion Plans
4 Company Profiles
4.1 Ibiden
4.1.1 Ibiden Corporation Information
4.1.2 Ibiden Description, Business Overview
4.1.3 Ibiden Ceramic Fiber Products Offered
4.1.4 Ibiden Ceramic Fiber Sales, Revenue and Gross Margin (2016-2021)
4.1.5 Ibiden Ceramic Fiber Revenue by Product
4.1.6 Ibiden Ceramic Fiber Revenue by Application
4.1.7 Ibiden Ceramic Fiber Revenue by Geographic Area
4.1.8 Ibiden Ceramic Fiber Revenue by Sales Channel
4.1.9 Ibiden Recent Development
4.2 Morgan Thermal Ceramics
4.2.1 Morgan Thermal Ceramics Corporation Information
4.2.2 Morgan Thermal Ceramics Description, Business Overview
4.2.3 Morgan Thermal Ceramics Ceramic Fiber Products Offered
4.2.4 Morgan Thermal Ceramics Ceramic Fiber Sales, Revenue and Gross Margin (2016-2021)
4.2.5 Morgan Thermal Ceramics Ceramic Fiber Revenue by Product
4.2.6 Morgan Thermal Ceramics Ceramic Fiber Revenue by Application
4.2.7 Morgan Thermal Ceramics Ceramic Fiber Revenue by Geographic Area
4.2.8 Morgan Thermal Ceramics Ceramic Fiber Revenue by Sales Channel
4.2.9 Morgan Thermal Ceramics Recent Development
4.3 Shandong Luyang Share
4.3.1 Shandong Luyang Share Corporation Information
4.3.2 Shandong Luyang Share Description, Business Overview
4.3.3 Shandong Luyang Share Ceramic Fiber Products Offered
4.3.4 Shandong Luyang Share Ceramic Fiber Sales, Revenue and Gross Margin (2016-2021)
4.3.5 Shandong Luyang Share Ceramic Fiber Revenue by Product
4.3.6 Shandong Luyang Share Ceramic Fiber Revenue by Application
4.3.7 Shandong Luyang Share Ceramic Fiber Revenue by Geographic Area
4.3.8 Shandong Luyang Share Ceramic Fiber Revenue by Sales Channel
4.3.9 Shandong Luyang Share Recent Development
4.4 Isolite Insulating Products
4.4.1 Isolite Insulating Products Corporation Information
4.4.2 Isolite Insulating Products Description, Business Overview
4.4.3 Isolite Insulating Products Ceramic Fiber Products Offered
4.4.4 Isolite Insulating Products Ceramic Fiber Sales, Revenue and Gross Margin (2016-2021)
4.4.5 Isolite Insulating Products Ceramic Fiber Revenue by Product
4.4.6 Isolite Insulating Products Ceramic Fiber Revenue by Application
4.4.7 Isolite Insulating Products Ceramic Fiber Revenue by Geographic Area
4.4.8 Isolite Insulating Products Ceramic Fiber Revenue by Sales Channel
4.4.9 Isolite Insulating Products Recent Development
4.5 Nutec Fibratec
4.5.1 Nutec Fibratec Corporation Information
4.5.2 Nutec Fibratec Description, Business Overview
4.5.3 Nutec Fibratec Ceramic Fiber Products Offered
4.5.4 Nutec Fibratec Ceramic Fiber Sales, Revenue and Gross Margin (2016-2021)
4.5.5 Nutec Fibratec Ceramic Fiber Revenue by Product
4.5.6 Nutec Fibratec Ceramic Fiber Revenue by Application
4.5.7 Nutec Fibratec Ceramic Fiber Revenue by Geographic Area
4.5.8 Nutec Fibratec Ceramic Fiber Revenue by Sales Channel
4.5.9 Nutec Fibratec Recent Development
4.6 Rath
4.6.1 Rath Corporation Information
4.6.2 Rath Description, Business Overview
4.6.3 Rath Ceramic Fiber Products Offered
4.6.4 Rath Ceramic Fiber Sales, Revenue and Gross Margin (2016-2021)
4.6.5 Rath Ceramic Fiber Revenue by Product
4.6.6 Rath Ceramic Fiber Revenue by Application
4.6.7 Rath Ceramic Fiber Revenue by Geographic Area
4.6.8 Rath Recent Development
4.7 Unifrax I LLC
4.7.1 Unifrax I LLC Corporation Information
4.7.2 Unifrax I LLC Description, Business Overview
4.7.3 Unifrax I LLC Ceramic Fiber Products Offered
4.7.4 Unifrax I LLC Ceramic Fiber Sales, Revenue and Gross Margin (2016-2021)
4.7.5 Unifrax I LLC Ceramic Fiber Revenue by Product
4.7.6 Unifrax I LLC Ceramic Fiber Revenue by Application
4.7.7 Unifrax I LLC Ceramic Fiber Revenue by Geographic Area
4.7.8 Unifrax I LLC Recent Development
4.8 Yeso Insulating Products Co. Ltd.
4.8.1 Yeso Insulating Products Co. Ltd. Corporation Information
4.8.2 Yeso Insulating Products Co. Ltd. Description, Business Overview
4.8.3 Yeso Insulating Products Co. Ltd. Ceramic Fiber Products Offered
4.8.4 Yeso Insulating Products Co. Ltd. Ceramic Fiber Sales, Revenue and Gross Margin (2016-2021)
4.8.5 Yeso Insulating Products Co. Ltd. Ceramic Fiber Revenue by Product
4.8.6 Yeso Insulating Products Co. Ltd. Ceramic Fiber Revenue by Application
4.8.7 Yeso Insulating Products Co. Ltd. Ceramic Fiber Revenue by Geographic Area
4.8.8 Yeso Insulating Products Co. Ltd. Recent Development
4.9 Thermost Thermotech Co. Ltd
4.9.1 Thermost Thermotech Co. Ltd Corporation Information
4.9.2 Thermost Thermotech Co. Ltd Description, Business Overview
4.9.3 Thermost Thermotech Co. Ltd Ceramic Fiber Products Offered
4.9.4 Thermost Thermotech Co. Ltd Ceramic Fiber Sales, Revenue and Gross Margin (2016-2021)
4.9.5 Thermost Thermotech Co. Ltd Ceramic Fiber Revenue by Product
4.9.6 Thermost Thermotech Co. Ltd Ceramic Fiber Revenue by Application
4.9.7 Thermost Thermotech Co. Ltd Ceramic Fiber Revenue by Geographic Area
4.9.8 Thermost Thermotech Co. Ltd Recent Development
4.10 Hongyang Refractory Materials
4.10.1 Hongyang Refractory Materials Corporation Information
4.10.2 Hongyang Refractory Materials Description, Business Overview
4.10.3 Hongyang Refractory Materials Ceramic Fiber Products Offered
4.10.4 Hongyang Refractory Materials Ceramic Fiber Sales, Revenue and Gross Margin (2016-2021)
4.10.5 Hongyang Refractory Materials Ceramic Fiber Revenue by Product
4.10.6 Hongyang Refractory Materials Ceramic Fiber Revenue by Application
4.10.7 Hongyang Refractory Materials Ceramic Fiber Revenue by Geographic Area
4.10.8 Hongyang Refractory Materials Recent Development
5 Breakdown Data by Type
5.1 Global Ceramic Fiber Sales by Type (2016-2027)
5.1.1 Global Ceramic Fiber Sales by Type (2016-2021)
5.1.2 Global Ceramic Fiber Sales Forecast by Type (2022-2027)
5.1.3 Global Ceramic Fiber Sales Market Share by Type (2016-2027)
5.2 Global Ceramic Fiber Revenue Forecast by Type (2016-2027)
5.2.1 Global Ceramic Fiber Revenue by Type (2016-2021)
5.2.2 Global Ceramic Fiber Revenue Forecast by Type (2022-2027)
5.2.3 Global Ceramic Fiber Revenue Market Share by Type (2016-2027)
5.3 Ceramic Fiber Average Selling Price (ASP) by Type (2016-2027)
6 Breakdown Data by Application
6.1 Global Ceramic Fiber Sales by Application (2016-2027)
6.1.1 Global Ceramic Fiber Sales by Application (2016-2021)
6.1.2 Global Ceramic Fiber Sales Forecast by Application (2022-2027)
6.1.3 Global Ceramic Fiber Sales Market Share by Application (2016-2027)
6.2 Global Ceramic Fiber Revenue Forecast by Application (2016-2027)
6.2.1 Global Ceramic Fiber Revenue by Application (2016-2021)
6.2.2 Global Ceramic Fiber Revenue Forecast by Application (2022-2027)
6.2.3 Global Ceramic Fiber Revenue Market Share by Application (2016-2027)
6.3 Ceramic Fiber Average Selling Price (ASP) by Application (2016-2027)
7 North America
7.1 North America Ceramic Fiber Market Size YoY Growth 2016-2027
7.2 North America Ceramic Fiber Market Facts & Figures by Country
7.2.1 North America Ceramic Fiber Sales by Country (2016-2027)
7.2.2 North America Ceramic Fiber Revenue by Country (2016-2027)
7.3 North America Ceramic Fiber Sales by Type
7.4 North America Ceramic Fiber Sales by Application
8 Asia-Pacific
8.1 Asia-Pacific Ceramic Fiber Market Size YoY Growth 2016-2027
8.2 Asia-Pacific Ceramic Fiber Market Facts & Figures by Region
8.2.1 Asia-Pacific Ceramic Fiber Sales by Region (2016-2027)
8.2.2 Asia-Pacific Ceramic Fiber Revenue by Region (2016-2027)
8.3 Asia-Pacific Ceramic Fiber Sales by Type
8.4 Asia-Pacific Ceramic Fiber Sales by Application
9 Europe
9.1 Europe Ceramic Fiber Market Size YoY Growth 2016-2027
9.2 Europe Ceramic Fiber Market Facts & Figures by Country
9.2.1 Europe Ceramic Fiber Sales by Country (2016-2027)
9.2.2 Europe Ceramic Fiber Revenue by Country (2016-2027)
9.3 Europe Ceramic Fiber Sales by Type
9.4 Europe Ceramic Fiber Sales by Application
10 Latin America
10.1 Latin America Ceramic Fiber Market Size YoY Growth 2016-2027
10.2 Latin America Ceramic Fiber Market Facts & Figures by Country
10.2.1 Latin America Ceramic Fiber Sales by Country (2016-2027)
10.2.2 Latin America Ceramic Fiber Revenue by Country (2016-2027)
10.3 Latin America Ceramic Fiber Sales by Type
10.4 Latin America Ceramic Fiber Sales by Application
11 Middle East and Africa
11.1 Middle East and Africa Ceramic Fiber Market Size YoY Growth 2016-2027
11.2 Middle East and Africa Ceramic Fiber Market Facts & Figures by Country
11.2.1 Middle East and Africa Ceramic Fiber Sales by Country (2016-2027)
11.2.2 Middle East and Africa Ceramic Fiber Revenue by Country (2016-2027)
11.3 Middle East and Africa Ceramic Fiber Sales by Type
11.4 Middle East and Africa Ceramic Fiber Sales by Application
12 Supply Chain and Sales Channel Analysis
12.1 Ceramic Fiber Supply Chain Analysis
12.2 Ceramic Fiber Key Raw Materials and Upstream Suppliers
12.3 Ceramic Fiber Clients Analysis
12.4 Ceramic Fiber Sales Channel and Sales Model Analysis
12.4.1 Ceramic Fiber Distribution Channel Analysis: Indirect Sales VS Direct Sales
12.4.2 Ceramic Fiber Distribution Channel Analysis: Online Sales VS Offline Sales
12.4.3 Ceramic Fiber Distributors
13 Market Dynamics
13.1 Ceramic Fiber Market Drivers
13.2 Ceramic Fiber Market Opportunities
13.3 Ceramic Fiber Market Challenges
13.4 Ceramic Fiber Market Restraints
13.5 Porter’s Five Forces Analysis
14 Research Findings and Conclusion
15 Appendix
15.1 Research Methodology
15.1.1 Methodology/Research Approach
15.1.2 Data Source
15.2 Author Details
15.3 Disclaimer
List of Tables
Table 1. Global Ceramic Fiber Market Size Growth Rate by Type (US$ Million): 2021 VS 2027
Table 2. Major Manufacturers of Ceramic Fiber Blanket
Table 3. Major Manufacturers of Ceramic Fiber Board
Table 4. Major Manufacturers of Ceramic Fiber Cotton
Table 5. Major Manufacturers of Non-Shaped Ceramic Fiber
Table 6. Global Ceramic Fiber Market Size Growth by Application (US$ Million): 2021 VS 2027
Table 7. Global Ceramic Fiber Market Size by Region (US$ Million): 2021 VS 2027
Table 8. Global Ceramic Fiber Sales by Region (2016-2021) & (K MT)
Table 9. Global Ceramic Fiber Sales Forecast by Region (2022-2027) & (K MT)
Table 10. Global Ceramic Fiber Revenue by Region (2016-2021) & (US$ Million)
Table 11. Global Ceramic Fiber Revenue Forecast by Region (2022-2027) & (US$ Million)
Table 12. Global Ceramic Fiber Sales by Manufacturer (2016-2021) & (K MT)
Table 13. Global Ceramic Fiber Sales Share by Manufacturer (2016-2021)
Table 14. Ceramic Fiber Revenue by Manufacturer (2016-2021) & (US$ Million)
Table 15. Ceramic Fiber Revenue Share by Manufacturer (2016-2021)
Table 16. Key Manufacturers Ceramic Fiber Price (2016-2021) & (USD/MT)
Table 17. Ranking of Global Top Ceramic Fiber Manufacturers by Revenue (US$ Million) in 2020
Table 18. Global Ceramic Fiber Manufacturers Market Concentration Ratio (CR5 and HHI) & (2016-2021)
Table 19. Global Ceramic Fiber by Company Type (Tier 1, Tier 2 and Tier 3) & (based on the Revenue in Ceramic Fiber as of 2020)
Table 20. Ceramic Fiber Manufacturers Manufacturing Base Distribution and Headquarters
Table 21. Manufacturers Ceramic Fiber Product Type
Table 22. Date of International Manufacturers Enter into Ceramic Fiber Market
Table 23. Manufacturers Mergers & Acquisitions, Expansion Plans
Table 24. Ibiden Corporation Information
Table 25. Ibiden Description and Business Overview
Table 26. Ibiden Ceramic Fiber Sales (K MT), Revenue (US$ Million), Price (USD/MT) and Gross Margin (2016-2021)
Table 27. Ibiden Ceramic Fiber Product
Table 28. Ibiden Ceramic Fiber Revenue (US$ Million) and Market Share by Product
Table 29. Ibiden Ceramic Fiber Revenue (US$ Million) and Market Share by Application
Table 30. Ibiden Ceramic Fiber Revenue (US$ Million) and Market Share by Geographic Area
Table 31. Ibiden Ceramic Fiber Revenue (US$ Million) and Market Share by Sales Channel
Table 32. Ibiden Recent Development
Table 33. Morgan Thermal Ceramics Corporation Information
Table 34. Morgan Thermal Ceramics Description and Business Overview
Table 35. Morgan Thermal Ceramics Ceramic Fiber Sales (K MT), Revenue (US$ Million), Price (USD/MT) and Gross Margin (2016-2021)
Table 36. Morgan Thermal Ceramics Ceramic Fiber Product
Table 37. Morgan Thermal Ceramics Ceramic Fiber Revenue (US$ Million) and Market Share by Product
Table 38. Morgan Thermal Ceramics Ceramic Fiber Revenue (US$ Million) and Market Share by Application
Table 39. Morgan Thermal Ceramics Ceramic Fiber Revenue (US$ Million) and Market Share by Geographic Area
Table 40. Morgan Thermal Ceramics Ceramic Fiber Revenue (US$ Million) and Market Share by Sales Channel
Table 41. Morgan Thermal Ceramics Recent Development
Table 42. Shandong Luyang Share Corporation Information
Table 43. Shandong Luyang Share Description and Business Overview
Table 44. Shandong Luyang Share Ceramic Fiber Sales (K MT), Revenue (US$ Million), Price (USD/MT) and Gross Margin (2016-2021)
Table 45. Shandong Luyang Share Ceramic Fiber Product
Table 46. Shandong Luyang Share Ceramic Fiber Revenue (US$ Million) and Market Share by Product
Table 47. Shandong Luyang Share Ceramic Fiber Revenue (US$ Million) and Market Share by Application
Table 48. Shandong Luyang Share Ceramic Fiber Revenue (US$ Million) and Market Share by Geographic Area
Table 49. Shandong Luyang Share Ceramic Fiber Revenue (US$ Million) and Market Share by Sales Channel
Table 50. Shandong Luyang Share Recent Development
Table 51. Isolite Insulating Products Corporation Information
Table 52. Isolite Insulating Products Description and Business Overview
Table 53. Isolite Insulating Products Ceramic Fiber Sales (K MT), Revenue (US$ Million), Price (USD/MT) and Gross Margin (2016-2021)
Table 54. Isolite Insulating Products Ceramic Fiber Product
Table 55. Isolite Insulating Products Ceramic Fiber Revenue (US$ Million) and Market Share by Product
Table 56. Isolite Insulating Products Ceramic Fiber Revenue (US$ Million) and Market Share by Application
Table 57. Isolite Insulating Products Ceramic Fiber Revenue (US$ Million) and Market Share by Geographic Area
Table 58. Isolite Insulating Products Ceramic Fiber Revenue (US$ Million) and Market Share by Sales Channel
Table 59. Isolite Insulating Products Recent Development
Table 60. Nutec Fibratec Corporation Information
Table 61. Nutec Fibratec Description and Business Overview
Table 62. Nutec Fibratec Ceramic Fiber Sales (K MT), Revenue (US$ Million), Price (USD/MT) and Gross Margin (2016-2021)
Table 63. Nutec Fibratec Ceramic Fiber Product
Table 64. Nutec Fibratec Ceramic Fiber Revenue (US$ Million) and Market Share by Product
Table 65. Nutec Fibratec Ceramic Fiber Revenue (US$ Million) and Market Share by Application
Table 66. Nutec Fibratec Ceramic Fiber Revenue (US$ Million) and Market Share by Geographic Area
Table 67. Nutec Fibratec Ceramic Fiber Revenue (US$ Million) and Market Share by Sales Channel
Table 68. Nutec Fibratec Recent Development
Table 69. Rath Corporation Information
Table 70. Rath Description and Business Overview
Table 71. Rath Ceramic Fiber Sales (K MT), Revenue (US$ Million), Price (USD/MT) and Gross Margin (2016-2021)
Table 72. Rath Ceramic Fiber Product
Table 73. Rath Ceramic Fiber Revenue (US$ Million) and Market Share by Product
Table 74. Rath Ceramic Fiber Revenue (US$ Million) and Market Share by Application
Table 75. Rath Ceramic Fiber Revenue (US$ Million) and Market Share by Geographic Area
Table 76. Rath Recent Development
Table 77. Unifrax I LLC Corporation Information
Table 78. Unifrax I LLC Description and Business Overview
Table 79. Unifrax I LLC Ceramic Fiber Sales (K MT), Revenue (US$ Million), Price (USD/MT) and Gross Margin (2016-2021)
Table 80. Unifrax I LLC Ceramic Fiber Product
Table 81. Unifrax I LLC Ceramic Fiber Revenue (US$ Million) and Market Share by Product
Table 82. Unifrax I LLC Ceramic Fiber Revenue (US$ Million) and Market Share by Application
Table 83. Unifrax I LLC Ceramic Fiber Revenue (US$ Million) and Market Share by Geographic Area
Table 84. Unifrax I LLC Recent Development
Table 85. Yeso Insulating Products Co. Ltd. Corporation Information
Table 86. Yeso Insulating Products Co. Ltd. Description and Business Overview
Table 87. Yeso Insulating Products Co. Ltd. Ceramic Fiber Sales (K MT), Revenue (US$ Million), Price (USD/MT) and Gross Margin (2016-2021)
Table 88. Yeso Insulating Products Co. Ltd. Ceramic Fiber Product
Table 89. Yeso Insulating Products Co. Ltd. Ceramic Fiber Revenue (US$ Million) and Market Share by Product
Table 90. Yeso Insulating Products Co. Ltd. Ceramic Fiber Revenue (US$ Million) and Market Share by Application
Table 91. Yeso Insulating Products Co. Ltd. Ceramic Fiber Revenue (US$ Million) and Market Share by Geographic Area
Table 92. Yeso Insulating Products Co. Ltd. Recent Development
Table 93. Thermost Thermotech Co. Ltd Corporation Information
Table 94. Thermost Thermotech Co. Ltd Description and Business Overview
Table 95. Thermost Thermotech Co. Ltd Ceramic Fiber Sales (K MT), Revenue (US$ Million), Price (USD/MT) and Gross Margin (2016-2021)
Table 96. Thermost Thermotech Co. Ltd Ceramic Fiber Product
Table 97. Thermost Thermotech Co. Ltd Ceramic Fiber Revenue (US$ Million) and Market Share by Product
Table 98. Thermost Thermotech Co. Ltd Ceramic Fiber Revenue (US$ Million) and Market Share by Application
Table 99. Thermost Thermotech Co. Ltd Ceramic Fiber Revenue (US$ Million) and Market Share by Geographic Area
Table 100. Thermost Thermotech Co. Ltd Recent Development
Table 101. Hongyang Refractory Materials Corporation Information
Table 102. Hongyang Refractory Materials Description and Business Overview
Table 103. Hongyang Refractory Materials Ceramic Fiber Sales (K MT), Revenue (US$ Million), Price (USD/MT) and Gross Margin (2016-2021)
Table 104. Hongyang Refractory Materials Ceramic Fiber Product
Table 105. Hongyang Refractory Materials Ceramic Fiber Revenue (US$ Million) and Market Share by Product
Table 106. Hongyang Refractory Materials Ceramic Fiber Revenue (US$ Million) and Market Share by Application
Table 107. Hongyang Refractory Materials Ceramic Fiber Revenue (US$ Million) and Market Share by Geographic Area
Table 108. Hongyang Refractory Materials Recent Development
Table 109. Global Ceramic Fiber Sales by Type (2016-2021) & (K MT)
Table 110. Global Ceramic Fiber Sales Forecast by Type (2022-2027) & (K MT)
Table 111. Global Ceramic Fiber Revenue by Type (2016-2021) & (US$ Million)
Table 112. Global Ceramic Fiber Revenue Forecast by Type (2022-2027) & (US$ Million)
Table 113. Global Ceramic Fiber Sales by Application (2016-2021) & (K MT)
Table 114. Global Ceramic Fiber Sales Forecast by Application (2022-2027) & (K MT)
Table 115. Global Ceramic Fiber Revenue by Application (2016-2021) & (US$ Million)
Table 116. Global Ceramic Fiber Revenue Forecast by Application (2022-2027) & (US$ Million)
Table 117. North America Ceramic Fiber Sales by Country (2016-2021) & (K MT)
Table 118. North America Ceramic Fiber Sales by Country (2022-2027) & (K MT)
Table 119. North America Ceramic Fiber Revenue by Country (2016-2021) & (US$ Million)
Table 120. North America Ceramic Fiber Revenue by Country (2022-2027) & (US$ Million)
Table 121. North America Ceramic Fiber Sales by Type (2016-2021) & (K MT)
Table 122. North America Ceramic Fiber Sales by Application (2016-2021) & (K MT)
Table 123. Asia-Pacific Ceramic Fiber Sales by Region (2016-2021) & (K MT)
Table 124. Asia-Pacific Ceramic Fiber Sales by Region (2022-2027) & (K MT)
Table 125. Asia-Pacific Ceramic Fiber Revenue by Region (2016-2027) & (US$ Million)
Table 126. Asia-Pacific Ceramic Fiber Revenue by Region (2022-2027) & (US$ Million)
Table 127. Asia-Pacific Ceramic Fiber Sales by Type (2016-2021) & (K MT)
Table 128. Asia-Pacific Ceramic Fiber Sales by Application (2016-2021) & (K MT)
Table 129. Europe Ceramic Fiber Sales by Country (2016-2021) & (K MT)
Table 130. Europe Ceramic Fiber Sales by Country (2022-2027) & (K MT)
Table 131. Europe Ceramic Fiber Revenue by Country (2016-2021) & (US$ Million)
Table 132. Europe Ceramic Fiber Revenue by Country (2022-2027) & (US$ Million)
Table 133. Europe Ceramic Fiber Sales by Type (2016-2021) & (K MT)
Table 134. Europe Ceramic Fiber Sales by Application (2016-2021) & (K MT)
Table 135. Latin America Ceramic Fiber Sales by Country (2016-2021) & (K MT)
Table 136. Latin America Ceramic Fiber Sales by Country (2022-2027) & (K MT)
Table 137. Latin America Ceramic Fiber Revenue by Country (2016-2021) & (US$ Million)
Table 138. Latin America Ceramic Fiber Revenue by Country (2022-2027) & (US$ Million)
Table 139. Latin America Ceramic Fiber Sales by Type (2016-2021) & (K MT)
Table 140. Latin America Ceramic Fiber Sales by Application (2016-2021) & (K MT)
Table 141. Middle East and Africa Ceramic Fiber Sales by Country (2016-2021) & (K MT)
Table 142. Middle East and Africa Ceramic Fiber Sales by Country (2022-2027) & (K MT)
Table 143. Middle East and Africa Ceramic Fiber Revenue by Country (2016-2021) & (US$ Million)
Table 144. Middle East and Africa Ceramic Fiber Revenue by Country (2022-2027) & (US$ Million)
Table 145. Middle East and Africa Ceramic Fiber Sales by Type (2016-2021) & (K MT)
Table 146. Middle East and Africa Ceramic Fiber Sales by Application (2016-2021) & (K MT)
Table 147. Ceramic Fiber Key Raw Materials, Industry Status and Trend
Table 148. Ceramic Fiber Key Raw Materials and Upstream Suppliers
Table 149. Ceramic Fiber Clients Status and Trend
Table 150. Ceramic Fiber Typical Clients
Table 151. Ceramic Fiber Distributors
Table 152. Key Drivers: Impact Analysis (2022-2027)
Table 153. Ceramic Fiber Market Drivers
Table 154. Ceramic Fiber Market Opportunities
Table 155. Ceramic Fiber Market Challenges
Table 156. Ceramic Fiber Market Restraints
Table 157. Ceramic Fiber Porter’s Five Forces Analysis
Table 158. Research Programs/Design for This Report
Table 159. Key Data Information from Secondary Sources
Table 160. Key Data Information from Primary Sources
List of Figures
Figure 1. Ceramic Fiber Product Picture
Figure 2. Global Ceramic Fiber Sales Market Share by Type in 2021 & 2027
Figure 3. Ceramic Fiber Blanket Product Picture
Figure 4. Ceramic Fiber Board Product Picture
Figure 5. Ceramic Fiber Cotton Product Picture
Figure 6. Non-Shaped Ceramic Fiber Product Picture
Figure 7. Global Ceramic Fiber Sales Market Share by Application in 2021 & 2027
Figure 8. Aerospace And Defense Examples
Figure 9. Chemical Examples
Figure 10. Steel Industry Examples
Figure 11. Electrical Appliances Examples
Figure 12. Others Examples
Figure 13. Ceramic Fiber Report Years Considered
Figure 14. Global Ceramic Fiber Market Size, (US$ Million), 2016 VS 2021 VS 2027
Figure 15. Global Ceramic Fiber Market Size 2016-2027 (US$ Million)
Figure 16. Global Ceramic Fiber Sales 2016-2027 (K Units)
Figure 17. Global Ceramic Fiber Market Size Market Share by Region: 2021 Versus 2027
Figure 18. Global Ceramic Fiber Sales Market Share Forecast by Region (2016-2027)
Figure 19. Global Ceramic Fiber Revenue Market Share by Region (2016-2027)
Figure 20. Global Ceramic Fiber Sales Share by Manufacturer in 2020
Figure 21. Ceramic Fiber Market Share by Company Type (Tier 1, Tier 2 and Tier 3): 2016 VS 2020
Figure 22. Global Ceramic Fiber Sales Market Share Forecast by Type (2016-2027)
Figure 23. Global Ceramic Fiber Revenue Market Share Forecast by Type (2016-2027)
Figure 24. Ceramic Fiber Average Selling Price (ASP) by Type (2016-2021) & (USD/Unit)
Figure 25. Global Ceramic Fiber Sales Market Share Forecast by Application (2016-2027)
Figure 26. Global Ceramic Fiber Revenue Market Share Forecast by Application (2016-2027)
Figure 27. Ceramic Fiber Average Selling Price (ASP) by Application (2016-2021) & (USD/Unit)
Figure 28. North America Ceramic Fiber Revenue 2016-2027 (US$ Million)
Figure 29. North America Ceramic Fiber Sales Market Share by Type (2016-2021)
Figure 30. North America Ceramic Fiber Sales Market Share by Application (2016-2021)
Figure 31. Asia-Pacific Ceramic Fiber Revenue 2016-2027 (US$ Million)
Figure 32. Asia-Pacific Ceramic Fiber Sales Market Share by Region (2016-2027)
Figure 33. Asia-Pacific Ceramic Fiber Revenue Market Share by Region (2016-2027)
Figure 34. Asia-Pacific Ceramic Fiber Sales Market Share by Type (2016-2021)
Figure 35. Asia-Pacific Ceramic Fiber Sales Market Share by Application (2016-2021)
Figure 36. Europe Ceramic Fiber Revenue Growth Rate 2016-2027 (US$ Million)
Figure 37. Europe Ceramic Fiber Sales Market Share by Country (2016-2027)
Figure 38. Europe Ceramic Fiber Revenue Market Share by Country (2016-2027)
Figure 39. Europe Ceramic Fiber Sales Market Share by Type (2016-2021)
Figure 40. Europe Ceramic Fiber Sales Market Share by Application (2016-2021)
Figure 41. Latin America Ceramic Fiber Revenue Growth Rate 2016-2027 (US$ Million)
Figure 42. Latin America Ceramic Fiber Sales Market Share by Country (2016-2027)
Figure 43. Latin America Ceramic Fiber Revenue Market Share by Country (2016-2021)
Figure 44. Latin America Ceramic Fiber Sales Market Share by Type (2016-2021)
Figure 45. Latin America Ceramic Fiber Sales Market Share by Application (2016-2021)
Figure 46. Middle East and Africa Ceramic Fiber Revenue Growth Rate 2016-2027 (US$ Million)
Figure 47. Middle East and Africa Ceramic Fiber Sales Market Share by Country (2016-2027)
Figure 48. Middle East and Africa Ceramic Fiber Revenue Market Share by Country (2016-2027)
Figure 49. Middle East and Africa Ceramic Fiber Sales Market Share by Type (2016-2021)
Figure 50. Middle East and Africa Ceramic Fiber Sales Market Share by Application (2016-2021)
Figure 51. Ceramic Fiber Supply Chain (Upstream and Downstream Market)
Figure 52. Global Production Market Share of Ceramic Fiber Raw Materials by Region in 2020
Figure 53. Ceramic Fiber Distribution Channels
Figure 54. Global Ceramic Fiber Percentage 2016-2027: Indirect Sales VS Direct Sales
Figure 55. Global Ceramic Fiber Percentage 2016-2027: Online Sales VS Offline Sales
Figure 56. Porter's Five Forces Analysis
Figure 57. Bottom-up and Top-down Approaches for This Report
Figure 58. Data Triangulation
Figure 59. Key Executives Interviewed

