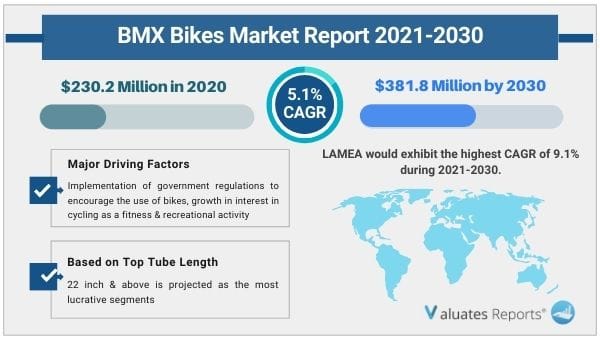
The global BMX bikes market was valued at USD 230.2 million in 2020 and is projected to reach USD 381.8 million by 2030, registering a CAGR of 5.1% from 2021 to 2030.
The adoption of government policies to promote bicycle use, the rise in popularity of cycling as a sport and leisure activity, and consumer preference for e-bikes as an efficient and eco-friendly mode of transportation all have a favorable impact on the development of the worldwide BMX bike market.

BMX bikes are particularly made of recreational bicycles used for stunt riding and off-road racing. BMX bikes are made with lightweight materials and are more efficient to ride than other types of bikes. Different manufacturers have released a wide variety of BMX models, which has aided in the BMX bike market expansion.
Additionally, during the anticipated period, the rising use of BMX bikes in various recreational pursuits will support the BMX bike market expansion. Many businesses, including Mafiabike, Pacific Cycle Inc., Haro Bikes, and others, have been active in the global BMX bikes market and are eager to provide goods with various features, fueling the market's expansion over the course of the projected period.
Governments all around the world are taking steps to reduce traffic congestion caused by vehicles and are leaning toward employing green energy for transportation. This has contributed to the global bicycle market's expansion. Manufacturers of BMX bikes, including GT Bicycles, Redline Bicycles, Mongoose, Haro, Elite BMX, and others, produced different BMX bike-related innovations that aided in the expansion of the world BMX bike market.
Cycling is regarded as a safe and low-impact activity with numerous advantages for both physical and mental health, including increased stamina, reduced stress, enhanced muscle strength, and improved cardiovascular fitness. A further factor contributing to the market's growth is the introduction of folding bikes, which can be folded in order to be stored anywhere due to the lack of parking spaces. Thus, the global BMX bike market is expanding due to the increase in interest in cycling as a sport and form of exercise.
Because of increased traffic congestion and rising consumer inclination to avoid using cars, urbanization is expected to increase, creating an attractive potential for market expansion. The bicycle infrastructure has also benefited from several expansion and product launch initiatives from manufacturers. For example, Bickerton Portables expanded in the UK and Ireland in August 2020 to sell their bicycle models to clients, which supports the market's expansion.
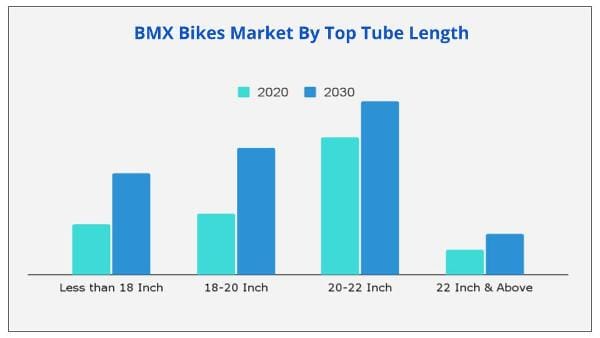
By top tube length, the 22 inch & above segment is expected to register a significant growth during the forecast period.

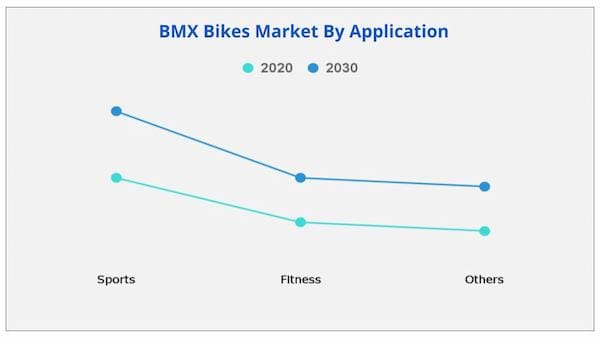
The most profitable category is anticipated to be fitness by application.

The region with the highest CAGR over 2021–2030 would be LAMEA, at 9.1%.
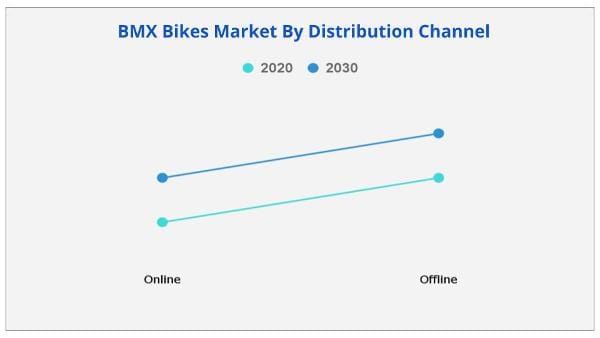
On the basis of distribution channel, the online segment is projected to lead the global BMX bikes market, owing to higher CAGR as compared to other segments.

Covid-19 Impact Analysis
Key Benefits For Stakeholders
Key Market Segments
By Top Tube Length
By Application
By Distribution Channel
By Region
Key Players
| Report Metric | Details |
| Report Name | Polyamide Market |
| The market size in 2020 | 230.2 Million USD |
| The revenue forecast in 2030 | 381.8 Million USD |
| Growth Rate | CAGR of 5.1% from 2021 to 2030 |
| Market size available for years | 2021-2030 |
| Forecast units | Value (USD) |
| Segments covered | Top Tube Length, Price, Application, and Distribution Channel and Region |
| Report coverage | Revenue & volume forecast, company share, competitive landscape, growth factors, and trends |
| Geographic regions covered | North America, Europe, Asia Pacific, Latin America, Middle East & Africa |
Ans. The global BMX bikes market was valued at $230.2 million in 2020 and is projected to reach $381.8 million by 2030, registering a CAGR of 5.1% from 2021 to 2030.
Ans. The market is set to increase Post Covid due to the removal of restrictions on sports activities
Ans. LAMEA will provide more business opportunities for BMX bikes in future.
Ans. Incrreased adoption of sporting activities followed by the need to stay healty drives the growth of the market.
Table of Content
CHAPTER 1:INTRODUCTION
1.1.Report description
1.2.Key benefits for stakeholders
1.3.Key market segments
1.4.Research methodology
1.4.1.Primary research
1.4.2.Secondary research
1.4.3.Analyst tools and models
CHAPTER 2:EXECUTIVE SUMMARY
2.1.CXO perspective
CHAPTER 3:MARKET OVERVIEW
3.1.Market definition and scope
3.2.Key findings
3.2.1.Top impacting factors
3.2.2.Top investment pockets
3.3.Porter’s five forces analysis
3.3.1.Moderate-to-high bargaining power of suppliers
3.3.2.Low-to-moderate threat of new entrants
3.3.3.Low-to-high threat of substitutes
3.3.4.Moderate-to-high intensity of rivalry
3.3.5.Moderate bargaining power of buyers
3.4.Market share analysis, 2020 (%)
3.5.Key player positioning, 2020
3.6.Competitive Landscape
3.6.1.Competitive dashboard
3.6.2.Value chain analysis
3.7.Market dynamics
3.7.1.Drivers
3.7.1.1.Implementation of government regulations to encourage the use of bikes
3.7.1.2.Growth in interest in cycling as a fitness & recreational activity
3.7.1.3.Consumer inclination toward use of e-bikes as an eco-friendly & efficient solution for commute
3.7.2.Restraints
3.7.2.1.High cost of bikes
3.7.3.Opportunities
3.7.3.1.Improvement in bicycling infrastructure
3.7.3.2.Rising trend for connected bicycles
3.8.COVID-19 Impact Analysis
3.8.1.Evolution of outbreaks
3.8.1.1.SARS
3.8.1.2.COVID-19
3.8.2.Micro-economic impact analysis
3.8.2.1.Consumer trend
3.8.2.2.Technology trend
3.8.2.3.Regulatory trend
3.8.3.Macro-economic impact analysis
3.8.3.1.GDP
3.8.3.2.Import/export analysis
3.8.3.3.Employment index
3.8.4.Impact on the BMX bikes industry analysis
CHAPTER 4:BMX BIKES MARKET, BY TOP TUBE LENGTH
4.1.Overview
4.2.Less than 18 Inch
4.2.1.Key market trends, growth factors and opportunities
4.2.2.Market size and forecast, by region
4.2.3.Market analysis by country
4.3.18-20 Inch
4.3.1.Key market trends, growth factors and opportunities
4.3.2.Market size and forecast, by region
4.3.3.Market analysis by country
4.4.20-22 inch
4.4.1.Key market trends, growth factors and opportunities
4.4.2.Market size and forecast, by region
4.4.3.Market analysis by country
4.5.22 Inch & above
4.5.1.Key market trends, growth factors and opportunities
4.5.2.Market size and forecast, by region
4.5.3.Market analysis by country
CHAPTER 5:BMX BIKES MARKET, BY APPLICATION
5.1.Overview
5.2.Sports
5.2.1.Key market trends, growth factors and opportunities
5.2.2.Market size and forecast, by region
5.2.3.Market size and forecast, by distribution channel
5.2.4.Market analysis by country
5.3.Fitness
5.3.1.Key market trends, growth factors and opportunities
5.3.2.Market size and forecast, by region
5.3.3.Market size and forecast, by distribution channel
5.3.4.Market analysis by country
5.4.Others
5.4.1.Key market trends, growth factors and opportunities
5.4.2.Market size and forecast, by region
5.4.3.Market size and forecast, by distribution channel
5.4.4.Market analysis by country
CHAPTER 6:BMX BIKES MARKET, BY DISTRIBUTION CHANNEL
6.1.Overview
6.2.Online
6.2.1.Key market trends, growth factors and opportunities
6.2.2.Market size and forecast, by region
6.2.3.Market analysis by country
6.3.Offline
6.3.1.Key market trends, growth factors and opportunities
6.3.2.Market size and forecast, by region
6.3.3.Market analysis by country
CHAPTER 7:BMX BIKES MARKET, BY REGION
7.1.Overview
7.2.North America
7.2.1.Key market trends, growth factors, and opportunities
7.2.2.Market size and forecast, by top tube length
7.2.3.Market size and forecast, by application
7.2.4.Market size and forecast, by distribution channel
7.2.5.North America sports BMX bikes market, by distribution channel, 2020-2030, ($Thousand)
7.2.6.North America fitness BMX bikes market, by distribution channel, 2020-2030, ($Thousand)
7.2.7.North America others BMX bikes market, by distribution channel, 2020-2030, ($Thousand)
7.2.8.Market analysis by country
7.2.8.1.U.S.
7.2.8.1.1.Market size and forecast, by top tube length
7.2.8.1.2.Market size and forecast, by application
7.2.8.1.3.Market size and forecast, by distribution channel
7.2.8.2.Canada
7.2.8.2.1.Market size and forecast, by top tube length
7.2.8.2.2.Market size and forecast, by application
7.2.8.2.3.Market size and forecast, by distribution channel
7.2.8.3.Mexico
7.2.8.3.1.Market size and forecast, by top tube length
7.2.8.3.2.Market size and forecast, by application
7.2.8.3.3.Market size and forecast, by distribution channel
7.3.Europe
7.3.1.Key market trends, growth factors, and opportunities
7.3.2.Market size and forecast, by top tube length
7.3.3.Market size and forecast, by application
7.3.4.Market size and forecast, by distribution channel
7.3.5.Europe sports BMX bikes market, by distribution channel, 2020-2030, ($Thousand)
7.3.6.Europe fitness BMX bikes market, by distribution channel, 2020-2030, ($Thousand)
7.3.7.Europe others BMX bikes market, by distribution channel, 2020-2030, ($Thousand)
7.3.8.Market analysis by country
7.3.8.1.UK
7.3.8.1.1.Market size and forecast, by top tube length
7.3.8.1.2.Market size and forecast, by application
7.3.8.1.3.Market size and forecast, by distribution channel
7.3.8.2.Germany
7.3.8.2.1.Market size and forecast, by top tube length
7.3.8.2.2.Market size and forecast, by application
7.3.8.2.3.Market size and forecast, by distribution channel
7.3.8.3.France
7.3.8.3.1.Market size and forecast, by top tube length
7.3.8.3.2.Market size and forecast, by application
7.3.8.3.3.Market size and forecast, by distribution channel
7.3.8.4.Italy
7.3.8.4.1.Market size and forecast, by top tube length
7.3.8.4.2.Market size and forecast, by application
7.3.8.4.3.Market size and forecast, by distribution channel
7.3.8.5.Rest of Europe
7.3.8.5.1.Market size and forecast, by top tube length
7.3.8.5.2.Market size and forecast, by application
7.3.8.5.3.Market size and forecast, by distribution channel
7.4.Asia-Pacific
7.4.1.Key market trends, growth factors, and opportunities
7.4.2.Market size and forecast, by top tube length
7.4.3.Market size and forecast, by application
7.4.4.Market size and forecast, by distribution channel
7.4.5.Asia-Pacific sports BMX bikes market, by distribution channel, 2020-2030, ($Thousand)
7.4.6.Asia-Pacific fitness BMX bikes market, by distribution channel, 2020-2030, ($Thousand)
7.4.7.Asia-Pacific others BMX bikes market, by distribution channel, 2020-2030, ($Thousand)
7.4.8.Market analysis by country
7.4.8.1.China
7.4.8.1.1.Market size and forecast, by top tube length
7.4.8.1.2.Market size and forecast, by application
7.4.8.1.3.Market size and forecast, by distribution channel
7.4.8.2.Japan
7.4.8.2.1.Market size and forecast, by top tube length
7.4.8.2.2.Market size and forecast, by application
7.4.8.2.3.Market size and forecast, by distribution channel
7.4.8.3.India
7.4.8.3.1.Market size and forecast, by top tube length
7.4.8.3.2.Market size and forecast, by application
7.4.8.3.3.Market size and forecast, by distribution channel
7.4.8.4.Australia
7.4.8.4.1.Market size and forecast, by top tube length
7.4.8.4.2.Market size and forecast, by application
7.4.8.4.3.Market size and forecast, by distribution channel
7.4.8.5.Rest of Asia-Pacific
7.4.8.5.1.Market size and forecast, by top tube length
7.4.8.5.2.Market size and forecast, by application
7.4.8.5.3.Market size and forecast, by distribution channel
7.5.LAMEA
7.5.1.Key market trends, growth factors, and opportunities
7.5.2.Market size and forecast, by top tube length
7.5.3.Market size and forecast, by application
7.5.4.Market size and forecast, by distribution channel
7.5.5.LAMEA sports BMX bikes market, by distribution channel, 2020-2030, ($Thousand)
7.5.6.LAMEA fitness BMX bikes market, by distribution channel, 2020-2030, ($Thousand)
7.5.7.LAMEA others BMX bikes market, by distribution channel, 2020-2030, ($Thousand)
7.5.8.Market analysis by country
7.5.8.1.Latin America
7.5.8.1.1.Market size and forecast, by top tube length
7.5.8.1.2.Market size and forecast, by application
7.5.8.1.3.Market size and forecast, by distribution channel
7.5.8.2.Middle East
7.5.8.2.1.Market size and forecast, by top tube length
7.5.8.2.2.Market size and forecast, by application
7.5.8.2.3.Market size and forecast, by distribution channel
7.5.8.3.Africa
7.5.8.3.1.Market size and forecast, by top tube length
7.5.8.3.2.Market size and forecast, by application
7.5.8.3.3.Market size and forecast, by distribution channel
CHAPTER 8:COMPANY PROFILES
8.1.CULT CREW
8.1.1.Company overview
8.1.2.Company snapshot
8.1.3.Product portfolio
8.2.Elitebmx
8.2.1.Company overview
8.2.2.Company snapshot
8.2.3.Product portfolio
8.3.Fitbikeco.
8.3.1.Company overview
8.3.2.Company snapshot
8.3.3.Product portfolio
8.4.GT Bicycles
8.4.1.Company overview
8.4.2.Company snapshot
8.4.3.Product portfolio
8.4.4.Key strategic moves and developments
8.5.Haro Bikes
8.5.1.Company overview
8.5.2.Company snapshot
8.5.3.Product portfolio
8.5.4.Key strategic moves and developments
8.6.Kink BMX
8.6.1.Company overview
8.6.2.Company snapshot
8.6.3.Product portfolio
8.7.Mafiabike
8.7.1.Company overview
8.7.2.Company snapshot
8.7.3.Product portfolio
8.8.PACIFIC CYCLES
8.8.1.Company overview
8.8.2.Company snapshot
8.8.3.Product portfolio
8.9.Redline Bicycles
8.9.1.Company overview
8.9.2.Company snapshot
8.9.3.Product portfolio
8.10.Stolen Brand
8.10.1.Company overview
8.10.2.Company snapshot
8.10.3.Product portfolio
LIST OF TABLES
TABLE 01.MACRO-ECONOMIC INDICATORS PROJECTIONS (1/2):
TABLE 02.MACRO-ECONOMIC INDICATORS PROJECTIONS (2/2):
TABLE 03.GLOBAL BMX BIKES MARKET, BY TOP TUBE LENGTH, 2020-2030 ($MILLION)
TABLE 04.BMX BIKES MARKET REVENUE FOR LESS THAN 18 INCH, BY REGION 2020–2030 ($THOUSANDS)
TABLE 05.BMX BIKES MARKET REVENUE FOR 18-20 INCH, BY REGION 2020–2030 ($THOUSANDS)
TABLE 06.BMX BIKES MARKET REVENUE FOR 20-22 INCH, BY REGION 2020–2030 ($THOUSANDS)
TABLE 07.BMX BIKES MARKET REVENUE FOR 22 INCH & ABOVE, BY REGION 2020–2030 ($THOUSANDS)
TABLE 08.GLOBAL BMX BIKES MARKET, BY APPLICATION, 2020-2030 ($THOUSANDS)
TABLE 09.BMX BIKES MARKET REVENUE FOR SPORTS, BY REGION 2020–2030 ($THOUSANDS)
TABLE 10.BMX BIKES MARKET REVENUE FOR SPORTS BY DISTRIBUTION CHANNEL, 2020–2030 ($THOUSANDS)
TABLE 11.BMX BIKES MARKET REVENUE FOR FITNESS, BY REGION 2020–2030 ($THOUSANDS)
TABLE 12.BMX BIKES MARKET REVENUE FOR FITNESS BY DISTRIBUTION CHANNEL, 2020–2030 ($THOUSANDS)
TABLE 13.BMX BIKES MARKET REVENUE FOR OTHERS, BY REGION 2020–2030 ($THOUSANDS)
TABLE 14.BMX BIKES MARKET REVENUE FOR OTHERS BY DISTRIBUTION CHANNEL, 2020–2030 ($THOUSANDS)
TABLE 15.GLOBAL BMX BIKES MARKET, BY DISTRIBUTION CHANNEL, 2020-2030 ($THOUSANDS)
TABLE 16.BMX BIKES MARKET REVENUE FOR ONLINE, BY REGION 2020–2030 ($THOUSANDS)
TABLE 17.BMX BIKES MARKET REVENUE FOR OFFLINE, BY REGION 2020–2030 ($THOUSANDS)
TABLE 18.NORTH AMERICA BMX BIKES MARKET, BY TOP TUBE LENGTH, 2020–2030 ($THOUSANDS)
TABLE 19.NORTH AMERICA BMX BIKES MARKET, BY APPLICATION, 2020–2030 ($THOUSANDS)
TABLE 20.NORTH AMERICA BMX BIKES MARKET, BY DISTRIBUTION CHANNEL, 2020–2030 ($THOUSANDS)
TABLE 21.NORTH AMERICA SPORTS BMX BIKES MARKET, BY DISTRIBUTION CHANNEL, 2020–2030 ($THOUSANDS)
TABLE 22.NORTH AMERICA FITNESS BMX BIKES MARKET, BY DISTRIBUTION CHANNEL, 2020–2030 ($THOUSANDS)
TABLE 23.NORTH AMERICA OTHERS BMX BIKES MARKET, BY DISTRIBUTION CHANNEL, 2020–2030 ($THOUSANDS)
TABLE 24.U.S. BMX BIKES MARKET, BY TOP TUBE LENGTH, 2020–2030 ($THOUSANDS)
TABLE 25.U.S. BMX BIKES MARKET, BY APPLICATION, 2020–2030 ($THOUSANDS)
TABLE 26.U.S. BMX BIKES MARKET, BY DISTRIBUTION CHANNEL, 2020–2030 ($THOUSANDS)
TABLE 27.CANADA BMX BIKES MARKET, BY TOP TUBE LENGTH, 2020–2030 ($THOUSANDS)
TABLE 28.CANADA BMX BIKES MARKET, BY APPLICATION, 2020–2030 ($THOUSANDS)
TABLE 29.CANADA BMX BIKES MARKET, BY DISTRIBUTION CHANNEL, 2020–2030 ($THOUSANDS)
TABLE 30.MEXICO BMX BIKES MARKET, BY TOP TUBE LENGTH, 2020–2030 ($THOUSANDS)
TABLE 31.MEXICO BMX BIKES MARKET, BY APPLICATION, 2020–2030 ($THOUSANDS)
TABLE 32.MEXICO BMX BIKES MARKET, BY DISTRIBUTION CHANNEL, 2020–2030 ($THOUSANDS)
TABLE 33.EUROPE BMX BIKES MARKET, BY TOP TUBE LENGTH, 2020–2030 ($THOUSANDS)
TABLE 34.EUROPE BMX BIKES MARKET, BY APPLICATION, 2020–2030 ($THOUSANDS)
TABLE 35.EUROPE BMX BIKES MARKET, BY DISTRIBUTION CHANNEL, 2020–2030 ($THOUSANDS)
TABLE 36.EUROPE SPORTS BMX BIKES MARKET, BY DISTRIBUTION CHANNEL, 2020–2030 ($THOUSANDS)
TABLE 37.EUROPE FITNESS BMX BIKES MARKET, BY DISTRIBUTION CHANNEL, 2020–2030 ($THOUSANDS)
TABLE 38.EUROPE OTHERS BMX BIKES MARKET, BY DISTRIBUTION CHANNEL, 2020–2030 ($THOUSANDS)
TABLE 39.UK BMX BIKES MARKET, BY TOP TUBE LENGTH, 2020–2030 ($THOUSANDS)
TABLE 40.UK BMX BIKES MARKET, BY APPLICATION, 2020–2030 ($THOUSANDS)
TABLE 41.UK BMX BIKES MARKET, BY DISTRIBUTION CHANNEL, 2020–2030 ($THOUSANDS)
TABLE 42.GERMANY BMX BIKES MARKET, BY TOP TUBE LENGTH, 2020–2030 ($THOUSANDS)
TABLE 43.GERMANY BMX BIKES MARKET, BY APPLICATION, 2020–2030 ($THOUSANDS)
TABLE 44.GERMANY BMX BIKES MARKET, BY DISTRIBUTION CHANNEL, 2020–2030 ($THOUSANDS)
TABLE 45.FRANCE BMX BIKES MARKET, BY TOP TUBE LENGTH, 2020–2030 ($THOUSANDS)
TABLE 46.FRANCE BMX BIKES MARKET, BY APPLICATION, 2020–2030 ($THOUSANDS)
TABLE 47.FRANCE BMX BIKES MARKET, BY DISTRIBUTION CHANNEL, 2020–2030 ($THOUSANDS)
TABLE 48.ITALY BMX BIKES MARKET, BY TOP TUBE LENGTH, 2020–2030 ($THOUSANDS)
TABLE 49.ITALY BMX BIKES MARKET, BY APPLICATION, 2020–2030 ($THOUSANDS)
TABLE 50.ITALY BMX BIKES MARKET, BY DISTRIBUTION CHANNEL, 2020–2030 ($THOUSANDS)
TABLE 51.REST OF EUROPE BMX BIKES MARKET, BY TOP TUBE LENGTH, 2020–2030 ($THOUSANDS)
TABLE 52.REST OF EUROPE BMX BIKES MARKET, BY APPLICATION, 2020–2030 ($THOUSANDS)
TABLE 53.REST OF EUROPE BMX BIKES MARKET, BY DISTRIBUTION CHANNEL, 2020–2030 ($THOUSANDS)
TABLE 54.ASIA-PACIFIC BMX BIKES MARKET, BY TOP TUBE LENGTH, 2020–2030 ($THOUSANDS)
TABLE 55.ASIA-PACIFIC BMX BIKES MARKET, BY APPLICATION, 2020–2030 ($THOUSANDS)
TABLE 56.ASIA-PACIFIC BMX BIKES MARKET, BY DISTRIBUTION CHANNEL, 2020–2030 ($THOUSANDS)
TABLE 57.ASIA-PACIFIC SPORTS BMX BIKES MARKET, BY DISTRIBUTION CHANNEL, 2020–2030 ($THOUSANDS)
TABLE 58.ASIA-PACIFIC FITNESS BMX BIKES MARKET, BY DISTRIBUTION CHANNEL, 2020–2030 ($THOUSANDS)
TABLE 59.ASIA-PACIFIC OTHERS BMX BIKES MARKET, BY DISTRIBUTION CHANNEL, 2020–2030 ($THOUSANDS)
TABLE 60.CHINA BMX BIKES MARKET, BY TOP TUBE LENGTH, 2020–2030 ($THOUSANDS)
TABLE 61.CHINA BMX BIKES MARKET, BY APPLICATION, 2020–2030 ($THOUSANDS)
TABLE 62.CHINA BMX BIKES MARKET, BY DISTRIBUTION CHANNEL, 2020–2030 ($THOUSANDS)
TABLE 63.JAPAN BMX BIKES MARKET, BY TOP TUBE LENGTH, 2020–2030 ($THOUSANDS)
TABLE 64.JAPAN BMX BIKES MARKET, BY APPLICATION, 2020–2030 ($THOUSANDS)
TABLE 65.JAPAN BMX BIKES MARKET, BY DISTRIBUTION CHANNEL, 2020–2030 ($THOUSANDS)
TABLE 66.INDIA BMX BIKES MARKET, BY TOP TUBE LENGTH, 2020–2030 ($THOUSANDS)
TABLE 67.INDIA BMX BIKES MARKET, BY APPLICATION, 2020–2030 ($THOUSANDS)
TABLE 68.INDIA BMX BIKES MARKET, BY DISTRIBUTION CHANNEL, 2020–2030 ($THOUSANDS)
TABLE 69.AUSTRALIA BMX BIKES MARKET, BY TOP TUBE LENGTH, 2020–2030 ($THOUSANDS)
TABLE 70.AUSTRALIA BMX BIKES MARKET, BY APPLICATION, 2020–2030 ($THOUSANDS)
TABLE 71.AUSTRALIA BMX BIKES MARKET, BY DISTRIBUTION CHANNEL, 2020–2030 ($THOUSANDS)
TABLE 72.REST OF ASIA-PACIFIC BMX BIKES MARKET, BY TOP TUBE LENGTH, 2020–2030 ($THOUSANDS)
TABLE 73.REST OF ASIA-PACIFIC BMX BIKES MARKET, BY APPLICATION, 2020–2030 ($THOUSANDS)
TABLE 74.REST OF ASIA-PACIFIC BMX BIKES MARKET, BY DISTRIBUTION CHANNEL, 2020–2030 ($THOUSANDS)
TABLE 75.LAMEA BMX BIKES MARKET, BY TOP TUBE LENGTH, 2020–2030 ($THOUSANDS)
TABLE 76.LAMEA BMX BIKES MARKET, BY APPLICATION, 2020–2030 ($THOUSANDS)
TABLE 77.LAMEA BMX BIKES MARKET, BY DISTRIBUTION CHANNEL, 2020–2030 ($THOUSANDS)
TABLE 78.LAMEA SPORTS BMX BIKES MARKET, BY DISTRIBUTION CHANNEL, 2020–2030 ($THOUSANDS)
TABLE 79.LAMEA FITNESS BMX BIKES MARKET, BY DISTRIBUTION CHANNEL, 2020–2030 ($THOUSANDS)
TABLE 80.LAMEA OTHERS BMX BIKES MARKET, BY DISTRIBUTION CHANNEL, 2020–2030 ($THOUSANDS)
TABLE 81.LATIN AMERICA BMX BIKES MARKET, BY TOP TUBE LENGTH, 2020–2030 ($THOUSANDS)
TABLE 82.LATIN AMERICA BMX BIKES MARKET, BY APPLICATION, 2020–2030 ($THOUSANDS)
TABLE 83.LATIN AMERICA BMX BIKES MARKET, BY DISTRIBUTION CHANNEL, 2020–2030 ($THOUSANDS)
TABLE 84.MIDDLE EAST BMX BIKES MARKET, BY TOP TUBE LENGTH, 2020–2030 ($THOUSANDS)
TABLE 85.MIDDLE EAST BMX BIKES MARKET, BY APPLICATION, 2020–2030 ($THOUSANDS)
TABLE 86.MIDDLE EAST BMX BIKES MARKET, BY DISTRIBUTION CHANNEL, 2020–2030 ($THOUSANDS)
TABLE 87.AFRICA BMX BIKES MARKET, BY TOP TUBE LENGTH, 2020–2030 ($THOUSANDS)
TABLE 88.AFRICA BMX BIKES MARKET, BY APPLICATION, 2020–2030 ($THOUSANDS)
TABLE 89.AFRICA BMX BIKES MARKET, BY DISTRIBUTION CHANNEL, 2020–2030 ($THOUSANDS)
TABLE 90.CULT CREW: COMPANY SNAPSHOT
TABLE 91.CULT CREW EYLAND: PRODUCT PORTFOLIO
TABLE 92.ELITEBMX: COMPANY SNAPSHOT
TABLE 93.ELITEBMX: PRODUCT PORTFOLIO
TABLE 94.FITBIKECO.: COMPANY SNAPSHOT
TABLE 95.FITBIKECO.: PRODUCT PORTFOLIO
TABLE 96.GT BICYCLES: COMPANY SNAPSHOT
TABLE 97.GT BICYCLES: PRODUCT PORTFOLIO
TABLE 98.GT BICYCLES: KEY STRATEGIC MOVES AND DEVELOPMENTS
TABLE 99.HARO BIKES: COMPANY SNAPSHOT
TABLE 100.HARO BIKES: PRODUCT PORTFOLIO
TABLE 101.HARO BIKES: KEY STRATEGIC MOVES AND DEVELOPMENTS
TABLE 102.KINK BMX: COMPANY SNAPSHOT
TABLE 103.KINK BMX: PRODUCT PORTFOLIO
TABLE 104.MAFIABIKES: COMPANY SNAPSHOT
TABLE 105.MAFIABIKES: PRODUCT PORTFOLIO
TABLE 106.PACIFIC CYCLES: COMPANY SNAPSHOT
TABLE 107.PACIFIC CYCLES: PRODUCT PORTFOLIO
TABLE 108.REDLINE BICYCLES: COMPANY SNAPSHOT
TABLE 109.REDLINE BICYCLES: PRODUCT PORTFOLIO
TABLE 110.STOLEN BRAND: COMPANY SNAPSHOT
TABLE 111.STOLEN BRAND: PRODUCT PORTFOLIO
LIST OF FIGURES
FIGURE 01.KEY MARKET SEGMENTS
FIGURE 02.EXECUTIVE SUMMARY
FIGURE 03.EXECUTIVE SUMMARY
FIGURE 04.TOP IMPACTING FACTORS
FIGURE 05.TOP INVESTMENT POCKETS
FIGURE 06.MARKET SHARE ANALYSIS, 2020 (%)
FIGURE 07.KEY PLAYER POSITIONING, 2020
FIGURE 08.COMPETITIVE DASHBOARD OF TOP 10 KEY PLAYERS (1/2):
FIGURE 09.COMPETITIVE DASHBOARD OF TOP 10 KEY PLAYERS (2/2):
FIGURE 10.VALUE CHAIN ANALYSIS
FIGURE 11.GLOBAL BMX BIKES MARKET, BY TOP TUBE LENGTH, 2020-2030
FIGURE 12.COMPARATIVE SHARE ANALYSIS OF BMX BIKES MARKET FOR LESS THAN 18 INCH, BY COUNTRY, 2020 & 2030 ($THOUSANDS)
FIGURE 13.COMPARATIVE SHARE ANALYSIS OF BMX BIKES MARKET FOR 18-20 INCH, BY COUNTRY, 2020 & 2030 ($THOUSANDS)
FIGURE 14.COMPARATIVE SHARE ANALYSIS OF BMX BIKES MARKET FOR 20-22 INCH, BY COUNTRY, 2020 & 2030 ($THOUSANDS)
FIGURE 15.COMPARATIVE SHARE ANALYSIS OF BMX BIKES MARKET FOR 22 INCH & ABOVE, BY COUNTRY, 2020 & 2030 ($THOUSANDS)
FIGURE 16.GLOBAL BMX BIKES MARKET, BY APPLICATION, 2020-2030
FIGURE 17.COMPARATIVE SHARE ANALYSIS OF BMX BIKES MARKET FOR SPORTS, BY COUNTRY, 2020 & 2030 ($THOUSANDS)
FIGURE 18.COMPARATIVE SHARE ANALYSIS OF BMX BIKES MARKET FOR FITNESS, BY COUNTRY, 2020 & 2030 ($THOUSANDS)
FIGURE 19.COMPARATIVE SHARE ANALYSIS OF BMX BIKES MARKET FOR OTHERS, BY COUNTRY, 2020 & 2030 ($THOUSANDS)
FIGURE 20.GLOBAL BMX BIKES MARKET, BY DISTRIBUTION CHANNEL, 2020-2030
FIGURE 21.COMPARATIVE SHARE ANALYSIS OF BMX BIKES MARKET FOR ONLINE, BY COUNTRY, 2020 & 2030 ($THOUSANDS)
FIGURE 22.COMPARATIVE SHARE ANALYSIS OF BMX BIKES MARKET FOR OFFLINE, BY COUNTRY, 2020 & 2030 ($THOUSANDS)
FIGURE 23.BMX BIKES MARKET, BY REGION, 2020-2030 (%)
FIGURE 24.COMPARATIVE SHARE ANALYSIS OF BMX BIKES MARKET, BY COUNTRY, 2020–2030 (%)
FIGURE 25.U.S. BMX BIKES MARKET, 2020–2030 ($THOUSANDS)
FIGURE 26.CANADA BMX BIKES MARKET, 2020–2030 ($THOUSANDS)
FIGURE 27.MEXICO BMX BIKES MARKET, 2020–2030 ($THOUSANDS)
FIGURE 28.COMPARATIVE SHARE ANALYSIS OF BMX BIKES MARKET, BY COUNTRY, 2020–2030 (%)
FIGURE 29.UK BMX BIKES MARKET, 2020–2030 ($THOUSANDS)
FIGURE 30.GERMANY BMX BIKES MARKET, 2020–2030 ($THOUSANDS)
FIGURE 31.FRANCE BMX BIKES MARKET, 2020–2030 ($THOUSANDS)
FIGURE 32.ITALY BMX BIKES MARKET, 2020–2030 ($THOUSANDS)
FIGURE 33.REST OF EUROPE BMX BIKES MARKET, 2020–2030 ($THOUSANDS)
FIGURE 34.COMPARATIVE SHARE ANALYSIS OF BMX BIKES MARKET, BY COUNTRY, 2020–2030 (%)
FIGURE 35.CHINA BMX BIKES MARKET, 2020–2030 ($THOUSANDS)
FIGURE 36.JAPAN BMX BIKES MARKET, 2020–2030 ($THOUSANDS)
FIGURE 37.INDIA BMX BIKES MARKET, 2020–2030 ($THOUSANDS)
FIGURE 38.AUSTRALIA BMX BIKES MARKET, 2020–2030 ($THOUSANDS)
FIGURE 39.REST OF ASIA-PACIFIC BMX BIKES MARKET, 2020–2030 ($THOUSANDS)
FIGURE 40.COMPARATIVE SHARE ANALYSIS OF BMX BIKES MARKET, BY COUNTRY, 2020–2030 (%)
FIGURE 41.LATIN AMERICA BMX BIKES MARKET, 2020–2030 ($THOUSANDS)
FIGURE 42.MIDDLE EAST BMX BIKES MARKET, 2020–2030 ($THOUSANDS)
FIGURE 43.AFRICA BMX BIKES MARKET, 2020–2030 ($THOUSANDS)
$5769
$9995
HAVE A QUERY?
OUR CUSTOMER

SIMILAR REPORTS