
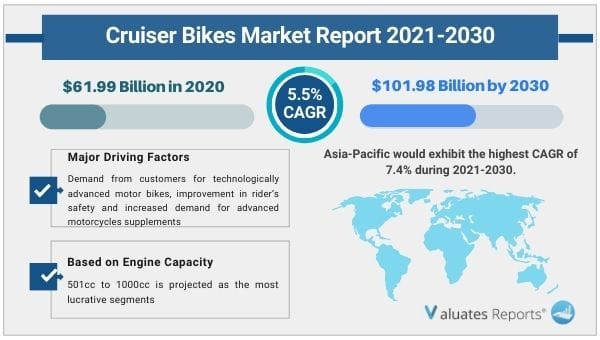
The global cruiser bikes market was valued at $61.99 billion in 2020, and is projected to reach $101.98 billion by 2030, registering a CAGR of 5.5% from 2021 to 2030. Factors such as rising demand from customers for technologically advanced motor bikes, improvement in rider’s safety and increased demand for advanced motorcycles supplements the growth of the global cruiser bikes market. Moreover, the factors such as high initial investment cost and high risk of accidents hampers the growth of the global market. However, increasing initiatives regarding the design and development of innovative systems and introduction of advanced technologies in bikes are the factors that are expected to create a positive impact; thus, supplementing the growth of the cruiser bikes market across the globe.
The outbreak of COVID-19 has resulted in flight cancellations, travel bans, and quarantines, which made massive slowing of the supply chain and logistics activities across the world. The most common reasons for the decline in the growth are attributed to movement restrictions, border controls & closures, and health screening. The vehicle industry also registered a decline in the business due to the closure of national & international borders, which has halted the movement of components that are manufactured in other countries and are transported to different manufacturer’s locations.
Cruiser bikes are luxurious bikes that are meant for travelling purpose as well as are preferred among individuals for their aesthetic looks. Cruiser bikes initially originated in early 20th century in North America, which were offered by some of the key manufacturers such as Harley-Davidson, Excelsior and Henderson. Cruiser bikes are made in such a style that the feet of the driver are placed forward on the bike while the driver sits slightly at the back on the bike. Typical cruiser engines emphasize easy ride-ability & shifting, with plenty of low-end torque but not necessarily large amounts of horsepower, traditionally V-twins but inline engines have become more common. Cruiser bikes with greater performance than usual, including more horsepower, stronger brakes and better suspension, are often called power cruisers.
The global cruiser bikes market has been segmented on the basis of engine capacity, price, application and region. Based on engine capacity, the market has been segmented into 250cc to 500cc, 500cc to 800cc, 800cc to 1600cc and >1600cc. Based on price, the market has been segmented into low, mid, and high. Based on the application, the market has been segmented into daily commute and touring. By region, the global market has been studied across North America, Europe, Asia-Pacific and LAMEA.
The key players profiled in the global cruiser bikes market include BMW AG, Harley Davidson, Hero Motocorp, Honda Motor Company, Piaggio, Suzuki Motor Company, Triumph Motorcycle, TVS, Yamaha and Zero Motorcycle.
Motorbikes are the most used conveyance option to travel from one location to another. They let the riders move through constricted spaces, are fast & highly maneuverable, and offer a thrilling experience while traveling on different terrains. Over the years, different kinds of motorcycles such as sport bikes, cruiser bikes, touring bikes, and mopeds have been launched to cater to different customer needs. The buyers of motorcycles have well-accepted electric bikes, which is increasing the penetration of electric bikes globally. Furthermore, electric bikes produce zero emissions, superior power output, reduced maintenance, and offer unique designs, which are expected to boost their demand over the years.
With an increasing number of cars being fitted with advanced navigation, infotainment, telematics, and autonomous technologies, the demand for such features in bikes is anticipated to increase in the coming years. While a rising number of companies are installing features such as GPS and connected bikes, some companies are developing bikes that will offer a superior driving experience to riders. Battery-powered bikes will be capable of self-balancing and will be able to stand upright even at extremely low speeds. By installing state-of-the-art sensor systems and AI technologies, bikes would offer features that will cater to the requirements of a skilled as well as an untrained rider. Hence, rise in demand for technologically advanced bikes is expected to propel the growth of the global bikes market, thereby creating a positive impact on the growth of global cruiser bikes market during the forecast timeframe.
In the past five years, with the rapid advancement of motorbike technology, it can be said that the future of motor bikes has arrived. The increasing disposable income of consumers, improvement in living standards, the increase in the number of young people, and the changing preference of the elderly to own a vehicle instead of taking public transportation, which has increased the demand for these bikes.
Also, the launch of effective and better products, the increase in sports bike users, and the growing trend of customization are factors aiding the growth of the cruiser bikes market. Moreover, the technological development in manufacturing processes, designing, and electronics and the growing demand for safety features and driver assistance to provide a safe and comfortable environment, especially for long-distance riding, is further propelling the demand for motor bikes. Apart from that, several manufacturers are inventing techniques to build bikes that will run on eco-friendly solar energy, gas, or electricity resources. These efforts are gaining the attraction of environmentalists.
Furthermore, as the technology is not matured enough, apart from China, the sales of the electric vehicles are extremely less as compared to the internal combustion engine (ICE) vehicle sale. In addition, although Tesla, an American electric vehicle and clean energy company based in Palo Alto, California, is expanding its network of chargers, they are designed specifically for Tesla vehicles. The automotive industry has standardized 120- and 240-volt plugs, which are primarily used in homes but have not yet set a standard on the plugs or ports that can charge vehicles in 30 minutes or less. Thus, all these factors coupled with the different prices at charging stations altogether are responsible for hindering the growth of the global cruiser bikes market.
Leading motorcycle manufacturers have made significant technological advancements in the design of bikes to make them more efficient, responsive, and safe. In recent years, several companies have revealed their concept bike design, which is expected to attract large number of customers from across the globe. The manufacturers such as BMW, Kawasaki, Honda, and Yamaha, are designing bikes by leveraging advanced AI and self-balancing technologies to enable the bikes to detect and act instantaneously according to the variations in the environment. For instance, in 2017, AB Dynamics and AutoRD showcased the Autonomous BMW C1 calling it the world's first self-driving motorbike. It is equipped with autonomous software, sensors, rebalancing technology, radio controls, and GPS, through which it can drive without a rider. In the same year, Yamaha displayed MOTOROiD—a proof-of-concept model that leverages self-balancing technology and artificial intelligence. Many companies are putting their efforts into making bikes available to customers in the near future. Such initiatives are anticipated to bolster the growth of the global cruiser bikes market.
By Engine Capacity
By Price
By Application
By Region
Key Players
|
Report Metric |
Details |
|
Report Name |
Cruiser Bikes Market |
|
The market size in 2020 |
USD 61.99 Billion |
|
The revenue forecast in 2030 |
USD 101.98 Billion |
|
Growth Rate |
CAGR of 5.5% from 2020 to 2030 |
|
Market size available for years |
2020-2030 |
|
Forecast units |
Value (USD) |
|
Segments covered |
Engine Capacity, Price, Application, and Region |
|
Report coverage |
Revenue & volume forecast, company share, competitive landscape, growth factors, and trends |
|
Geographic regions covered |
North America, Europe, Asia Pacific, Latin America, Middle East & Africa |
Ans. The global cruiser bikes market was valued at $61.99 billion in 2020, and is projected to reach $101.98 billion by 2030, registering a CAGR of 5.5% from 2021 to 2030.
Ans. Introduction of high performance and cost effective cruiser bikes are upcoming trends in cruiser bikes industry
Ans. The sale of vehicles increased owing to the demand for personal mobility is the global impact of Post COVID-19 scenario in the cruiser bikes market
Ans. Asia-Pacific is will provide more business opportunities for cruiser bikes in future.
Table of Content
CHAPTER 1:INTRODUCTION
1.1.Report description
1.2.Key benefits for stakeholders
1.3.Key market segments
1.4.Research methodology
1.4.1.Primary research
1.4.2.Secondary research
1.4.3.Analyst tools and models
CHAPTER 2:EXECUTIVE SUMMARY
2.1.CXO perspective
CHAPTER 3:MARKET OVERVIEW
3.1.Market definition and scope
3.2.Key findings
3.2.1.Top impacting factors
3.2.2.Top investment pockets
3.2.3.Top winning strategies
3.3.Porter’s five forces analysis
3.3.1.Low-to-High bargaining power of suppliers
3.3.2.High threat of new entrants
3.3.3.Low-to-high threat of substitutes
3.3.4.Moderate-to-high intensity of rivalry
3.3.5.Moderate-to-High bargaining power of buyers
3.4.Market share analysis, 2020 (%)
3.5.Market dynamics
3.5.1.Drivers
3.5.1.1.Rising demand from customers for technologically advanced motor bikes
3.5.1.2.Improvement in rider’s safety
3.5.1.3.Increased demand for advanced motorcycles
3.5.2.Restraints
3.5.2.1.High initial investment cost
3.5.2.2.High risk of accidents
3.5.3.Opportunities
3.5.3.1.Increasing initiatives regarding the design and development of innovative systems
3.5.3.2.Introduction of advanced bike technologies
3.6.Impact of COVID-19 on the market
3.6.1.Evolution of outbreaks
3.6.1.1.SARS
3.6.1.2.COVID-19
3.6.2.Micro-economic impact analysis
3.6.2.1.Consumer trend
3.6.2.2.Technology trends
3.6.2.3.Regulatory trend
3.6.3.Macro-economic impact analysis
3.6.3.1.GDP
3.6.3.2.Import/export analysis
3.6.3.3.Employment index
3.6.4.Impact on the automotive industry analysis
3.7.Competitive landscape
3.7.1.Competitive dashboard
3.7.2.Competitive heatmap
3.7.3.Value chain analysis
CHAPTER 4:CRUISER BIKES MARKET, BY ENGINE CAPACITY
4.1.Overview
4.2.Less Than 500cc
4.2.1.Key market trends, growth factors and opportunities
4.2.2.Market size and forecast, by region
4.2.3.Market size and forecast, for less than 500cc, by application
4.2.4.Market analysis by country
4.3.501cc to 1000 cc
4.3.1.Key market trends, growth factors and opportunities
4.3.2.Market size and forecast, by region
4.3.3.Market size and forecast, for 501cc to 1000cc, by application
4.3.4.Market analysis by country
4.4.More than 1000cc
4.4.1.Key market trends, growth factors and opportunities
4.4.2.Market size and forecast, by region
4.4.3.Market size and forecast, for more than 1000cc, by application
4.4.4.Market analysis by country
CHAPTER 5:CRUISER BIKES MARKET, BY PRICE
5.1.Overview
5.2.Low
5.2.1.Key market trends, growth factors and opportunities
5.2.2.Market size and forecast, by region
5.2.3.Market analysis by country
5.3.Mid
5.3.1.Key market trends, growth factors and opportunities
5.3.2.Market size and forecast, by region
5.3.3.Market analysis by country
5.4.High
5.4.1.Key market trends, growth factors and opportunities
5.4.2.Market size and forecast, by region
5.4.3.Market analysis by country
CHAPTER 6:CRUISER BIKES MARKET, BY APPLICATION
6.1.Overview
6.2.Daily commute
6.2.1.Key market trends, growth factors and opportunities
6.2.2.Market size and forecast, by region
6.2.3.Market analysis by country
6.3.Touring
6.3.1.Key market trends, growth factors and opportunities
6.3.2.Market size and forecast, by region
6.3.3.Market analysis by country
CHAPTER 7:CRUISER BIKES MARKET, BY REGION
7.1.Overview
7.2.North America
7.2.1.Key market trends, growth factors, and opportunities
7.2.2.Market size and forecast, by engine capacity
7.2.3.North America less than 500cc cruiser bikes market, by application
7.2.4.North America 501cc to 1000cc cruiser bikes market, by application
7.2.5.North America more than 1000cc cruiser bikes market, by application
7.2.6.Market size and forecast, by price
7.2.7.Market size and forecast, by application
7.2.8.Market analysis by country
7.2.8.1.U.S.
7.2.8.1.1.Market size and forecast, by engine capacity
7.2.8.1.2.Market size and forecast, by price
7.2.8.1.3.Market size and forecast, by application
7.2.8.2.Canada
7.2.8.2.1.Market size and forecast, by engine capacity
7.2.8.2.2.Market size and forecast, by price
7.2.8.2.3.Market size and forecast, by application
7.2.8.3.Mexico
7.2.8.3.1.Market size and forecast, by engine capacity
7.2.8.3.2.Market size and forecast, by price
7.2.8.3.3.Market size and forecast, by application
7.3.Europe
7.3.1.Key market trends, growth factors, and opportunities
7.3.2.Market size and forecast, by engine capacity
7.3.3.Europe less than 500cc cruiser bikes market, by application
7.3.4.Europe 501cc to 1000cc cruiser bikes market, by application
7.3.5.Europe more than 1000cc cruiser bikes market, by application
7.3.6.Market size and forecast, by price
7.3.7.Market size and forecast, by application
7.3.8.Market analysis by country
7.3.8.1.UK
7.3.8.1.1.Market size and forecast, by engine capacity
7.3.8.1.2.Market size and forecast, by price
7.3.8.1.3.Market size and forecast, by application
7.3.8.2.Germany
7.3.8.2.1.Market size and forecast, by engine capacity
7.3.8.2.2.Market size and forecast, by price
7.3.8.2.3.Market size and forecast, by application
7.3.8.3.France
7.3.8.3.1.Market size and forecast, by engine capacity
7.3.8.3.2.Market size and forecast, by price
7.3.8.3.3.Market size and forecast, by application
7.3.8.4.Italy
7.3.8.4.1.Market size and forecast, by engine capacity
7.3.8.4.2.Market size and forecast, by price
7.3.8.4.3.Market size and forecast, by application
7.3.8.5.Rest of Europe
7.3.8.5.1.Market size and forecast, by engine capacity
7.3.8.5.2.Market size and forecast, by price
7.3.8.5.3.Market size and forecast, by application
7.4.Asia-Pacific
7.4.1.Key market trends, growth factors, and opportunities
7.4.2.Market size and forecast, by engine capacity
7.4.3.Asia-Pacific less than 500cc cruiser bikes market, by application
7.4.4.Asia-Pacific 501cc to 1000cc cruiser bikes market, by application
7.4.5.Asia-Pacific more than 1000cc cruiser bikes market, by application
7.4.6.Market size and forecast, by price
7.4.7.Market size and forecast, by application
7.4.8.Market analysis by country
7.4.8.1.China
7.4.8.1.1.Market size and forecast, by engine capacity
7.4.8.1.2.Market size and forecast, by price
7.4.8.1.3.Market size and forecast, by application
7.4.8.2.Japan
7.4.8.2.1.Market size and forecast, by engine capacity
7.4.8.2.2.Market size and forecast, by price
7.4.8.2.3.Market size and forecast, by application
7.4.8.3.India
7.4.8.3.1.Market size and forecast, by engine capacity
7.4.8.3.2.Market size and forecast, by price
7.4.8.3.3.Market size and forecast, by application
7.4.8.4.Australia
7.4.8.4.1.Market size and forecast, by engine capacity
7.4.8.4.2.Market size and forecast, by price
7.4.8.4.3.Market size and forecast, by application
7.4.8.5.Rest of Asia-Pacific
7.4.8.5.1.Market size and forecast, by engine capacity
7.4.8.5.2.Market size and forecast, by price
7.4.8.5.3.Market size and forecast, by application
7.5.LAMEA
7.5.1.Key market trends, growth factors, and opportunities
7.5.2.Market size and forecast, by engine capacity
7.5.3.LAMEA less than 500cc cruiser bikes market, by application
7.5.4.LAMEA 501cc to 1000cc cruiser bikes market, by application
7.5.5.LAMEA more than 1000cc cruiser bikes market, by application
7.5.6.Market size and forecast, by price
7.5.7.Market size and forecast, by application
7.5.8.Market analysis by country
7.5.8.1.Latin America
7.5.8.1.1.Market size and forecast, by engine capacity
7.5.8.1.2.Market size and forecast, by price
7.5.8.1.3.Market size and forecast, by application
7.5.8.2.Middle East
7.5.8.2.1.Market size and forecast, by engine capacity
7.5.8.2.2.Market size and forecast, by price
7.5.8.2.3.Market size and forecast, by application
7.5.8.3.Africa
7.5.8.3.1.Market size and forecast, by engine capacity
7.5.8.3.2.Market size and forecast, by price
7.5.8.3.3.Market size and forecast, by application
CHAPTER 8:COMPANY PROFILES
8.1.BAYERISCHE MOTOREN WERKE AKTIENGESELLSCHAFT
8.1.1.Company overview
8.1.2.Company snapshot
8.1.3.Operating business segments
8.1.4.Product portfolio
8.1.5.Business performance
8.1.6.Key strategic moves and developments
8.2.HARLEY-DAVIDSON
8.2.1.Company overview
8.2.2.Company snapshot
8.2.3.Operating business segments
8.2.4.Product portfolio
8.2.5.Business performance
8.2.6.Key strategic moves and developments
8.3.Hero MotoCorp Ltd.
8.3.1.Company overview
8.3.2.Company snapshot
8.3.3.Product portfolio
8.3.4.Business performance
8.3.5.Key strategic moves and developments
8.4.HONDA MOTOR CO., LTD.
8.4.1.Company overview
8.4.2.Company snapshot
8.4.3.Operating business segments
8.4.4.Product portfolio
8.4.5.Business performance
8.4.6.Key strategic moves and developments
8.5.PIAGGIO & C. SPA
8.5.1.Company overview
8.5.2.Company snapshot
8.5.3.Operating business segments
8.5.4.Product portfolio
8.5.5.Business performance
8.6.Suzuki Motor Corporation
8.6.1.Company overview
8.6.2.Company snapshot
8.6.3.Operating business segments
8.6.4.Product portfolio
8.6.5.Business performance
8.7.Triumph Motorcycles
8.7.1.Company overview
8.7.2.Company snapshot
8.7.3.Product portfolio
8.7.4.Key strategic moves and developments
8.8.TVS MOTOR COMPANY
8.8.1.Company overview
8.8.2.Company snapshot
8.8.3.Operating business segments
8.8.4.Product portfolio
8.8.5.Business performance
8.9.YAMAHA MOTOR CO., LTD.
8.9.1.Company overview
8.9.2.Company snapshot
8.9.3.Operating business segments
8.9.4.Product portfolio
8.9.5.Business performance
8.9.6.Key strategic moves and developments
8.10.Zero Motorcycles, Inc.
8.10.1.Company overview
8.10.2.Company snapshot
8.10.3.Product portfolio
List of Tables & Figures
Table 01.Global Cruiser Bikes Market, By Engine Capacity, 2020-2030 ($Million)
Table 02.Cruiser Bikes Market Revenue For Less Than 500cc, By Region 2020–2030 ($Million)
Table 03.Cruiser Bikes Market Revenue For Less Than 500cc, By Application, 2020–2030 ($Million)
Table 04.Cruiser Bikes Market Revenue For 501cc To 1000cc, By Region 2020–2030 ($Million)
Table 05.Cruiser Bikes Market Revenue For 501cc To 1000cc, By Application, 2020–2030 ($Million)
Table 06.Cruiser Bikes Market Revenue For More Than 1000cc, By Region 2020–2030 ($Million)
Table 07.Cruiser Bikes Market Revenue For More Than 1000cc, By Application, 2020–2030 ($Million)
Table 08.Global Cruiser Bikes Market, By Price, 2020-2030 ($Million)
Table 09.Cruiser Bikes Market Revenue For Low, By Region 2020–2030 ($Million)
Table 10.Cruiser Bikes Market Revenue For Mid, By Region 2020–2030 ($Million)
Table 11.Cruiser Bikes Market Revenue For High, By Region 2020–2030 ($Million)
Table 12.Global Cruiser Bikes Market, By Application, 2020-2030 ($Million)
Table 13.Cruiser Bikes Market Revenue For Daily Commute, By Region 2020–2030 ($Million)
Table 14.Cruiser Bikes Market Revenue For Touring, By Region 2020–2030 ($Million)
Table 15.North America Cruiser Bikes Market, By Engine Capacity, 2020–2030 ($Million)
Table 16.North America Less Than 500cc Cruiser Bikes Market, By Application, 2020–2030 ($Million)
Table 17.North America 501cc To 1000cc Cruiser Bikes Market, By Application, 2020–2030 ($Million)
Table 18.North America More Than 1000cc Cruiser Bikes Market, By Application, 2020–2030 ($Million)
Table 19.North America Cruiser Bikes Market, By Price, 2020–2030 ($Million)
Table 20.North America Cruiser Bikes Market, By Application, 2020–2030 ($Million)
Table 21.U.S. Cruiser Bikes Market, By Engine Capacity, 2020–2030 ($Million)
Table 22.U.S. Cruiser Bikes Market, By Price, 2020–2030 ($Million)
Table 23.U.S. Cruiser Bikes Market, By Application, 2020–2030 ($Million)
Table 24.Canada Cruiser Bikes Market, By Engine Capacity, 2020–2030 ($Million)
Table 25.Canada Cruiser Bikes Market, By Price, 2020–2030 ($Million)
Table 26.Canada Cruiser Bikes Market, By Application, 2020–2030 ($Million)
Table 27.U.S. Cruiser Bikes Market, By Engine Capacity, 2020–2030 ($Million)
Table 28.Mexico Cruiser Bikes Market, By Price, 2020–2030 ($Million)
Table 29.Mexico Cruiser Bikes Market, By Application, 2020–2030 ($Million)
Table 30.Europe Cruiser Bikes Market, By Engine Capacity, 2020–2030 ($Million)
Table 31.Europe Less Than 500cc Cruiser Bikes Market, By Application, 2020–2030 ($Million)
Table 32.Europe 501cc To 1000cc Cruiser Bikes Market, By Application, 2020–2030 ($Million)
Table 33.Europe More Than 1000cc Cruiser Bikes Market, By Application, 2020–2030 ($Million)
Table 34.Europe Cruiser Bikes Market, By Price, 2020–2030 ($Million)
Table 35.Europe Cruiser Bikes Market, By Application, 2020–2030 ($Million)
Table 36.Uk Cruiser Bikes Market, By Engine Capacity, 2020–2030 ($Million)
Table 37.Uk Cruiser Bikes Market, By Price, 2020–2030 ($Million)
Table 38.Uk Cruiser Bikes Market, By Application, 2020–2030 ($Million)
Table 39.Germany Cruiser Bikes Market, By Engine Capacity, 2020–2030 ($Million)
Table 40.Germany Cruiser Bikes Market, By Price, 2020–2030 ($Million)
Table 41.Germany Cruiser Bikes Market, By Application, 2020–2030 ($Million)
Table 42.France Cruiser Bikes Market, By Engine Capacity, 2020–2030 ($Million)
Table 43.France Cruiser Bikes Market, By Price, 2020–2030 ($Million)
Table 44.France Cruiser Bikes Market, By Application, 2020–2030 ($Million)
Table 45.Italy Cruiser Bikes Market, By Engine Capacity, 2020–2030 ($Million)
Table 46.Italy Cruiser Bikes Market, By Price, 2020–2030 ($Million)
Table 47.Italy Cruiser Bikes Market, By Application, 2020–2030 ($Million)
Table 48.Rest Of Europe Cruiser Bikes Market, By Engine Capacity, 2020–2030 ($Million)
Table 49.Rest Of Europe Cruiser Bikes Market, By Price, 2020–2030 ($Million)
Table 50.Rest Of Europe Cruiser Bikes Market, By Application, 2020–2030 ($Million)
Table 51.Asia-pacific Cruiser Bikes Market, By Engine Capacity, 2020–2030 ($Million)
Table 52.Asia-pacific Less Than 500cc Cruiser Bikes Market, By Application, 2020–2030 ($Million)
Table 53.Asia-pacific 501cc To 1000cc Cruiser Bikes Market, By Application, 2020–2030 ($Million)
Table 54.Asia-pacific More Than 1000cc Cruiser Bikes Market, By Application, 2020–2030 ($Million)
Table 55.Asia-pacific Cruiser Bikes Market, By Price, 2020–2030 ($Million)
Table 56.Asia-pacific Cruiser Bikes Market, By Application, 2020–2030 ($Million)
Table 57.China Cruiser Bikes Market, By Engine Capacity, 2020–2030 ($Million)
Table 58.China Cruiser Bikes Market, By Price, 2020–2030 ($Million)
Table 59.China Cruiser Bikes Market, By Application, 2020–2030 ($Million)
Table 60.Japan Cruiser Bikes Market, By Engine Capacity, 2020–2030 ($Million)
Table 61.Japan Cruiser Bikes Market, By Price, 2020–2030 ($Million)
Table 62.Japan Cruiser Bikes Market, By Application, 2020–2030 ($Million)
Table 63.India Cruiser Bikes Market, By Engine Capacity, 2020–2030 ($Million)
Table 64.India Cruiser Bikes Market, By Price, 2020–2030 ($Million)
Table 65.India Cruiser Bikes Market, By Application, 2020–2030 ($Million)
Table 66.Australia Cruiser Bikes Market, By Engine Capacity, 2020–2030 ($Million)
Table 67.Australia Cruiser Bikes Market, By Price, 2020–2030 ($Million)
Table 68.Australia Cruiser Bikes Market, By Application, 2020–2030 ($Million)
Table 69.Rest Of Asia-pacific Cruiser Bikes Market, By Engine Capacity, 2020–2030 ($Million)
Table 70.Rest Of Asia-pacific Cruiser Bikes Market, By Price, 2020–2030 ($Million)
Table 71.Rest Of Asia-pacific Cruiser Bikes Market, By Application, 2020–2030 ($Million)
Table 72.Lamea Cruiser Bikes Market, By Engine Capacity, 2020–2030 ($Million)
Table 73.Lamea Less Than 500cc Cruiser Bikes Market, By Application, 2020–2030 ($Million)
Table 74.Lamea 501cc To 1000cc Cruiser Bikes Market, By Application, 2020–2030 ($Million)
Table 75.Lamea More Than 1000cc Cruiser Bikes Market, By Application, 2020–2030 ($Million)
Table 76.Lamea Cruiser Bikes Market, By Price, 2020–2030 ($Million)
Table 77.Lamea Cruiser Bikes Market, By Application, 2020–2030 ($Million)
Table 78.Latin America Cruiser Bikes Market, By Engine Capacity, 2020–2030 ($Million)
Table 79.Latin America Cruiser Bikes Market, By Price, 2020–2030 ($Million)
Table 80.Latin America Cruiser Bikes Market, By Application, 2020–2030 ($Million)
Table 81.Middle East Cruiser Bikes Market, By Engine Capacity, 2020–2030 ($Million)
Table 82.Middle East Cruiser Bikes Market, By Price, 2020–2030 ($Million)
Table 83.Middle East Cruiser Bikes Market, By Application, 2020–2030 ($Million)
Table 84.Africa Cruiser Bikes Market, By Engine Capacity, 2020–2030 ($Million)
Table 85.Africa Cruiser Bikes Market, By Price, 2020–2030 ($Million)
Table 86.Africa Cruiser Bikes Market, By Application, 2020–2030 ($Million)
Table 87.Bmw: Company Snapshot
Table 88.Bmw: Operating Segments
Table 89.Bmw: Product Portfolio
Table 90.Harley-davidson: Company Snapshot
Table 91.Harley-davidson: Operating Segments
Table 92.Harley-davidson: Product Portfolio
Table 93.Harley-davidson: Key Strategic Moves And Developments
Table 94.Hero Motocorp Ltd.: Company Snapshot
Table 95.Hero Motocorp Ltd.: Product Portfolio
Table 96.Hero Motocorp Ltd.: Key Strategic Moves And Developments
Table 97.Honda Motor Co., Ltd.: Company Snapshot
Table 98.Honda Motor Co., Ltd.: Operating Segments
Table 99.Honda Motor Co., Ltd.: Product Portfolio
Table 100.Honda Motor Co., Ltd.: Key Strategic Moves And Developments
Table 101.Piaggio & C.Spa: Company Snapshot
Table 102.Piaggio & C.Spa: Operating Segments
Table 103.Piaggio & C.Spa: Product Portfolio
Table 104.Suzuki Motor Corporation: Company Snapshot
Table 105.Suzuki Motor Corporation: Operating Segments
Table 106.Suzuki Motor Corporation: Product Portfolio
Table 107.Triumph Motorcycles: Company Snapshot
Table 108.Triumph Motorcycles: Product Portfolio
Table 109.Triumph Motorcycles: Key Strategic Moves And Developments
Table 110.Tvs Motor Company: Company Snapshot
Table 111.Tvs Motor Company: Operating Segments
Table 112.Tvs Motor Company: Product Portfolio
Table 113.Yamaha Motor Co., Ltd.: Company Snapshot
Table 114.Yamaha Motor Co., Ltd.: Operating Segments
Table 115.Yamaha Motor Co., Ltd.: Product Portfolio
Table 116.Yamaha Motor Co., Ltd.: Key Strategic Moves And Developments
Table 117.Zero Motorcycles, Inc.: Company Snapshot
Table 118.Zero Motorcycles, Inc.: Product Portfolio
List Of Figures
Figure 01.Key Market Segments
Figure 02.Executive Summary
Figure 03.Executive Summary
Figure 04.Top Impacting Factors
Figure 05.Top Investment Pockets
Figure 06.Top Winning Strategies, By Year, 2018-2021*
Figure 07.Top Winning Strategies, By Development, 2018-2021*
Figure 08.Top Winning Strategies, By Company, 2018-2021*
Figure 09.Market Share Analysis, 2020 (%)
Figure 10.Macro-economic Indicators Projections (1/2):
Figure 11.Macro-economic Indicators Projections (2/2):
Figure 12.Competitive Dashboard Of Top 10 Key Players (1/2)
Figure 13.Competitive Dashboard Of Top 10 Key Players (2/2)
Figure 14.Competitive Heatmap Of Top 10 Key Players
Figure 15.Value Chain Analysis Of The Industry
Figure 16.Global Cruiser Bikes Market, By Engine Capacity, 2020-2030
Figure 17.Comparative Share Analysis Of Cruiser Bikes Market For Less Than 500cc, By Country, 2020 & 2030 ($Millon)
Figure 18.Comparative Share Analysis Of Cruiser Bikes Market For 501cc To 1000cc, By Country, 2020 & 2030 ($Millon)
Figure 19.Comparative Share Analysis Of Cruiser Bikes Market For More Than 1000cc, By Country, 2020 & 2030 ($Millon)
Figure 20.Global Cruiser Bikes Market, By Price, 2020-2030
Figure 21.Comparative Share Analysis Of Cruiser Bikes Market For Low, By Country, 2020 & 2030 ($Millon)
Figure 22.Comparative Share Analysis Of Cruiser Bikes Market For Mid, By Country, 2020 & 2030 ($Millon)
Figure 23.Comparative Share Analysis Of Cruiser Bikes Market For High, By Country, 2020 & 2030 ($Millon)
Figure 24.Global Cruiser Bikes Market, By Application, 2020-2030
Figure 25.Comparative Share Analysis Of Cruiser Bikes Market For Daily Commute, By Country, 2020 & 2030 ($Millon)
Figure 26.Comparative Share Analysis Of Cruiser Bikes Market For Touring, By Country, 2020 & 2030 ($Millon)
Figure 27.Cruiser Bikes Market, By Region, 2020-2030 (%)
Figure 28.Comparative Share Analysis Of Cruiser Bikes Market, By Country, 2020–2030 (%)
Figure 29.U.S. Cruiser Bikes Market, 2020–2030 ($Million)
Figure 30.Canada Cruiser Bikes Market, 2020–2030 ($Million)
Figure 31.Mexico Cruiser Bikes Market, 2020–2030 ($Million)
Figure 32.Comparative Share Analysis Of Cruiser Bikes Market, By Country, 2020–2030 (%)
Figure 33.Uk Cruiser Bikes Market, 2020–2030 ($Million)
Figure 34.Germany Cruiser Bikes Market, 2020–2030 ($Million)
Figure 35.France Cruiser Bikes Market, 2020–2030 ($Million)
Figure 36.Italy Cruiser Bikes Market, 2020–2030 ($Million)
Figure 37.Rest Of Europe Cruiser Bikes Market, 2020–2030 ($Million)
Figure 38.Comparative Share Analysis Of Cruiser Bikes Market, By Country, 2020–2030 (%)
Figure 39.China Cruiser Bikes Market, 2020–2030 ($Million)
Figure 40.Japan Cruiser Bikes Market, 2020–2030 ($Million)
Figure 41.India Cruiser Bikes Market, 2020–2030 ($Million)
Figure 42.Australia Cruiser Bikes Market, 2020–2030 ($Million)
Figure 43.Rest Of Asia-pacific Cruiser Bikes Market, 2020–2030 ($Million)
Figure 44.Comparative Share Analysis Of Cruiser Bikes Market, By Country, 2020–2030 (%)
Figure 45.Latin America Cruiser Bikes Market, 2020–2030 ($Million)
Figure 46.Middle East Cruiser Bikes Market, 2020–2030 ($Million)
Figure 47.Africa Cruiser Bikes Market, 2020–2030 ($Million)
Figure 48.Bmw: Net Sales, 2018–2020 ($Million)
Figure 49.Bmw: Revenue Share By Segment, 2020 (%)
Figure 50.Bmw: Revenue Share By Region, 2020 (%)
Figure 51.Harley-davidson: Net Sales, 2018–2020 ($Million)
Figure 52.Harley-davidson: Revenue Share By Segment, 2020 (%)
Figure 53.Hero Motocorp Ltd.: Net Sales, 2018–2020 ($Million)
Figure 54.Honda Motor Co., Ltd.: Net Sales, 2018–2020 ($Million)
Figure 55.Honda Motor Co., Ltd.: Revenue Share By Segment, 2020 (%)
Figure 56.Honda Motor Co., Ltd.: Revenue Share By Region, 2020 (%)
Figure 57.Piaggio & C.Spa: Net Sales, 2018–2020 ($Million)
Figure 58.Piaggio & C.Spa: Revenue Share By Segment, 2020 (%)
Figure 59.Piaggio & C.Spa: Revenue Share By Region, 2020 (%)
Figure 60.Suzuki Motor Corporation: Net Sales, 2018–2020 ($Million)
Figure 61.Suzuki Motor Corporation: Revenue Share By Segment, 2020 (%)
Figure 62.Suzuki Motor Corporation: Revenue Share By Region, 2020 (%)
Figure 63.Tvs Motor Company: Net Sales, 2018–2020 ($Million)
Figure 64.Yamaha Motor Co., Ltd.: Net Sales, 2018–2020 ($Million)
Figure 65.Yamaha Motor Co., Ltd.: Revenue Share By Segment, 2020 (%)
$5769
$9995
HAVE A QUERY?
OUR CUSTOMER

SIMILAR REPORTS