
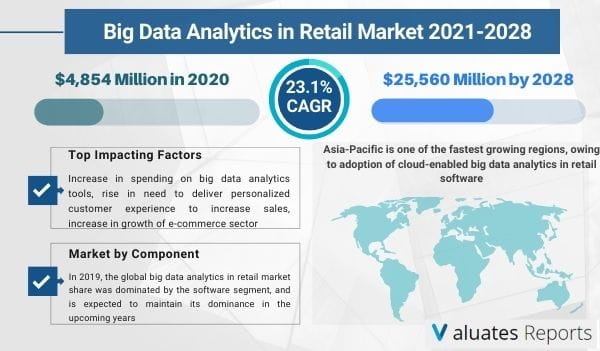
The global big data analytics in retail market size was valued at US$ 4854 million in 2020 and is projected to reach US$ 25560 million by 2028 registering a CAGR of 23.1% from 2021 to 2028. Key drivers of big data analytics in the retail market include increased spending on big data analytics tools, a rise in the need to deliver a personalized customer experience to increase sales, and an increase in the growth of the eCommerce sector. Big data analytics is used in every stage of the retail industry to understand customer behavior, predict demand and optimize pricing.
Other factors contributing to the growth of big data analytics in the retail market are the growing need for retaining customer loyalty, customer journey analytics, supply chain movement measurement, and the integration of advanced technologies such as machine learning AI. Big data analytics is also widely used to measure and predict forecast trends, optimize financial management and increase customer satisfaction. Wide adoption and usage are driving the growth of the market.
With the proliferation of smartphones, people can now access consumer products on various social media channels, mobiles, and e-commerce websites. Due to the rising online activity of consumers and with people being connected with each other more it becomes increasingly important to track, analyze and collect data about the customer journey and buying behavior online in order to gain a competitive edge. Thus growth in eCommerce and virtual space is leading businesses to use big data analytics tools driving the growth of big data analytics in the retail market globally and will continue to grow during the forecast period.
Big market players across the globe are leveraging big data analytics integrated with machine learning and AI in order to map, study and analyze data related to better consumer experience, supply chain management, employee productivity, and operational efficiency, etc. Rising investments and new product innovations for personalization, marketing, price optimization, and merchandising will fuel the growth of big data analytics in the retail market during the forecast period. The retail industry will create huge demand for big data analytics tools in the coming years.
A host of benefits offered by big data analytics and growing awareness for predictive analysis will fuel the growth of the market. Retail companies are increasing their investments in big data analytics in order to stay ahead of the shopper trends and gain meaningful customer insights on in-store purchases and online shopping patterns. The rising need to stay ahead and the unaffected budget of enterprises for big data analytics together with the growing demand for predictive analysis will propel the growth of big data analytics in the retail market during the forecast period.
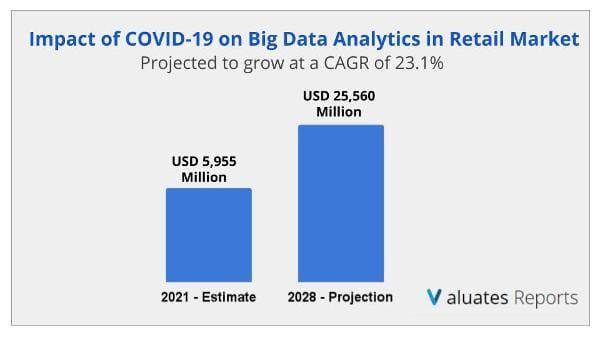
The size of the big data analytics in retail market is estimated to grow from 5,955 million in 2021, and is projected to reach $25,560 million by 2028, at a CAGR of 23.1%. The current estimation of 2028 is projected to be higher than pre-COVID-19 estimates. COVID-19 pandemic has bought a positive impact on the big data analytics in retail market, achieving a growth rate of 3–5% in 2021. . Covid 19 had a positive impact on the retail analytics market due to the widespread adoption of AI.machine learning and big data analytics tools by healthcare professionals and researchers in order to study, analyze and collate large volumes of data to interpret the spread of the virus and find ways to contain it. Thus, increased usage of big data during the covid 19 outbreak will accelerate the growth of big data analytics in the retail market during the forecast period.
Based on region, Asia-pacific is expected to hold the largest big data analytics in retail market share during the forecast period due to widespread adoption of cloud-based big data analytics in retail software, increase in internet penetration leading to more 4G connections, and rising e-commerce companies.
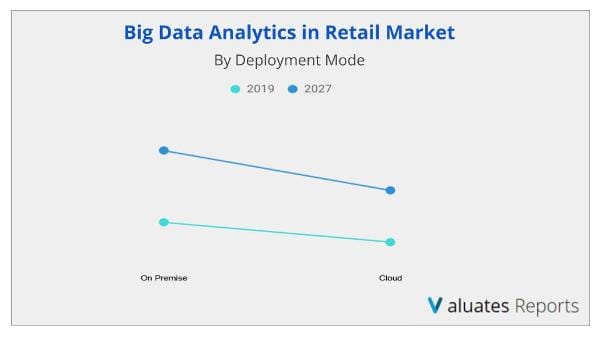
Based on deployment, the on-premise segment is expected to provide lucrative opportunities for growth in the big data analytics retail market share during the forecast period because on-premises software provides enhanced security features and easy deployment enabling wide-scale adoption in financial institutions and other data-sensitive organizations.
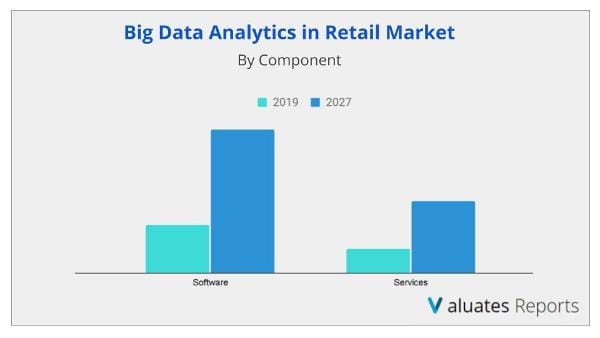
Based on components, the software segment is expected to hold the largest big data analytics in retail market share during the forecast period as this new big data analytics in retail software allows integration of AI and machine learning for better personalization allowing retail companies to enhance their customer experience and provide more enhanced recommendations to customers.
adoption of smartphones, increase in popularity of e-commerce companies, change in customer purchase patterns, and strong & growing competition among retail vendors in the region. These technologies have led to a great amount of data exchange on mobile and internet networks, and thus, enables enterprises to capture huge volumes of information about customer interactions. Further, many retail analytics vendors who have a strong presence in North America are expanding their business across Asia-Pacific, which creates lucrative opportunities for the big data analytics in retail market.
The key players operating in the global big data analytics in retail market analysis include Alteryx Inc., IBM, Microsoft, Microstrategy Inc., Oracle Corporation, Qlik Technologies Inc., RetailNext, SAP SE, SAS institute, and Teradata.
Key Benefits for Stakeholders
|
Report Metric |
Details |
|
Report Name |
Big Data Analytics in Retail Market |
|
The market size in 2020 |
$4,854 Million |
|
The market size in 2021 |
$5,955 Million |
|
The revenue forecast in 2028 |
$25,560 Million |
|
Growth Rate |
CAGR of 23.1% from 2021-2028 |
|
Forecast period |
2021-2028 |
|
Forecast units |
Value (USD) |
|
Segments covered |
Component, Deployment, Enterprise Size, Application, Regions, Key Players |
|
by Component |
Software and Services |
|
by Deployment |
On-premise and Cloud |
|
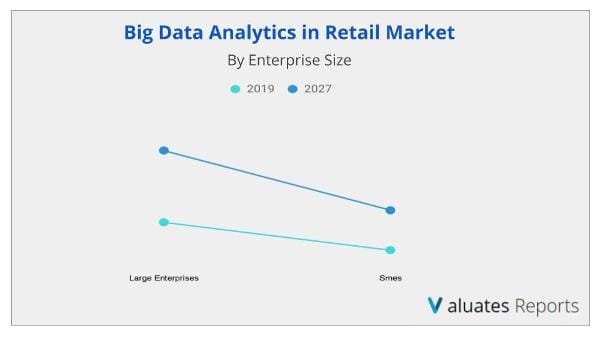
by Enterprise Size |
Large Enterprises and Small & Medium-sized Enterprises |
|
by Application |
Sales & Marketing Analytics, Supply Chain Operations Management, Merchandising Analytics, Customer Analytics, and Others |
|
Report coverage |
Revenue & volume forecast, company share, competitive landscape, growth factors, and trends |
|
Geographic regions covered |
North America, Europe, Asia Pacific, Latin America, Middle East & Africa |
|
Key Players |
Alteryx Inc., IBM, Microsoft, Microstrategy Inc., Oracle Corporation, Qlik Technologies Inc., RetailNext, SAP SE, SAS institute, and Teradata |
Ans. The global big data analytics in retail market size was valued at $4,854 million in 2020, and is projected to reach $25,560 million by 2028, registering a CAGR of 23.1% from 2021 to 2028.
Ans. Asia-Pacific is one of the fastest-growing regions, owing to the adoption of cloud-enabled big data analytics in retail software are expected to witness growth in this region, owing to increase in popularity of fast internet connectivity including 4G connections, growing
Ans. The key players operating in the global big data analytics in retail market analysis include Alteryx Inc., IBM, Microsoft, Microstrategy Inc., Oracle Corporation, Qlik Technologies Inc., RetailNext, SAP SE, SAS institute, and Teradata.
Ans. Big Data Analytics in Retail Software segment is projected as one of the most lucrative segments during the forecast period.
Ans. The forecast period for the Big Data Analytics in Retail Market is 2021 to 2028
Ans. Increase in spending on big data analytics tools, rise in need to deliver personalized customer experience to increase sales, and increase in growth of the e-commerce sector are some of the major factors that are driving the growth of the global market
TABLE OF CONTENT
CHAPTER 1:INTRODUCTION
1.1.REPORT DESCRIPTION
1.2.KEY BENEFITS FOR STAKEHOLDERS
1.3.KEY MARKET SEGMENTS
1.4.RESEARCH METHODOLOGY
1.4.1.Secondary research
1.4.2.Primary research
1.4.3.Analyst tools & models
CHAPTER 2:EXECUTIVE SUMMARY
2.1.KEY FINDINGS
2.1.1.Top impacting factors
2.1.2.Top investment pockets
2.2.CXO PERSPECTIVE
CHAPTER 3:MARKET OVERVIEW
3.1.MARKET DEFINITION AND SCOPE
3.2.PORTER’S FIVE FORCES ANALYSIS
3.3.KEY PLAYER POSITIONING
3.4.CASE STUDIES
3.4.1.Case Study 01
3.4.2.Case Study 02
3.5.MARKET DYNAMICS
3.5.1.Drivers
3.5.1.1.Increase in spending on big data analytics tools
3.5.1.2.Rise in need to deliver personalized customer experience to increase sales
3.5.1.3.Increasing growth of e-commerce sector
3.5.2.Restraints
3.5.2.1.Collecting and collating the data from disparate systems
3.5.2.2.To capture customer data
3.5.3.Opportunity
3.5.3.1.Integration of new technologies such as IoT, AI and machine learning in big data analytics in retail
3.5.3.2.Growing demand of predictive analytics in retail
3.6.IMPACT ANALYSIS: COVID-19 ON BIG DATA IN RETAIL ANALYTICS MARKET
3.6.1.Impact on market size
3.6.2.Consumer trends, preferences, and budget impact
3.6.3.Regulatory framework
3.6.4.Economic impact
3.6.5.Key player strategies to tackle negative impact
3.6.6.Opportunity window (due to COVID outbreak)
CHAPTER 4:BIG DATA ANALYTICS IN RETAIL MARKET, BY COMPONENT
4.1.OVERVIEW
4.2.SOFTWARE
4.2.1.Key market trends, growth factors, and opportunities
4.2.2.Market size and forecast, by region
4.2.3.Market analysis, by region
4.3.SERVICE
4.3.1.Key market trends, growth factors, and opportunities
4.3.2.Market size and forecast, by region
4.3.3.Market analysis, by region
CHAPTER 5:BIG DATA ANALYTICS IN RETAIL MARKET, BY DEPLOYMENT
5.1.OVERVIEW
5.2.ON PREMISE
5.2.1.Key market trends, growth factors, and opportunities
5.2.2.Market size and forecast, by region
5.2.3.Market analysis, by region
5.3.CLOUD
5.3.1.Key market trends, growth factors, and opportunities
5.3.2.Market size and forecast, by region
5.3.3.Market analysis, by region
CHAPTER 6:BIG DATA ANALYTICS IN RETAIL MARKET, BY ORGANIZATION SIZE
6.1.OVERVIEW
6.2.LARGE ENTERPRISES
6.2.1.Key market trends, growth factors, and opportunities
6.2.2.Market size and forecast, by region
6.2.3.Market analysis, by region
6.3.SMES
6.3.1.Key market trends, growth factors, and opportunities
6.3.2.Market size and forecast, by region
6.3.3.Market analysis, by region
CHAPTER 7:BIG DATA ANALYTICS IN RETAIL MARKET, BY APPLICATION
7.1.OVERVIEW
7.2.SALES AND MARKETING ANALYTICS
7.2.1.Key market trends, growth factors, and opportunities
7.2.2.Market size and forecast, by region
7.2.3.Market analysis, by region
7.3.SUPPLY CHAIN OPERATIONS MANAGEMENT
7.3.1.Key market trends, growth factors, and opportunities
7.3.2.Market size and forecast, by region
7.3.3.Market analysis, by region
7.4.MERCHANDISING ANALYTICS
7.4.1.Key market trends, growth factors, and opportunities
7.4.2.Market size and forecast, by region
7.4.3.Market analysis, by region
7.5.CUSTOMER ANALYTICS
7.5.1.Key market trends, growth factors, and opportunities
7.5.2.Market size and forecast, by region
7.5.3.Market analysis, by region
7.6.OTHERS
7.6.1.Key market trends, growth factors, and opportunities
7.6.2.Market size and forecast, by region
7.6.3.Market analysis, by region
CHAPTER 8:BIG DATA ANALYTICS IN RETAIL MARKET, BY REGION
8.1.OVERVIEW
8.2.NORTH AMERICA
8.2.1.Key market trends, growth factors and opportunities
8.2.2.Market size and forecast, by component
8.2.3.Market size and forecast, by deployment
8.2.4.Market size and forecast, by organization size
8.2.5.Market size and forecast, by application
8.2.6.Market analysis by country
8.2.6.1.U.S.
8.2.6.1.1.Market size and forecast, by component
8.2.6.1.2.Market size and forecast, by deployment
8.2.6.1.3.Market size and forecast, by organization size
8.2.6.1.4.Market size and forecast, by application
8.2.6.2.Canada
8.2.6.2.1.Market size and forecast, by component
8.2.6.2.2.Market size and forecast, by deployment
8.2.6.2.3.Market size and forecast, by organization size
8.2.6.2.4.Market size and forecast, by application
8.3.EUROPE
8.3.1.Key market trends, growth factors and opportunities
8.3.2.Market size and forecast, by component
8.3.3.Market size and forecast, by deployment
8.3.4.Market size and forecast, by organization size
8.3.5.Market size and forecast, by application
8.3.6.Market analysis by country
8.3.6.1.UK
8.3.6.1.1.Market size and forecast, by component
8.3.6.1.2.Market size and forecast, by deployment
8.3.6.1.3.Market size and forecast, by organization size
8.3.6.1.4.Market size and forecast, by application
8.3.6.2.Germany
8.3.6.2.1.Market size and forecast, by component
8.3.6.2.2.Market size and forecast, by deployment
8.3.6.2.3.Market size and forecast, by organization size
8.3.6.2.4.Market size and forecast, by application
8.3.6.3.France
8.3.6.3.1.Market size and forecast, by component
8.3.6.3.2.Market size and forecast, by deployment
8.3.6.3.3.Market size and forecast, by organization size
8.3.6.3.4.Market size and forecast, by application
8.3.6.4.Rest of Europe
8.3.6.4.1.Market size and forecast, by component
8.3.6.4.2.Market size and forecast, by deployment
8.3.6.4.3.Market size and forecast, by organization size
8.3.6.4.4.Market size and forecast, by application
8.4.ASIA-PACIFIC
8.4.1.Key market trends, growth factors and opportunities
8.4.2.Market size and forecast, by component
8.4.3.Market size and forecast, by deployment
8.4.4.Market size and forecast, by organization size
8.4.5.Market size and forecast, by application
8.4.6.Market analysis by country
8.4.6.1.China
8.4.6.1.1.Market size and forecast, by component
8.4.6.1.2.Market size and forecast, by deployment
8.4.6.1.3.Market size and forecast, by organization size
8.4.6.1.4.Market size and forecast, by application
8.4.6.2.India
8.4.6.2.1.Market size and forecast, by component
8.4.6.2.2.Market size and forecast, by deployment
8.4.6.2.3.Market size and forecast, by organization size
8.4.6.2.4.Market size and forecast, by application
8.4.6.3.Japan
8.4.6.3.1.Market size and forecast, by component
8.4.6.3.2.Market size and forecast, by deployment
8.4.6.3.3.Market size and forecast, by organization size
8.4.6.3.4.Market size and forecast, by application
8.4.6.4.Australia
8.4.6.4.1.Market size and forecast, by component
8.4.6.4.2.Market size and forecast, by deployment
8.4.6.4.3.Market size and forecast, by organization size
8.4.6.4.4.Market size and forecast, by application
8.4.6.5.Rest of Asia-Pacific
8.4.6.5.1.Market size and forecast, by component
8.4.6.5.2.Market size and forecast, by deployment
8.4.6.5.3.Market size and forecast, by organization size
8.4.6.5.4.Market size and forecast, by application
8.5.LAMEA
8.5.1.Key market trends, growth factors and opportunities
8.5.2.Market size and forecast, by component
8.5.3.Market size and forecast, by deployment
8.5.4.Market size and forecast, by organization size
8.5.5.Market size and forecast, by application
8.5.6.Market analysis by country
8.5.6.1.Latin America
8.5.6.1.1.Market size and forecast, by component
8.5.6.1.2.Market size and forecast, by deployment
8.5.6.1.3.Market size and forecast, by organization size
8.5.6.1.4.Market size and forecast, by application
8.5.6.2.Middle East
8.5.6.2.1.Market size and forecast, by component
8.5.6.2.2.Market size and forecast, by deployment
8.5.6.2.3.Market size and forecast, by organization size
8.5.6.2.4.Market size and forecast, by application
8.5.6.3.Africa
8.5.6.3.1.Market size and forecast, by component
8.5.6.3.2.Market size and forecast, by deployment
8.5.6.3.3.Market size and forecast, by organization size
8.5.6.3.4.Market size and forecast, by application
CHAPTER 9:COMPETITIVE LANDSCAPE
9.1.COMPETITIVE DASHBOARD
9.2.TOP WINNING STRATEGIES
9.3.KEY DEVELOPMENTS
9.3.1.New product launches
9.3.2.Partnership
9.3.3.Acquisition
9.3.4.Product development
9.3.5.Business expansion
9.3.6.Collaboration
9.3.7.Agreement
CHAPTER 10:COMPANY PROFILE
10.1.ADOBE INC.
10.1.1.Company overview
10.1.2.Key Executives
10.1.3.Company snapshot
10.1.4.Operating business segments
10.1.5.Product portfolio
10.1.6.R&D Expenditure
10.1.7.Business performance
10.1.8.Key strategic moves and developments
10.2.CISCO SYSTEMS, INC.
10.2.1.Company overview
10.2.2.Key Executives
10.2.3.Company snapshot
10.2.4.Product portfolio
10.2.5.R&D Expenditure
10.2.6.Business performance
10.2.7.Key strategic moves and developments
10.3.INTERNATIONAL BUSINESS MACHINES CORPORATION
10.3.1.Company overview
10.3.2.Key Executives
10.3.3.Company snapshot
10.3.4.Operating business segments
10.3.5.Product portfolio
10.3.6.R&D Expenditure
10.3.7.Business performance
10.3.8.Key strategic moves and developments
10.4.ORACLE CORPORATION
10.4.1.Company overview
10.4.2.Key executives
10.4.3.Company snapshot
10.4.4.Operating business segments
10.4.5.Product portfolio
10.4.6.R&D expenditure
10.4.7.Business performance
10.4.8.Key strategic moves and developments
10.5.SAP SE
10.5.1.Company overview
10.5.2.Key Executives
10.5.3.Company snapshot
10.5.4.Operating business segments
10.5.5.Product portfolio
10.5.6.R&D Expenditure
10.5.7.Business performance
10.5.8.Key strategic moves and developments
10.6.SAS INSTITUTE INC.
10.6.1.Company overview
10.6.2.Key Executives
10.6.3.Company snapshot
10.6.4.Product portfolio
10.6.5.Business performance
10.6.6.Key strategic moves and developments
10.7.SISENSE INC.
10.7.1.Company overview
10.7.2.Key Executives
10.7.3.Company snapshot
10.7.4.Product portfolio
10.7.5.Key strategic moves and developments
10.8.TERADATA CORPORATION
10.8.1.Company overview
10.8.2.Key Executives
10.8.3.Company snapshot
10.8.4.Product portfolio
10.8.5.Key strategic moves and developments
10.9.TIBCO SOFTWARE INC.
10.9.1.Company overview
10.9.2.Key Executives
10.9.3.Company snapshot
10.9.4.Product portfolio
10.9.5.Key strategic moves and developments
10.10.TABLEAU SOFTWARE
10.10.1.Company overview
10.10.2.Key Executives
10.10.3.Company snapshot
10.10.4.Product portfolio
10.10.5.R&D Expenditure
10.10.6.Business performance
10.10.7.Key strategic moves and developments
List Of Tables & Figures
Table 01.Big Data Analytics In Retail Market Revenue, By Component, 2019–2027 ($Million)
Table 02.Big Data Analytics In Retail Market Revenue For Software, By Region, 2019–2027 ($Million)
Table 03.Big Data Analytics In Retail Market Revenue For Service, By Region , 2019–2027 ($Million)
Table 04.Big Data Analytics In Retail Market Revenue, By Deployment 2019–2027 ($Million)
Table 05.Big Data Analytics In Retail Market Revenue For On Premise, By Region, 2019–2027 ($Million)
Table 06.Big Data Analytics In Retail Market Revenue For Cloud, By Region, 2019–2027 ($Million)
Table 07.Big Data Analytics In Retail Market Revenue, By Organization Size 2019–2027 ($Million)
Table 08.Big Data Analytics In Retail Market Revenue For Large Enterprises, By Region, 2019–2027 ($Million)
Table 09.Big Data Analytics In Retail Market Revenue For Smes, By Region, 2019–2027 ($Million)
Table 10.Big Data Analytics In Retail Market Revenue, By Application, 2019–2027 ($Million)
Table 11.Big Data Analytics In Retail Market Revenue For Sales And Marketing Analytics, By Region, 2019–2027 ($Million)
Table 12.Big Data Analytics In Retail Market Revenue For Supply Chain Operations Management, By Region, 2019–2027 ($Million)
Table 13.Big Data Analytics In Retail Market Revenue For Merchandising Analytics, By Region, 2019–2027 ($Million)
Table 14.Big Data Analytics In Retail Market Revenue For Risk And Customer Analytics, By Region, 2019–2027 ($Million)
Table 15.Big Data Analytics In Retail Market Revenue For Others, By Region, 2019–2027 ($Million)
Table 16.Big Data Analytics In Retail Market Revenue, By Region, 2019–2027 ($Million)
Table 17.North America Big Data Analytics In Retail Market Revenue, By Component 2019-2027 ($Million)
Table 18.North America Big Data Analytics In Retail Market Revenue, By Deployment, 2019-2027 ($Million)
Table 19.North America Big Data Analytics In Retail Market Revenue, By Organization Size 2019-2027 ($Million)
Table 20.North America Big Data Analytics In Retail Market Revenue, By Application, 2019-2027 ($Million)
Table 21.North America Big Data Analytics In Retail Market Revenue, By Country, 2019-2027 ($Million)
Table 22.U.S. Big Data Analytics In Retail Market Revenue, By Component 2019-2027 ($Million)
Table 23.U.S. Big Data Analytics In Retail Market Revenue, By Deployment, 2019-2027 ($Million)
Table 24.U.S. Big Data Analytics In Retail Market Revenue, By Organization Size, 2019-2027 ($Million)
Table 25.U.S. Big Data Analytics In Retail Market Revenue, By Application, 2019-2027 ($Million)
Table 26.Canada Big Data Analytics In Retail Market Revenue, By Component 2019-2027 ($Million)
Table 27.Canada Big Data Analytics In Retail Market Revenue, By Deployment, 2019-2027 ($Million)
Table 28.Canada Big Data Analytics In Retail Market Revenue, By Organization Size, 2019-2027 ($Million)
Table 29.Canada Big Data Analytics In Retail Market Revenue, By Application, 2019-2027 ($Million)
Table 30.Europe Big Data Analytics In Retail Market Revenue, By Component 2019-2027 ($Million)
Table 31.Europe Big Data Analytics In Retail Market Revenue, By Deployment, 2019-2027 ($Million)
Table 32.Europe Big Data Analytics In Retail Market Revenue, By Organization Size 2019-2027 ($Million)
Table 33.Europe Big Data Analytics In Retail Market Revenue, By Application, 2019-2027 ($Million)
Table 34.Europe Big Data Analytics In Retail Market Revenue, By Country, 2019-2027 ($Million)
Table 35.Uk Big Data Analytics In Retail Market Revenue, By Component 2019-2027 ($Million)
Table 36.Uk Big Data Analytics In Retail Market Revenue, By Deployment, 2019-2027 ($Million)
Table 37.Uk Big Data Analytics In Retail Market Revenue, By Organization Size, 2019-2027 ($Million)
Table 38.Uk Big Data Analytics In Retail Market Revenue, By Application, 2019-2027 ($Million)
Table 39.Germany Big Data Analytics In Retail Market Revenue, By Component 2019-2027 ($Million)
Table 40.Germany Big Data Analytics In Retail Market Revenue, By Deployment, 2019-2027 ($Million)
Table 41.Germany Big Data Analytics In Retail Market Revenue, By Organization Size, 2019-2027 ($Million)
Table 42.Germany Big Data Analytics In Retail Market Revenue, By Application, 2019-2027 ($Million)
Table 43.France Big Data Analytics In Retail Market Revenue, By Component 2019-2027 ($Million)
Table 44.France Big Data Analytics In Retail Market Revenue, By Deployment, 2019-2027 ($Million)
Table 45.France Big Data Analytics In Retail Market Revenue, By Organization Size, 2019-2027 ($Million)
Table 46.France Big Data Analytics In Retail Market Revenue, By Application, 2019-2027 ($Million)
Table 47.Rest Of Europe Big Data Analytics In Retail Market Revenue, By Component 2019-2027 ($Million)
Table 48.Rest Of Europe Big Data Analytics In Retail Market Revenue, By Deployment, 2019-2027 ($Million)
Table 49.Rest Of Europe Big Data Analytics In Retail Market Revenue, By Organization Size, 2019-2027 ($Million)
Table 50.Rest Of Europe Big Data Analytics In Retail Market Revenue, By Application, 2019-2027 ($Million)
Table 51.Asia-Pacific Big Data Analytics In Retail Market Revenue, By Component 2019-2027 ($Million)
Table 52.Asia-Pacific Big Data Analytics In Retail Market Revenue, By Deployment, 2019-2027 ($Million)
Table 53.Asia-Pacific Big Data Analytics In Retail Market Revenue, By Organization Size 2019-2027 ($Million)
Table 54.Asia-Pacific Big Data Analytics In Retail Market Revenue, By Application, 2019-2027 ($Million)
Table 55.Asia-Pacific Big Data Analytics In Retail Market Revenue, By Country, 2019-2027 ($Million)
Table 56.China Big Data Analytics In Retail Market Revenue, By Component 2019-2027 ($Million)
Table 57.China Big Data Analytics In Retail Market Revenue, By Deployment, 2019-2027 ($Million)
Table 58.China Big Data Analytics In Retail Market Revenue, By Organization Size, 2019-2027 ($Million)
Table 59.China Big Data Analytics In Retail Market Revenue, By Application, 2019-2027 ($Million)
Table 60.India Big Data Analytics In Retail Market Revenue, By Component 2019-2027 ($Million)
Table 61.India Big Data Analytics In Retail Market Revenue, By Deployment, 2019-2027 ($Million)
Table 62.India Big Data Analytics In Retail Market Revenue, By Organization Size, 2019-2027 ($Million)
Table 63.India Big Data Analytics In Retail Market Revenue, By Application, 2019-2027 ($Million)
Table 64.Japan Big Data Analytics In Retail Market Revenue, By Component 2019-2027 ($Million)
Table 65.Japan Big Data Analytics In Retail Market Revenue, By Deployment, 2019-2027 ($Million)
Table 66.Japan Big Data Analytics In Retail Market Revenue, By Organization Size, 2019-2027 ($Million)
Table 67.Japan Big Data Analytics In Retail Market Revenue, By Application, 2019-2027 ($Million)
Table 68.Australia Big Data Analytics In Retail Market Revenue, By Component 2019-2027 ($Million)
Table 69.Australia Big Data Analytics In Retail Market Revenue, By Deployment, 2019-2027 ($Million)
Table 70.Australia Big Data Analytics In Retail Market Revenue, By Organization Size, 2019-2027 ($Million)
Table 71.Australia Big Data Analytics In Retail Market Revenue, By Application, 2019-2027 ($Million)
Table 72.Rest Of Asia-Pacific Big Data Analytics In Retail Market Revenue, By Component 2019-2027 ($Million)
Table 73.Rest Of Asia-Pacific Big Data Analytics In Retail Market Revenue, By Deployment, 2019-2027 ($Million)
Table 74.Rest Of Asia-Pacific Big Data Analytics In Retail Market Revenue, By Organization Size, 2019-2027 ($Million)
Table 75.Rest Of Asia-Pacific Big Data Analytics In Retail Market Revenue, By Application, 2019-2027 ($Million)
Table 76.Lamea Big Data Analytics In Retail Market Revenue, By Component 2019-2027 ($Million)
Table 77.Lamea Big Data Analytics In Retail Market Revenue, By Deployment, 2019-2027 ($Million)
Table 78.Lamea Big Data Analytics In Retail Market Revenue, By Organization Size 2019-2027 ($Million)
Table 79.Lamea Big Data Analytics In Retail Market Revenue, By Application, 2019-2027 ($Million)
Table 80.Lamea Big Data Analytics In Retail Market Revenue, By Country, 2017-2025 ($Million)
Table 81.Latin America Big Data Analytics In Retail Market Revenue, By Component 2019-2027 ($Million)
Table 82.Latin America Big Data Analytics In Retail Market Revenue, By Deployment, 2019-2027 ($Million)
Table 83.Latin America Big Data Analytics In Retail Market Revenue, By Organization Size, 2019-2027 ($Million)
Table 84.Latin America Big Data Analytics In Retail Market Revenue, By Application, 2019-2027 ($Million)
Table 85.Middle East Big Data Analytics In Retail Market Revenue, By Component 2019-2027 ($Million)
Table 86.Middle East Big Data Analytics In Retail Market Revenue, By Deployment, 2019-2027 ($Million)
Table 87.Middle East Big Data Analytics In Retail Market Revenue, By Organization Size, 2019-2027 ($Million)
Table 88.Middle East Big Data Analytics In Retail Market Revenue, By Application, 2019-2027 ($Million)
Table 89.Africa Big Data Analytics In Retail Market Revenue, By Component 2019-2027 ($Million)
Table 90.Africa Big Data Analytics In Retail Market Revenue, By Deployment, 2019-2027 ($Million)
Table 91.Africa Big Data Analytics In Retail Market Revenue, By Organization Size, 2019-2027 ($Million)
Table 92.Africa Big Data Analytics In Retail Market Revenue, By Application, 2019-2027 ($Million)
Table 93.Key New Product Launches (2016-2019)
Table 94.Partnership (2016-2019)
Table 95.Acquistion (2016-2019)
Table 96.Product Development (2016-2019)
Table 97.Key Expansions (2016-2019)
Table 98.Collaboration (2016-2019)
Table 99.Agreement (2016-2019)
Table 100.Adobe Inc.: Key Executives
Table 101.Adobe Inc.: Company Snapshot
Table 102.Adobe Inc.: Operating Segments
Table 103.Adobe Inc.: Product Portfolio
Table 104.Cisco Systems, Inc.: Key Executives
Table 105.Cisco Systems, Inc.: Company Snapshot
Table 106.Cisco Systems, Inc.: Product Portfolio
Table 107.International Business Machines Corporation: Key Executives
Table 108.International Business Machines Corporation: Company Snapshot
Table 109.International Business Machines Corporation: Operating Segments
Table 110.International Business Machines Corporation: Product Portfolio
Table 111.Oracle Corporation: Key Executives
Table 112.Oracle Corporation: Company Snapshot
Table 113.Oracle Corporation: Operating Segments
Table 114.Oracle Corporation: Product Portfolio
Table 115.Oracle Corporation: Key Strategic Moves And Developments
Table 116.Sap Se: Key Executives
Table 117.Sap Se: Company Snapshot
Table 118.Sap Se: Operating Segments
Table 119.Sap Se: Product Portfolio
Table 120.Sas Institute Inc.: Key Executives
Table 121.Sas Institute Inc.: Company Snapshot
Table 122.Sas Institute Inc.: Product Portfolio
Table 123.Sisense Inc.: Key Executives
Table 124.Sisense Inc.: Company Snapshot
Table 125.Sisense Inc.: Product Portfolio
Table 126.Teradata Corporation: Company Snapshot
Table 127.Teradata Corporation: Product Portfolio
Table 128.Tibco Software Inc.: Key Executives
Table 129.Tibco Software Inc.: Company Snapshot
Table 130.Tibco Software Inc.: Product Portfolio
Table 131.Tableau Software: Key Executives
Table 132.Tableau Software: Company Snapshot
Table 133.Tableau Software: Product Portfolio
List Of Figures
Figure 01.Key Market Segments
Figure 02.Big Data Analytics In Retail Market, 2019–2027
Figure 03.Big Data Analytics In Retail Market, By Region, 2019-2027
Figure 04.Top Impacting Factors
Figure 05.Top Investment Pockets
Figure 06.Moderate Bargaining Power Of Suppliers
Figure 07.Low-To-Moderate Bargaining Power Of Buyers
Figure 08.Low-To-Moderate Threat Of Substitutes
Figure 09.Moderate-To-High Threat Of New Entrants
Figure 10.Low-To-High Competitive Rivalry
Figure 11.Big Data Analytics In Retail Anlytics Market: Key Player Positioning
Figure 12.Big Data Analytics In Retail Market Revenue, By Component, 2019–2027($Billion)
Figure 13.Comparative Share Analysis Of Big Data Analytics In Retail Market For Software, By Region, 2019 & 2027 (%)
Figure 14.Comparative Share Analysis Of Big Data Analytics In Retail Market For Service, By Region, 2019 & 2027 (%)
Figure 15.Big Data Analytics In Retail Market Revenue, By Deployment, 2019–2027($Billion)
Figure 16.Comparative Share Analysis Of Big Data Analytics In Retail Market For On Premise, By Region, 2019 & 2027 (%)
Figure 17.Comparative Share Analysis Of Big Data Analytics In Retail Market For Cloud, By Region, 2019 & 2027 (%)
Figure 18.Big Data Analytics In Retail Market Revenue, By Organization Size, 2019–2027($Billion)
Figure 19.Comparative Share Analysis Of Big Data Analytics In Retail Market For Large Enterprises, By Region, 2019 & 2027 (%)
Figure 20.Comparative Share Analysis Of Big Data Analytics In Retail Market For Smes, By Region, 2019 & 2027 (%)
Figure 21.Big Data Analytics In Retail Market Revenue, By Application, 2019–2027($Billion)
Figure 22.Comparative Share Analysis Of Big Data Analytics In Retail Market For Sales And Marketing Analytics, By Region, 2019 & 2027 (%)
Figure 23.Comparative Share Analysis Of Big Data Analytics In Retail Market For Supply Chain Operations Management, By Region, 2019 & 2027 (%)
Figure 24.Comparative Share Analysis Of Big Data Analytics In Retail Market For Merchandising Analytics, By Region, 2019 & 2027 (%)
Figure 25.Comparative Share Analysis Of Big Data Analytics In Retail Market For Customer Analytics, By Region, 2019 & 2027 (%)
Figure 26.Comparative Share Analysis Of Big Data Analytics In Retail Market For Others, By Region, 2019 & 2027 (%)
Figure 27.U.S. Big Data Analytics In Retail Market Revenue, 2019-2027 ($Million)
Figure 28.Canada Big Data Analytics In Retail Market Revenue, 2019-2027 ($Million)
Figure 29.Uk Big Data Analytics In Retail Market Revenue, 2019-2027 ($Million)
Figure 30.Germany Big Data Analytics In Retail Market Revenue, 2019-2027 ($Million)
Figure 31.France Big Data Analytics In Retail Market Revenue, 2019-2027 ($Million)
Figure 32.Rest Of Europe Big Data Analytics In Retail Market Revenue, 2019-2027 ($Million)
Figure 33.China Big Data Analytics In Retail Market Revenue, 2019-2027 ($Million)
Figure 34.India Big Data Analytics In Retail Market Revenue, 2019-2027 ($Million)
Figure 35.Japan Big Data Analytics In Retail Market Revenue, 2019-2027 ($Million)
Figure 36.Australia Big Data Analytics In Retail Market Revenue, 2019-2027 ($Million)
Figure 37.Rest Of Asia-Pacific Big Data Analytics In Retail Market Revenue, 2019-2027 ($Million)
Figure 38.Latin America Big Data Analytics In Retail Market Revenue, 2019-2027 ($Million)
Figure 39.Middle East Big Data Analytics In Retail Market Revenue, 2019-2027 ($Million)
Figure 40.Africa Big Data Analytics In Retail Market Revenue, 2019-2027 ($Million)
Figure 41.Competitive Dashboard
Figure 42.Competitive Dashboard
Figure 43.Competitive Heatmap Of Key Players
Figure 44.Top Winning Strategies, By Year, 2016-2019
Figure 45.Top Winning Strategies, By Development, 2016-2019
Figure 46.Top Winning Strategies, By Company, 2016-2019
Figure 47.R&D Expenditure, 2016–2018 ($Million)
Figure 48.Adobe Inc.: Revenue, 2016–2018 ($Million)
Figure 49.Adobe Inc.: Revenue Share By Segment, 2018 (%)
Figure 50.Adobe Inc.: Revenue Share By Region, 2018 (%)
Figure 51.R&D Expenditure, 2016–2018 ($Million)
Figure 52.Cisco Systems, Inc.: Revenue, 2016–2018 ($Million)
Figure 53.Cisco Systems, Inc.: Revenue Share By Region, 2018 (%)
Figure 54.R&D Expenditure, 2016–2018 ($Million)
Figure 55.International Business Machines Corporation: Revenue, 2016–2018 ($Million)
Figure 56.International Business Machines Corporation: Revenue Share By Segment, 2018 (%)
Figure 57.International Business Machines Corporation: Revenue Share By Region, 2018 (%)
Figure 58.R&D Expenditure, 2016–2018 ($Million)
Figure 59.Oracle Corporation: Revenue, 2016–2018 ($Million)
Figure 60.Oracle Corporation: Revenue Share By Segment, 2018 (%)
Figure 61.Oracle Corporation: Revenue Share By Region, 2018 (%)
Figure 62.R&D Expenditure, 2016–2018 ($Million)
Figure 63.Sap Se: Revenue, 2016–2018 ($Million)
Figure 64.Sap Se: Revenue Share By Segment, 2018 (%)
Figure 65.Sap Se: Revenue Share By Region, 2018 (%)
Figure 66.Sas Institute Inc.: Revenue, 2016–2018 ($Million)
Figure 67.Teradata Corporation: Key Executives
Figure 68.R&D Expenditure, 2016–2018 ($Million)
Figure 69.Tableau Software: Revenue, 2016–2018 ($Million)
Figure 70.Tableau Software: Revenue Share By Region, 2018 (%)
$5769
$8995
HAVE A QUERY?
OUR CUSTOMER

SIMILAR REPORTS
Add to Cart
Add to Cart
Add to Cart
Add to Cart