0
U.S. (TOLL FREE)
+1 (315) 215-3225
Automative

0
U.S. (TOLL FREE)
+1 (315) 215-3225
Connected Retail Market Size, Share, Statistics & Trends Analysis Report By Type, By Application, By Region, and Segment Forecasts, 2021-2027
Published Date: July 2021
|
Report Code: QYRE-Auto-3A6351
Home | Market Reports | Business & Industrial| Retail Trade
Global Connected Retail Market Size Status and Forecast 2021 2027
BUY CHAPTERS

Connected Retail Market Size, Share, Statistics & Trends Analysis Report By Type, By Application, By Region, and Segment Forecasts, 2021-2027

Code: QYRE-Auto-3A6351
Report
July 2021
Pages:106
QYResearch
Buy Now with 15% Discount
DESCRIPTION
TABLE OF CONTENT
TABLES & FIGURES

Connected Retail Market Statistics 2027

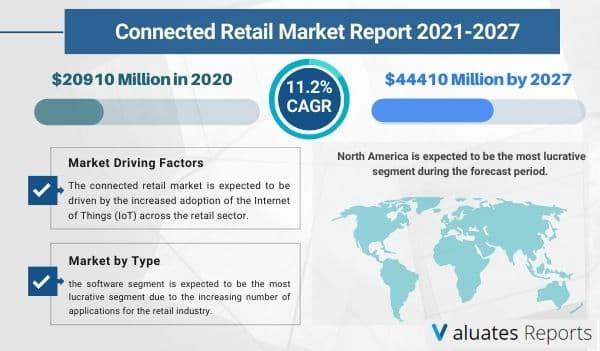
The global Connected Retail market size is projected to reach US$ 44410 million by 2028, from US$ 20910 million in 2021, at a CAGR of 11.2% during 2022-2028. Key drivers of the connected retail market include the rapid digitization and proliferation of IoT-connected devices in the retail industry. 

The advent of omnichannel retailing will fuel the growth of the connected retail market in the coming years.

The reduction in costs of sensors and RFID tags will be beneficial for retailers in turn driving the expansion of the market during the forecast period.

 
Connected retail Market

Connected Retail Market Trends

Internet of Things

Connected retail promotes easy collaboration between various stakeholders and decreases operating costs by following a lean structure. The pandemic-fueled rise of digitization has changed consumer buying habits completely. Smartphones, wearables, tablets, and portable connected devices are penetrating the retail industry. This will expand the growth of the connected retail market during the forecast period. The use of sensors through retail IoT devices helps in data collecting, gathering, and gaining information on the entire product lifecycle which gives detailed insights to managers for making informed decisions and improving the consumer experience. The connected machines collect crucial data both from in-store purchases and online websites to drive resiliency and efficiency. Nowadays, a customer’s buying journey is very complex. Sensors can accurately track and analyze their habits so that content managers can introduce hypersegmentation practices and create a personalized shopping experience for customers. It also helps in optimizing product usage and maintenance. Connected retail can track other vital metrics like customer wait time at counters to make the shopping experience convenient, fun, and memorable. Moreover, IoT devices like drones monitor inventories and fastrack the warehouse management process. 

The advent of omnichannel retail experience

The rapid boom of the eCommerce industry has forced big retail companies to adopt multiple marketing channels to cater to the varying needs of a wide group of consumers. It is no longer a nice-to-have feature. Organizations need to adapt and incorporate omnichannel strategies to remain competitive. A seamless shopping experience across several touchpoints is crucial as consumers are discovering brands in newer ways. This will bolster the growth of the connected retail market in the forthcoming years. Customers want to buy as per their preferred channel. Hence brands are using omnichannel techniques to sell products at their convenience using connected retail. It increases customer loyalty and retention. With round-the-clock real-time support and variable payment feature, client satisfaction reaches new levels. Combining online and offline experiences creates long-term value and trust. 

RFID tags and sensors

Radiofrequency identification tags are getting cheaper and retailers are increasingly using this technology for faster inventory counting. It uses radio waves to detect the tags attached to the objects. The electronically stored information is read through portable handheld devices. This leads to improved shipping accuracy and reduced wastage of inventory. The chances of over or underproduction are decreased significantly in turn driving the growth of the connected retail market during the forecast period. Stocks are replenished quickly and out-of-stock situations are avoided to a larger extent thereby increasing customer satisfaction. The real-time viewing systems trigger automatic alerts across the entire supply chain process. Moreover, the key performance is measured efficiently with detailed analytics on visual dashboards. The reliance on historical data is avoided completely. 

Connected Retail Market Share Analysis

Based on type, the hardware segment is expected to dominate in the connected retail market share due to the proliferation of connected devices at retailers and consumer levels. The extensive use of sensors, RFID tags, and communication chips for monitoring customer behavior. On the other hand, the software segment will grow the fastest due to the deployment of IoT-based services for gathering important information.

Based on application, the segmentations include industrial and enterprise. 

Based on region, North America will be the most lucrative during the forecast period due to rapidly expanding IoT infrastructure and huge demand for connected solutions in retail for reducing operational costs, driving employee efficiency, and improving the consumer experience. 

Connected Retail Market by Type

  • Hardware
  • Software

Connected Retail Market by Application

  • Industrial
  • Enterprise
  • Others

Major Players in the Connected Retail Market by Application

  • Zebra Technologies
  • Softweb Solutions
  • SAP
  • PTC
  • Microsoft
  • Intel
  • IBM
  • Cisco Systems
  • Atmel
  • ARM

Scope of the Connected Retail Market Report

Report Metric

Details

Report Name

Connected Retail Market

The market size in 2020

USD 20910 Million

The revenue forecast in 2027

USD 44410 Million

Growth Rate

CAGR of 11.2% from 2021 to 2027

Base year considered

2019

Market size available for years

2021-2027

Forecast units

Value (USD)

Segments covered

Type, End-User, Offerings, and Region

Report coverage

Revenue & volume forecast, company share, competitive landscape, growth factors, and trends

Geographic regions covered

North America, Europe, Asia Pacific, Latin America, Middle East & Africa

Frequently Asked Questions About This Report

1. How big is the connected retail market?

Ans. The global connected retail market size is projected to reach USD 44410 Million by 2027, from USD 20910 Million in 2020, at a CAGR of 11.2% during the forecast period 2021-2027.

2. What are the market drivers in the global connected retail market?

Ans. The introduction of IoT into the retail industry has radically altered the retail landscape. The integration of IoT sensors in various consumer gadgets will help merchants to analyze and monitor customer behavior, collect data, and give a superior consumer experience. These advantages are offered is expected to drive the growth of the connected retail market.

3. Who are the key players in the connected retail market?

Ans. The major vendors operating in the connected retail market include Brands, Zebra technologies, Softweb Solutions, SAP, PTC Inc, Microsoft, Intel, IBM, Cisco Systems, Atmel, ARM, Others.

4. What would be the forecast period in the connected retail market report?

Ans. The forecast period for the connected retail market is 2021 to 2027

5. Which is the most influencing segment growing in the global connected retail market report?

Ans. Based on type, the software segment is expected to be the most lucrative segment due to the increasing number of applications for the retail industry.

6. Which region dominated the global connected retail market share?

Ans. Based on retail, North America is expected to be the most lucrative segment during the forecast period.

Table of Content
 
 
1 Report Overview
1.1 Study Scope
1.2 Market Analysis by Type
1.2.1 Global Connected Retail Market Size Growth Rate by Type: 2016 VS 2021 VS 2027
1.2.2 Hardware
1.2.3 Software
1.3 Market by Application
1.3.1 Global Connected Retail Market Share by Application: 2016 VS 2021 VS 2027
1.3.2 Industrial
1.3.3 Enterprise
1.3.4 Others
1.4 Study Objectives
1.5 Years Considered
2 Global Growth Trends
2.1 Global Connected Retail Market Perspective (2016-2027)
2.2 Connected Retail Growth Trends by Regions
2.2.1 Connected Retail Market Size by Regions: 2016 VS 2021 VS 2027
2.2.2 Connected Retail Historic Market Share by Regions (2016-2021)
2.2.3 Connected Retail Forecasted Market Size by Regions (2022-2027)
2.3 Connected Retail Industry Dynamic
2.3.1 Connected Retail Market Trends
2.3.2 Connected Retail Market Drivers
2.3.3 Connected Retail Market Challenges
2.3.4 Connected Retail Market Restraints
3 Competition Landscape by Key Players
3.1 Global Top Connected Retail Players by Revenue
3.1.1 Global Top Connected Retail Players by Revenue (2016-2021)
3.1.2 Global Connected Retail Revenue Market Share by Players (2016-2021)
3.2 Global Connected Retail Market Share by Company Type (Tier 1, Tier 2 and Tier 3)
3.3 Players Covered: Ranking by Connected Retail Revenue
3.4 Global Connected Retail Market Concentration Ratio
3.4.1 Global Connected Retail Market Concentration Ratio (CR5 and HHI)
3.4.2 Global Top 10 and Top 5 Companies by Connected Retail Revenue in 2020
3.5 Connected Retail Key Players Head office and Area Served
3.6 Key Players Connected Retail Product Solution and Service
3.7 Date of Enter into Connected Retail Market
3.8 Mergers & Acquisitions, Expansion Plans
4 Connected Retail Breakdown Data by Type
4.1 Global Connected Retail Historic Market Size by Type (2016-2021)
4.2 Global Connected Retail Forecasted Market Size by Type (2022-2027)
5 Connected Retail Breakdown Data by Application
5.1 Global Connected Retail Historic Market Size by Application (2016-2021)
5.2 Global Connected Retail Forecasted Market Size by Application (2022-2027)
6 North America
6.1 North America Connected Retail Market Size (2016-2027)
6.2 North America Connected Retail Market Size by Type
6.2.1 North America Connected Retail Market Size by Type (2016-2021)
6.2.2 North America Connected Retail Market Size by Type (2022-2027)
6.2.3 North America Connected Retail Market Size by Type (2016-2027)
6.3 North America Connected Retail Market Size by Application
6.3.1 North America Connected Retail Market Size by Application (2016-2021)
6.3.2 North America Connected Retail Market Size by Application (2022-2027)
6.3.3 North America Connected Retail Market Size by Application (2016-2027)
6.4 North America Connected Retail Market Size by Country
6.4.1 North America Connected Retail Market Size by Country (2016-2021)
6.4.2 North America Connected Retail Market Size by Country (2022-2027)
6.4.3 United States
6.4.4 Canada
7 Europe
7.1 Europe Connected Retail Market Size (2016-2027)
7.2 Europe Connected Retail Market Size by Type
7.2.1 Europe Connected Retail Market Size by Type (2016-2021)
7.2.2 Europe Connected Retail Market Size by Type (2022-2027)
7.2.3 Europe Connected Retail Market Size by Type (2016-2027)
7.3 Europe Connected Retail Market Size by Application
7.3.1 Europe Connected Retail Market Size by Application (2016-2021)
7.3.2 Europe Connected Retail Market Size by Application (2022-2027)
7.3.3 Europe Connected Retail Market Size by Application (2016-2027)
7.4 Europe Connected Retail Market Size by Country
7.4.1 Europe Connected Retail Market Size by Country (2016-2021)
7.4.2 Europe Connected Retail Market Size by Country (2022-2027)
7.4.3 Germany
7.4.4 France
7.4.5 U.K.
7.4.6 Italy
7.4.7 Russia
7.4.8 Nordic
8 Asia-Pacific
8.1 Asia-Pacific Connected Retail Market Size (2016-2027)
8.2 Asia-Pacific Connected Retail Market Size by Type
8.2.1 Asia-Pacific Connected Retail Market Size by Type (2016-2021)
8.2.2 Asia-Pacific Connected Retail Market Size by Type (2022-2027)
8.2.3 Asia-Pacific Connected Retail Market Size by Type (2016-2027)
8.3 Asia-Pacific Connected Retail Market Size by Application
8.3.1 Asia-Pacific Connected Retail Market Size by Application (2016-2021)
8.3.2 Asia-Pacific Connected Retail Market Size by Application (2022-2027)
8.3.3 Asia-Pacific Connected Retail Market Size by Application (2016-2027)
8.4 Asia-Pacific Connected Retail Market Size by Region
8.4.1 Asia-Pacific Connected Retail Market Size by Region (2016-2021)
8.4.2 Asia-Pacific Connected Retail Market Size by Region (2022-2027)
8.4.3 China
8.4.4 Japan
8.4.5 South Korea
8.4.6 Southeast Asia
8.4.7 India
8.4.8 Australia
9 Latin America
9.1 Latin America Connected Retail Market Size (2016-2027)
9.2 Latin America Connected Retail Market Size by Type
9.2.1 Latin America Connected Retail Market Size by Type (2016-2021)
9.2.2 Latin America Connected Retail Market Size by Type (2022-2027)
9.2.3 Latin America Connected Retail Market Size by Type (2016-2027)
9.3 Latin America Connected Retail Market Size by Application
9.3.1 Latin America Connected Retail Market Size by Application (2016-2021)
9.3.2 Latin America Connected Retail Market Size by Application (2022-2027)
9.3.3 Latin America Connected Retail Market Size by Application (2016-2027)
9.4 Latin America Connected Retail Market Size by Country
9.4.1 Latin America Connected Retail Market Size by Country (2016-2021)
9.4.2 Latin America Connected Retail Market Size by Country (2022-2027)
9.4.3 Mexico
9.4.4 Brazil
10 Middle East & Africa
10.1 Middle East & Africa Connected Retail Market Size (2016-2027)
10.2 Middle East & Africa Connected Retail Market Size by Type
10.2.1 Middle East & Africa Connected Retail Market Size by Type (2016-2021)
10.2.2 Middle East & Africa Connected Retail Market Size by Type (2022-2027)
10.2.3 Middle East & Africa Connected Retail Market Size by Type (2016-2027)
10.3 Middle East & Africa Connected Retail Market Size by Application
10.3.1 Middle East & Africa Connected Retail Market Size by Application (2016-2021)
10.3.2 Middle East & Africa Connected Retail Market Size by Application (2022-2027)
10.3.3 Middle East & Africa Connected Retail Market Size by Application (2016-2027)
10.4 Middle East & Africa Connected Retail Market Size by Country
10.4.1 Middle East & Africa Connected Retail Market Size by Country (2016-2021)
10.4.2 Middle East & Africa Connected Retail Market Size by Country (2022-2027)
10.4.3 Turkey
10.4.4 Saudi Arabia
10.4.5 UAE
11 Key Players Profiles
11.1 Zebra Technologies
11.1.1 Zebra Technologies Company Details
11.1.2 Zebra Technologies Business Overview
11.1.3 Zebra Technologies Connected Retail Introduction
11.1.4 Zebra Technologies Revenue in Connected Retail Business (2016-2021)
11.1.5 Zebra Technologies Recent Development
11.2 Softweb Solutions
11.2.1 Softweb Solutions Company Details
11.2.2 Softweb Solutions Business Overview
11.2.3 Softweb Solutions Connected Retail Introduction
11.2.4 Softweb Solutions Revenue in Connected Retail Business (2016-2021)
11.2.5 Softweb Solutions Recent Development
11.3 SAP
11.3.1 SAP Company Details
11.3.2 SAP Business Overview
11.3.3 SAP Connected Retail Introduction
11.3.4 SAP Revenue in Connected Retail Business (2016-2021)
11.3.5 SAP Recent Development
11.4 PTC
11.4.1 PTC Company Details
11.4.2 PTC Business Overview
11.4.3 PTC Connected Retail Introduction
11.4.4 PTC Revenue in Connected Retail Business (2016-2021)
11.4.5 PTC Recent Development
11.5 Microsoft
11.5.1 Microsoft Company Details
11.5.2 Microsoft Business Overview
11.5.3 Microsoft Connected Retail Introduction
11.5.4 Microsoft Revenue in Connected Retail Business (2016-2021)
11.5.5 Microsoft Recent Development
11.6 Intel
11.6.1 Intel Company Details
11.6.2 Intel Business Overview
11.6.3 Intel Connected Retail Introduction
11.6.4 Intel Revenue in Connected Retail Business (2016-2021)
11.6.5 Intel Recent Development
11.7 IBM
11.7.1 IBM Company Details
11.7.2 IBM Business Overview
11.7.3 IBM Connected Retail Introduction
11.7.4 IBM Revenue in Connected Retail Business (2016-2021)
11.7.5 IBM Recent Development
11.8 Cisco Systems
11.8.1 Cisco Systems Company Details
11.8.2 Cisco Systems Business Overview
11.8.3 Cisco Systems Connected Retail Introduction
11.8.4 Cisco Systems Revenue in Connected Retail Business (2016-2021)
11.8.5 Cisco Systems Recent Development
11.9 Atmel
11.9.1 Atmel Company Details
11.9.2 Atmel Business Overview
11.9.3 Atmel Connected Retail Introduction
11.9.4 Atmel Revenue in Connected Retail Business (2016-2021)
11.9.5 Atmel Recent Development
11.10 ARM
11.10.1 ARM Company Details
11.10.2 ARM Business Overview
11.10.3 ARM Connected Retail Introduction
11.10.4 ARM Revenue in Connected Retail Business (2016-2021)
11.10.5 ARM Recent Development
12 Analyst's Viewpoints/Conclusions
13 Appendix
13.1 Research Methodology
13.1.1 Methodology/Research Approach
13.1.2 Data Source
13.2 Disclaimer
13.3 Author Details
List of Tables
    Table 1. Global Connected Retail Market Size Growth Rate by Type (US$ Million):2016 VS 2021 VS 2027
    Table 2. Key Players of Hardware
    Table 3. Key Players of Software
    Table 4. Global Connected Retail Market Size Growth by Application (US$ Million): 2016 VS 2021 VS 2027
    Table 5. Global Connected Retail Market Size by Regions (US$ Million): 2016 VS 2021 VS 2027
    Table 6. Global Connected Retail Market Size by Regions (2016-2021) & (US$ Million)
    Table 7. Global Connected Retail Market Share by Regions (2016-2021)
    Table 8. Global Connected Retail Forecasted Market Size by Regions (2022-2027) & (US$ Million)
    Table 9. Global Connected Retail Market Share by Regions (2022-2027)
    Table 10. Connected Retail Market Trends
    Table 11. Connected Retail Market Drivers
    Table 12. Connected Retail Market Challenges
    Table 13. Connected Retail Market Restraints
    Table 14. Global Connected Retail Revenue by Players (2016-2021) & (US$ Million)
    Table 15. Global Connected Retail Market Share by Players (2016-2021)
    Table 16. Global Top Connected Retail Players by Company Type (Tier 1, Tier 2 and Tier 3) (based on the Revenue in Connected Retail as of 2020)
    Table 17. Ranking of Global Top Connected Retail Companies by Revenue (US$ Million) in 2020
    Table 18. Global 5 Largest Players Market Share by Connected Retail Revenue (CR5 and HHI) & (2016-2021)
    Table 19. Key Players Headquarters and Area Served
    Table 20. Key Players Connected Retail Product Solution and Service
    Table 21. Date of Enter into Connected Retail Market
    Table 22. Mergers & Acquisitions, Expansion Plans
    Table 23. Global Connected Retail Market Size by Type (2016-2021) (US$ Million)
    Table 24. Global Connected Retail Revenue Market Share by Type (2016-2021)
    Table 25. Global Connected Retail Forecasted Market Size by Type (2022-2027) (US$ Million)
    Table 26. Global Connected Retail Revenue Market Share by Type (2022-2027) & (US$ Million)
    Table 27. Global Connected Retail Market Size Share by Application (2016-2021) & (US$ Million)
    Table 28. Global Connected Retail Revenue Market Share by Application (2016-2021)
    Table 29. Global Connected Retail Forecasted Market Size by Application (2022-2027) (US$ Million)
    Table 30. Global Connected Retail Revenue Market Share by Application (2022-2027) & (US$ Million)
    Table 31. North America Connected Retail Market Size by Type (2016-2021) (US$ Million)
    Table 32. North America Connected Retail Market Size by Type (2022-2027) & (US$ Million)
    Table 33. North America Connected Retail Market Size by Application (2016-2021) (US$ Million)
    Table 34. North America Connected Retail Market Size by Application (2022-2027) & (US$ Million)
    Table 35. North America Connected Retail Market Size by Country (2016-2021) & (US$ Million)
    Table 36. North America Connected Retail Market Size by Country (2022-2027) & (US$ Million)
    Table 37. Europe Connected Retail Market Size by Type (2016-2021) (US$ Million)
    Table 38. Europe Connected Retail Market Size by Type (2022-2027) & (US$ Million)
    Table 39. Europe Connected Retail Market Size by Application (2016-2021) (US$ Million)
    Table 40. Europe Connected Retail Market Size by Application (2022-2027) & (US$ Million)
    Table 41. Europe Connected Retail Market Size by Country (2016-2021) & (US$ Million)
    Table 42. Europe Connected Retail Market Size by Country (2022-2027) & (US$ Million)
    Table 43. Asia-Pacific Connected Retail Market Size by Type (2016-2021) (US$ Million)
    Table 44. Asia-Pacific Connected Retail Market Size by Type (2022-2027) & (US$ Million)
    Table 45. Asia-Pacific Connected Retail Market Size by Application (2016-2021) (US$ Million)
    Table 46. Asia-Pacific Connected Retail Market Size by Application (2022-2027) & (US$ Million)
    Table 47. Asia-Pacific Connected Retail Market Size by Region (2016-2021) & (US$ Million)
    Table 48. Asia-Pacific Connected Retail Market Size by Region (2022-2027) & (US$ Million)
    Table 49. Latin America Connected Retail Market Size by Type (2016-2021) (US$ Million)
    Table 50. Latin America Connected Retail Market Size by Type (2022-2027) & (US$ Million)
    Table 51. Latin America Connected Retail Market Size by Application (2016-2021) (US$ Million)
    Table 52. Latin America Connected Retail Market Size by Application (2022-2027) & (US$ Million)
    Table 53. Latin America Connected Retail Market Size by Country (2016-2021) & (US$ Million)
    Table 54. Latin America Connected Retail Market Size by Country (2022-2027) & (US$ Million)
    Table 55. Middle East & Africa Connected Retail Market Size by Type (2016-2021) (US$ Million)
    Table 56. Middle East & Africa Connected Retail Market Size by Type (2022-2027) & (US$ Million)
    Table 57. Middle East & Africa Connected Retail Market Size by Application (2016-2021) (US$ Million)
    Table 58. Middle East & Africa Connected Retail Market Size by Application (2022-2027) & (US$ Million)
    Table 59. Middle East & Africa Connected Retail Market Size by Country (2016-2021) & (US$ Million)
    Table 60. Middle East & Africa Connected Retail Market Size by Country (2022-2027) & (US$ Million)
    Table 61. Zebra Technologies Company Details
    Table 62. Zebra Technologies Business Overview
    Table 63. Zebra Technologies Connected Retail Product
    Table 64. Zebra Technologies Revenue in Connected Retail Business (2016-2021) & (US$ Million)
    Table 65. Zebra Technologies Recent Development
    Table 66. Softweb Solutions Company Details
    Table 67. Softweb Solutions Business Overview
    Table 68. Softweb Solutions Connected Retail Product
    Table 69. Softweb Solutions Revenue in Connected Retail Business (2016-2021) & (US$ Million)
    Table 70. Softweb Solutions Recent Development
    Table 71. SAP Company Details
    Table 72. SAP Business Overview
    Table 73. SAP Connected Retail Product
    Table 74. SAP Revenue in Connected Retail Business (2016-2021) & (US$ Million)
    Table 75. SAP Recent Development
    Table 76. PTC Company Details
    Table 77. PTC Business Overview
    Table 78. PTC Connected Retail Product
    Table 79. PTC Revenue in Connected Retail Business (2016-2021) & (US$ Million)
    Table 80. PTC Recent Development
    Table 81. Microsoft Company Details
    Table 82. Microsoft Business Overview
    Table 83. Microsoft Connected Retail Product
    Table 84. Microsoft Revenue in Connected Retail Business (2016-2021) & (US$ Million)
    Table 85. Microsoft Recent Development
    Table 86. Intel Company Details
    Table 87. Intel Business Overview
    Table 88. Intel Connected Retail Product
    Table 89. Intel Revenue in Connected Retail Business (2016-2021) & (US$ Million)
    Table 90. Intel Recent Development
    Table 91. IBM Company Details
    Table 92. IBM Business Overview
    Table 93. IBM Connected Retail Product
    Table 94. IBM Revenue in Connected Retail Business (2016-2021) & (US$ Million)
    Table 95. IBM Recent Development
    Table 96. Cisco Systems Company Details
    Table 97. Cisco Systems Business Overview
    Table 98. Cisco Systems Revenue in Connected Retail Business (2016-2021) & (US$ Million)
    Table 99. Cisco Systems Recent Development
    Table 100. Atmel Company Details
    Table 101. Atmel Business Overview
    Table 102. Atmel Connected Retail Product
    Table 103. Atmel Revenue in Connected Retail Business (2016-2021) & (US$ Million)
    Table 104. Atmel Recent Development
    Table 105. ARM Company Details
    Table 106. ARM Business Overview
    Table 107. ARM Connected Retail Product
    Table 108. ARM Revenue in Connected Retail Business (2016-2021) & (US$ Million)
    Table 109. ARM Recent Development
    Table 110. Research Programs/Design for This Report
    Table 111. Key Data Information from Secondary Sources
    Table 112. Key Data Information from Primary Sources
List of Figures
    Figure 1. Global Connected Retail Market Share by Type: 2020 VS 2027
    Figure 2. Hardware Features
    Figure 3. Software Features
    Figure 4. Global Connected Retail Market Share by Application: 2020 VS 2027
    Figure 5. Industrial Case Studies
    Figure 6. Enterprise Case Studies
    Figure 7. Others Case Studies
    Figure 8. Connected Retail Report Years Considered
    Figure 9. Global Connected Retail Market Size (US$ Million), Year-over-Year: 2016-2027
    Figure 10. Global Connected Retail Market Size (US$ Million), 2016 VS 2021 VS 2027
    Figure 11. Global Connected Retail Market Share by Regions: 2020 VS 2027
    Figure 12. Global Connected Retail Market Share by Regions (2022-2027)
    Figure 13. Global Connected Retail Market Share by Players in 2020
    Figure 14. Global Top Connected Retail Players by Company Type (Tier 1, Tier 2 and Tier 3) (based on the Revenue in Connected Retail as of 2020
    Figure 15. The Top 10 and 5 Players Market Share by Connected Retail Revenue in 2020
    Figure 16. Global Connected Retail Revenue Market Share by Type (2016-2021)
    Figure 17. Global Connected Retail Revenue Market Share by Type (2022-2027)
    Figure 18. North America Connected Retail Market Size YoY Growth (2016-2027) & (US$ Million)
    Figure 19. North America Connected Retail Market Share by Type (2016-2027)
    Figure 20. North America Connected Retail Market Share by Application (2016-2027)
    Figure 21. North America Connected Retail Market Share by Country (2016-2027)
    Figure 22. United States Connected Retail Market Size YoY Growth (2016-2027) & (US$ Million)
    Figure 23. Canada Connected Retail Market Size YoY Growth (2016-2027) & (US$ Million)
    Figure 24. Europe Connected Retail Market Size YoY Growth (2016-2027) & (US$ Million)
    Figure 25. Europe Connected Retail Market Share by Type (2016-2027)
    Figure 26. Europe Connected Retail Market Share by Application (2016-2027)
    Figure 27. Europe Connected Retail Market Share by Country (2016-2027)
    Figure 28. Germany Connected Retail Market Size YoY Growth (2016-2027) & (US$ Million)
    Figure 29. France Connected Retail Market Size YoY Growth (2016-2027) & (US$ Million)
    Figure 30. U.K. Connected Retail Market Size YoY Growth (2016-2027) & (US$ Million)
    Figure 31. Italy Connected Retail Market Size YoY Growth (2016-2027) & (US$ Million)
    Figure 32. Russia Connected Retail Market Size YoY Growth (2016-2027) & (US$ Million)
    Figure 33. Nordic Connected Retail Market Size YoY Growth (2016-2027) & (US$ Million)
    Figure 34. Asia-Pacific Connected Retail Market Size YoY Growth (2016-2027) & (US$ Million)
    Figure 35. Asia-Pacific Connected Retail Market Share by Type (2016-2027)
    Figure 36. Asia-Pacific Connected Retail Market Share by Application (2016-2027)
    Figure 37. Asia-Pacific Connected Retail Market Share by Region (2016-2027)
    Figure 38. China Connected Retail Market Size YoY Growth (2016-2027) & (US$ Million)
    Figure 39. Japan Connected Retail Market Size YoY Growth (2016-2027) & (US$ Million)
    Figure 40. South Korea Connected Retail Market Size YoY Growth (2016-2027) & (US$ Million)
    Figure 41. Southeast Asia Connected Retail Market Size YoY Growth (2016-2027) & (US$ Million)
    Figure 42. India Connected Retail Market Size YoY Growth (2016-2027) & (US$ Million)
    Figure 43. Australia Connected Retail Market Size YoY Growth (2016-2027) & (US$ Million)
    Figure 44. Latin America Connected Retail Market Size YoY Growth (2016-2027) & (US$ Million)
    Figure 45. Latin America Connected Retail Market Share by Type (2016-2027)
    Figure 46. Latin America Connected Retail Market Share by Application (2016-2027)
    Figure 47. Latin America Connected Retail Market Share by Country (2016-2027)
    Figure 48. Mexico Connected Retail Market Size YoY Growth (2016-2027) & (US$ Million)
    Figure 49. Brazil Connected Retail Market Size YoY Growth (2016-2027) & (US$ Million)
    Figure 50. Middle East & Africa Connected Retail Market Size YoY Growth (2016-2027) & (US$ Million)
    Figure 51. Middle East & Africa Connected Retail Market Share by Type (2016-2027)
    Figure 52. Middle East & Africa Connected Retail Market Share by Application (2016-2027)
    Figure 53. Middle East & Africa Connected Retail Market Share by Country (2016-2027)
    Figure 54. Turkey Connected Retail Market Size YoY Growth (2016-2027) & (US$ Million)
    Figure 55. Saudi Arabia Connected Retail Market Size YoY Growth (2016-2027) & (US$ Million)
    Figure 56. UAE Connected Retail Market Size YoY Growth (2016-2027) & (US$ Million)
    Figure 57. Zebra Technologies Revenue Growth Rate in Connected Retail Business (2016-2021)
    Figure 58. Softweb Solutions Revenue Growth Rate in Connected Retail Business (2016-2021)
    Figure 59. SAP Revenue Growth Rate in Connected Retail Business (2016-2021)
    Figure 60. PTC Revenue Growth Rate in Connected Retail Business (2016-2021)
    Figure 61. Microsoft Revenue Growth Rate in Connected Retail Business (2016-2021)
    Figure 62. Intel Revenue Growth Rate in Connected Retail Business (2016-2021)
    Figure 63. IBM Revenue Growth Rate in Connected Retail Business (2016-2021)
    Figure 64. Cisco Systems Revenue Growth Rate in Connected Retail Business (2016-2021)
    Figure 65. Atmel Revenue Growth Rate in Connected Retail Business (2016-2021)
    Figure 66. ARM Revenue Growth Rate in Connected Retail Business (2016-2021)
    Figure 67. Bottom-up and Top-down Approaches for This Report
    Figure 68. Data Triangulation
    Figure 69. Key Executives Interviewed
SELECT A FORMAT
Added to Cart
Electronic (PDF)

$3900

This license allows only one user to access the PDF.
Electronic (PDF)

$5850

This license allows 1 - 5 user to access the PDF, license is suitable for small groups of 5 users working together
Electronic (PDF)

$7800

This license allows users/teams in a same Enterprise to use this report, various departments within an enterpise can use this report
Add to Cart
Buy Now (15% Discount)

OUR CUSTOMER

Novocure