
The global 5G infrastructure market size was valued at USD 371.4 Million in 2017 and is projected to reach USD 58,174.6 Million by 2025, growing at a CAGR of 95.8% from 2018 to 2025. The demand for 5G Infrastructure within the global market has risen as a result of advances in telecommunications. 5G was launched commercially in early 2019 and is currently used in three key types of connected services, including IoT, mobile broadband, and critical communications. 5G will boost and advance our mobile experience with reduced latency, low cost-per-bit, and consistent and higher data speeds. Real-time gaming, AR, VR, and MR will have a huge impact due to 5G.
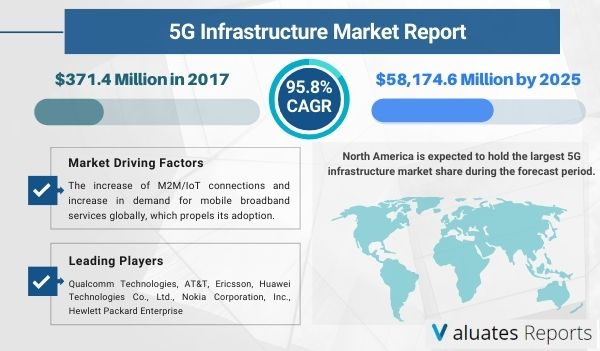
The 5G infrastructure market is expected to witness considerable growth due to the increase of M2M/IoT connections and increase in demand for mobile broadband services globally, which propels its adoption. The 5G infrastructure market is projected to witness significant growth, especially in the emerging economies due to the rise in stringent government regulations regarding 5G deployment and building of smart cities in emerging economies, such as Asia-Pacific and LAMEA
The major factors driving the growth of the 5G infrastructure market size are lower latency, increasing adoption of virtual telecommunications networking architecture, and growth in mobile data traffic. Increasing M2M connections across different industries are also expected to drive the growth of the 5G Infrastructure over the forecast period.
5G will boost and advance our mobile experience with reduced latency, low cost-per-bit, and consistent and higher data speeds. Real-time gaming augmented reality and Virtual reality and mixed reality will have a huge impact due to 5G.
However, high investment and technological & infrastructure challenges in the implementation of the 5G network and privacy & security concerns impede the 5G infrastructure market growth. Furthermore, the rise in government initiatives for building smart cities in Asia-Pacific is expected to provide a lucrative 5G Infrastructure market opportunity.
Numerous factors make the 5G era in the U.S. distinctive. For instance, the government institutions of the U.S. are continuously making efforts for the progress of 5G with new spectrum allocations and working on the infrastructural deployment. In addition, the U.S. is one of the leading countries in terms of consumer digital engagement and speed of adoption of new technologies. As 4G is still in the current scenario and has been driving the transition from connected to digital consumers, 5G is expected to play a vital role in the transition to the augmented consumer in the long run.
North America is expected to hold the largest 5G infrastructure market share during the forecast period. The growth witnessed in the region is likely to be guided by the involvement of large and influential players and the US government's spending on providing 5G Infrastructure in various government and private organizations.
The Asia Pacific is expected to witness the highest growth during the forecast period. This growth can be attributed to rising investments in both government and private industry.
AT&T Ericsson Huawei Technologies Co.Ltd., Hewlett Packard Enterprise (HPE), Intel Corporation, Mediatek Inc, Nokia Corporation, Qualcomm Technologies, Inc., Samsung Electronics Co. Ltd., Verizon. The player engages in collaborations, partnership, and product enhancement strategies to strengthen their 5G infrastructure market share.
|
Report Metric |
Details |
|
Report Name |
5G Infrastructure Market |
|
The market size in 2017 |
$371.4 Million |
|
The revenue forecast in 2025 |
$58,174.6 Million |
|
Growth Rate |
CAGR of 95.8% from 2018 to 2025 |
|
Base year considered |
2017 |
|
Forecast period |
2018-2025 |
|
Forecast units |
Value (USD) |
|
Segments covered |
By Communication Infrastructure, By Network Technology, By Chipset Type, Application, Key Players, Regions |
|
By Communication Infrastructure |
Small Cell, Macro Cell, Radio Access Network (RAN), Distributed Antenna System (DAS) |
|
By Network Technology |
Software-Defined Networking (SDN) and Network Function Virtualization (NFV), Mobile Edge Computing (MEC), Fog Computing (FC) |
|
By Chipset Type |
Application-Specific Integrated Circuit (ASIC), Radio Frequency Integrated Circuit (RFIC), Millimeter Wave Technology Chips, Field-Programmable Gate Array (FPGA) |
|
By Application |
Automotive, Energy & Utilities, Healthcare, Retail, Others |
|
Report coverage |
Revenue & volume forecast, company share, competitive landscape, restraints, growth factors, and trends |
|
Geographic regions covered |
North America, Europe, Asia Pacific, Latin America, Middle East & Africa |
Ans. The global 5G infrastructure market size was valued at USD 371.4 Million in 2017 and is projected to reach USD 58,174.6 Million by 2025, growing at a CAGR of 95.8% from 2018 to 2025.
Ans. The top companies profiled in the 5G infrastructure market report include Qualcomm Technologies, AT&T, Ericsson, Huawei Technologies Co., Ltd., Nokia Corporation, Inc., Hewlett Packard Enterprise (HPE), Mediatek Inc., Intel Corporation, Samsung Electronics Co. Ltd., and Verizon.
Ans. Asia-Pacific region expected to provide lucrative growth opportunity for 5G infrastructure market.
Ans. The 5G infrastructure market is segmented on the basis of communication infrastructure, network technology, chipset type, application, and region.
Ans. The forecast period for the 5G Infrastructure Market is 2021 to 2027
Ans. Factors such as the increase in adoption of M2M/IoT connections among different industries and the increase in demand for mobile broadband services globally majorly assist in the growth of the 5G infrastructure market globally.
CHAPTER 1: INTRODUCTION
1.1. REPORT DESCRIPTION
1.2. KEY BENEFITS FOR STAKEHOLDERS
1.3. KEY MARKET SEGMENTS
1.4. RESEARCH METHODOLOGY
1.4.1. Primary research
1.4.2. Secondary researcha
1.4.3. Analyst tools and models
CHAPTER 2: EXECUTIVE SUMMARY
2.1. CXO PERSPECTIVE
CHAPTER 3: MARKET OVERVIEW
3.1. MARKET DEFINITION AND SCOPE
3.2. KEY FINDINGS
3.2.1. Top impacting factors
3.2.2. Top investment pockets
3.2.3. Top winning strategies
3.3. PORTERS FIVE FORCES ANALYSIS
3.4. MARKET SHARE ANALYSIS (2017)
3.5. MARKET DYNAMICS
3.5.1. Drivers
3.5.1.1. Proliferation of M2M/IoT connections
3.5.1.2. Increase in demand for mobile broadband services
3.5.2. Restraint
3.5.2.1. High investment and technological & infrastructure challenges in the implementation of 5G network
3.5.2.2. Privacy & security concerns
3.5.3. Opportunities
3.5.3.1. Rise in government initiatives for building smart cities in Asia-Pacific
CHAPTER 4: 5G INFRASTRUCTURE MARKET, BY COMMUNICATION INFRASTRUCTURE
4.1. OVERVIEW
4.2. SMALL CELL
4.2.1. Key market trends, growth factors, and opportunities
4.2.2. Market size and forecast, by region
4.2.3. Market analysis by country
4.3. MACRO CELL
4.3.1. Key market trends, growth factors, and opportunities
4.3.2. Market size and forecast, by region
4.3.3. Market analysis by country
4.4. RADIO ACCESS NETWORK (RAN)
4.4.1. Key market trends, growth factors, and opportunities
4.4.2. Market size and forecast, by region
4.4.3. Market analysis by country
4.5. DISTRIBUTED ANTENNA SYSTEM (DAS)
4.5.1. Key market trends, growth factors, and opportunities
4.5.2. Market size and forecast, by region
4.5.3. Market analysis by country
CHAPTER 5: 5G INFRASTRUCTURE MARKET, BY NETWORK TECHNOLOGY
5.1. OVERVIEW
5.2. SOFTWARE DEFINED NETWORKING & NETWORK FUNCTION VIRTUALIZATION
5.2.1. Key market trends, growth factors, and opportunities
5.2.2. Market size and forecast, by region
5.2.3. Market analysis by country
5.3. MOBILE EDGE COMPUTING
5.3.1. Key market trends, growth factors, and opportunities
5.3.2. Market size and forecast, by region
5.3.3. Market analysis by country
5.4. FOG COMPUTING
5.4.1. Key market trends, growth factors, and opportunities
5.4.2. Market size and forecast, by region
5.4.3. Market analysis by country
CHAPTER 6: 5G INFRASTRUCTURE MARKET, BY CHIPSET TYPE
6.1. OVERVIEW
6.2. APPLICATION-SPECIFIC INTEGRATED CIRCUIT
6.2.1. Key market trends, growth factors, and opportunities
6.2.2. Market size and forecast, by region
6.2.3. Market analysis by country
6.3. RFIC
6.3.1. Key market trends, growth factors, and opportunities
6.3.2. Market size and forecast, by region
6.3.3. Market analysis by country
6.4. MMWAVE TECHNOLOGY CHIPS
6.4.1. Key market trends, growth factors, and opportunities
6.4.2. Market size and forecast, by region
6.4.3. Market analysis by country
6.5. FPGA
6.5.1. Key market trends, growth factors, and opportunities
6.5.2. Market size and forecast, by region
6.5.3. Market analysis by country
CHAPTER 7: 5G INFRASTRUCTURE MARKET, BY APPLICATION
7.1. OVERVIEW
7.2. AUTOMOTIVE
7.2.1. Key market trends, growth factors, and opportunities
7.2.2. Market size and forecast, by region
7.2.3. Market analysis, by country
7.3. ENERGY & UTILITIES
7.3.1. Key market trends, growth factors, and opportunities
7.3.2. Market size and forecast, by region
7.3.3. Market analysis by country
7.4. HEALTHCARE
7.4.1. Key market trends, growth factors, and opportunities
7.4.2. Market size and forecast, by region
7.4.3. Market analysis, by country
7.5. RETAIL
7.5.1. Key market trends, growth factors, and opportunities
7.5.2. Market size and forecast, by region
7.5.3. Market analysis by country
7.6. OTHERS
7.6.1. Key market trends, growth factors, and opportunities
7.6.2. Market size and forecast, by region
7.6.3. Market analysis, by country
CHAPTER 8: 5G INFRASTRUCTURE MARKET, BY REGION
8.1. OVERVIEW
8.2. NORTH AMERICA
8.2.1. Key market trends, growth factors, and opportunities
8.2.2. Market size and forecast, by communication infrastructure
8.2.3. Market size and forecast, by network technology
8.2.4. Market size and forecast, by chipset type
8.2.5. Market size and forecast, by applications
8.2.6. Market analysis, by country
8.2.6.1. U.S.
8.2.6.1.1. Market size and forecast, by communication infrastructure
8.2.6.1.2. Market size and forecast, by network technology
8.2.6.1.3. Market size and forecast, by chipset type
8.2.6.1.4. Market size and forecast, by applications
8.2.6.2. Canada
8.2.6.2.1. Market size and forecast, by communication infrastructure
8.2.6.2.2. Market size and forecast, by network technology
8.2.6.2.3. Market size and forecast, by chipset type
8.2.6.2.4. Market size and forecast, by applications
8.2.6.3. Mexico
8.2.6.3.1. Market size and forecast, by communication infrastructure
8.2.6.3.2. Market size and forecast, by network technology
8.2.6.3.3. Market size and forecast, by chipset type
8.2.6.3.4. Market size and forecast, by applications
8.3. EUROPE
8.3.1. Key market trends, growth factors, and opportunities
8.3.2. Market size and forecast, by communication infrastructure
8.3.3. Market size and forecast, by network technology
8.3.4. Market size and forecast, by chipset type
8.3.5. Market size and forecast, by application
8.3.6. Market analysis by country
8.3.6.1. U.K.
8.3.6.1.1. Market size and forecast, by Communication Infrastructure
8.3.6.1.2. Market size and forecast, by network technology
8.3.6.1.3. Market size and forecast, by chipset type
8.3.6.1.4. Market size and forecast, by applications
8.3.6.2. Germany
8.3.6.2.1. Market size and forecast, by Communication Infrastructure
8.3.6.2.2. Market size and forecast, by network technology
8.3.6.2.3. Market size and forecast, by chipset type
8.3.6.2.4. Market size and forecast, by applications
8.3.6.3. France
8.3.6.3.1. Market size and forecast, by COMMUNICATION INFRASTRUCTURE
8.3.6.3.2. Market size and forecast, by network technology
8.3.6.3.3. Market size and forecast, by chipset type
8.3.6.3.4. Market size and forecast, by applications
8.3.6.4. Russia
8.3.6.4.1. Market size and forecast, by Communication Infrastructure
8.3.6.4.2. Market size and forecast, by network technology
8.3.6.4.3. Market size and forecast, by chipset type
8.3.6.4.4. Market size and forecast, by applications
8.3.6.5. Rest of Europe
8.3.6.5.1. Market size and forecast, by COMMUNICATION INFRASTRUCTURE
8.3.6.5.2. Market size and forecast, by network technology
8.3.6.5.3. Market size and forecast, by chipset type
8.3.6.5.4. Market size and forecast, by applications
8.4. ASIA-PACIFIC
8.4.1. Key market trends, growth factors, and opportunities
8.4.2. Market size and forecast, by communication infrastructure
8.4.3. Market size and forecast, by network technology
8.4.4. Market size and forecast, by chipset type
8.4.5. Market size and forecast, by application
8.4.6. Market analysis by country
8.4.6.1. China
8.4.6.1.1. Market size and forecast, by COMMUNICATION INFRASTRUCTURE
8.4.6.1.2. Market size and forecast, by network technology
8.4.6.1.3. Market size and forecast, by chipset type
8.4.6.1.4. Market size and forecast, by applications
8.4.6.2. Japan
8.4.6.2.1. Market size and forecast, by COMMUNICATION INFRASTRUCTURE
8.4.6.2.2. Market size and forecast, by network technology
8.4.6.2.3. Market size and forecast, by chipset type
8.4.6.2.4. Market size and forecast, by applications
8.4.6.3. India
8.4.6.3.1. Market size and forecast, by COMMUNICATION INFRASTRUCTURE
8.4.6.3.2. Market size and forecast, by network technology
8.4.6.3.3. Market size and forecast, by chipset type
8.4.6.3.4. Market size and forecast, by applications
8.4.6.4. South Korea
8.4.6.4.1. Market size and forecast, by COMMUNICATION INFRASTRUCTURE
8.4.6.4.2. Market size and forecast, by network technology
8.4.6.4.3. Market size and forecast, by chipset type
8.4.6.4.4. Market size and forecast, by applications
8.4.6.5. Rest of Asia-Pacific
8.4.6.5.1. Market size and forecast, by COMMUNICATION INFRASTRUCTURE
8.4.6.5.2. Market size and forecast, by network technology
8.4.6.5.3. Market size and forecast, by chipset type
8.4.6.5.4. Market size and forecast, by applications
8.5. LAMEA
8.5.1. Key market trends, growth factors, and opportunities
8.5.2. Market size and forecast, by communication infrastructure
8.5.3. Market size and forecast, by network technology
8.5.4. Market size and forecast, by chipset type
8.5.5. Market size and forecast, by application
8.5.6. Market analysis by country
8.5.6.1. Latin America
8.5.6.1.1. Market size and forecast, by communication infrastructure
8.5.6.1.2. Market size and forecast, by network technology
8.5.6.1.3. Market size and forecast, by chipset type
8.5.6.1.4. Market size and forecast, by applications
8.5.6.2. Middle East
8.5.6.2.1. Market size and forecast, by COMMUNICATION INFRASTRUCTURE
8.5.6.2.2. Market size and forecast, by network technology
8.5.6.2.3. Market size and forecast, by chipset type
8.5.6.2.4. Market size and forecast, by applications
8.5.6.3. Africa
8.5.6.3.1. Market size and forecast, by COMMUNICATION INFRASTRUCTURE
8.5.6.3.2. Market size and forecast, by network technology
8.5.6.3.3. Market size and forecast, by chipset type
8.5.6.3.4. Market size and forecast, by applications
CHAPTER 9: COMPANY PROFILE
9.1. AETHON (ST ENGINEERING LTD)
9.1.1. Company overview
9.1.2. Company snapshot
9.1.3. Operating business segments
9.1.4. Product portfolio
9.1.5. Business performance
9.1.6. Key strategic moves and developments
9.2. ASIC ROBOTICS AG
9.2.1. Company overview
9.2.2. Company snapshot
9.2.3. Product portfolio
9.3. AMAZON ROBOTICS
9.3.1. Company overview
9.3.2. Company snapshot
9.3.3. Product portfolio
9.4. CLEARPATH ROBOTICS INC.
9.4.1. Company overview
9.4.2. Company snapshot
9.4.3. Product portfolio
9.4.4. Key strategic moves and developments
9.5. FETCH ROBOTICS, INC.
9.5.1. Company overview
9.5.2. Company snapshot
9.5.3. Product portfolio
9.5.4. Key strategic moves and developments
9.6. GREYORANGE
9.6.1. Company overview
9.6.2. Company snapshot
9.6.3. Product portfolio
9.6.4. Key strategic moves and developments
9.7. KUKA AG
9.7.1. Company overview
9.7.2. Company snapshot
9.7.3. Operating business segments
9.7.4. Product portfolio
9.7.5. Business performance
9.7.6. Key strategic moves and developments
9.8. MOBILE INDUSTRIAL ROBOTS APS (TERADYNE, INC.)
9.8.1. Company overview
9.8.2. Company snapshot
9.8.3. Operating business segments
9.8.4. Product portfolio
9.8.5. Business performance
9.8.6. Key strategic moves and developments
9.9. OMRON ADEPT TECHNOLOGIES, INC. (OMRON CORPORATION)
9.9.1. Company overview
9.9.2. Company snapshot
9.9.3. Operating business segments
9.9.4. Product portfolio
9.9.5. Business performance
9.9.6. Key strategic moves and developments
9.10. SAVIOKE
9.10.1. Company overview
9.10.2. Company snapshot
9.10.3. Product portfolio
9.10.4. Key strategic moves and developments
TABLE 01. GLOBAL 5G INFRASTRUCTURE MARKET, BY COMMUNICATION INFRASTRUCTURE, 2017-2025($MILLION)
TABLE 02. GLOBAL 5G INFRASTRUCTURE MARKET, BY COMMUNICATION INFRASTRUCTURE, 2017-2025(THOUSAND UNITS)
TABLE 03. GLOBAL 5G INFRASTRUCTURE MARKET REVENUE FOR SMALL CELL, BY REGION 2017-2025 ($MILLION)
TABLE 04. GLOBAL 5G INFRASTRUCTURE MARKET REVENUE FOR MACRO CELL, BY REGION 2017-2025 ($MILLION)
TABLE 05. GLOBAL 5G INFRASTRUCTURE MARKETREVENUE FOR RADIO ACCESS NETWORK , BY REGION 20172025 ($MILLION)
TABLE 06. GLOBAL 5G INFRASTRUCTURE MARKET REVENUE FOR DISTRIBUTED ANTENNA SYSTEM, BY REGION 20172025 ($MILLION)
TABLE 07. GLOBAL 5G INFRASTRUCTURE MARKET, BY CHIPSET TYPE, 2017-2025($MILLION)
TABLE 08. GLOBAL 5G INFRASTRUCTURE MARKET, BY CHIPSET TYPE, 2017-2025(THOUSAND UNITS)
TABLE 09. GLOBAL 5G INFRASTRUCTURE MARKET REVENUE FOR SOFTWARE DEFINED NETWORKING & NETWORK FUNCTION VIRTUALIZATION, BY REGION 2017-2025 ($MILLION)
TABLE 10. GLOBAL 5G INFRASTRUCTURE MARKETREVENUE FOR MOBILE EDGE COMPUTING, BY REGION 2017-2025 ($MILLION)
TABLE 11. GLOBAL 5G INFRASTRUCTURE MARKET REVENUE FOR FOG COMPUTING, BY REGION 20172025 ($MILLION)
TABLE 12. GLOBAL 5G INFRASTRUCTURE MARKET, BY CHIPSET TYPE, 2017-2025($MILLION)
TABLE 13. GLOBAL 5G INFRASTRUCTURE MARKET, BY CHIPSET TYPE, 2017-2025(THOUSAND UNITS)
TABLE 14. GLOBAL 5G INFRASTRUCTURE MARKET REVENUE FOR ASIC, BY REGION 2017-2025 ($MILLION)
TABLE 15. GLOBAL 5G INFRASTRUCTURE MARKETREVENUE FOR RFIC, BY REGION 2017-2025 ($MILLION)
TABLE 16. GLOBAL 5G INFRASTRUCTURE MARKET REVENUE FOR MMWAVE TECHNOLOGY CHIPS, BY REGION 20172025 ($MILLION)
TABLE 17. GLOBAL 5G INFRASTRUCTURE MARKET REVENUE FOR FPGA, BY REGION 20172025 ($MILLION)
TABLE 18. GLOBAL 5G INFRASTRUCTURE MARKET, BY APPLICATION, 2017-2025($MILLION)
TABLE 19. GLOBAL 5G INFRASTRUCTURE MARKET, BY APPLICATION, 2017-2025(THOUSAND UNITS)
TABLE 20. GLOBAL 5G INFRASTRUCTURE MARKET REVENUE FOR AUTOMOTIVE, BY REGION 2017-2025 ($MILLION)
TABLE 21. GLOBAL 5G INFRASTRUCTURE MARKET REVENUE FOR ENERGY & UTILITIES, BY REGION 2017-2025 ($MILLION)
TABLE 22. GLOBAL 5G INFRASTRUCTURE MARKET REVENUE FOR HEALTHCARE, BY REGION 20172025 ($MILLION)
TABLE 23. GLOBAL 5G INFRASTRUCTURE MARKET REVENUE FOR RETAIL, BY REGION 20172025 ($MILLION)
TABLE 24. GLOBAL 5G INFRASTRUCTURE MARKET REVENUE FOR OTHERS, BY REGION 20172025 ($MILLION)
TABLE 01. GLOBAL 5G INFRASTRUCTURE MARKET REVENUE , BY REGION 20172025 ($MILLION)
TABLE 02. NORTH AMERICAN 5G INFRASTRUCTURE MARKET, BY COMMUNICATION INFRASTRUCTURE, 20172025 ($MILLION)
TABLE 03. NORTH AMERICAN 5G INFRASTRUCTURE MARKET, BY COMMUNICATION INFRASTRUCTURE, 20172025 (THOUSAND UNITS)
TABLE 04. NORTH AMERICAN 5G INFRASTRUCTURE MARKET, BY NETWORK TECHNOLOGY, 20172025 ($MILLION)
TABLE 05. NORTH AMERICAN 5G INFRASTRUCTURE MARKET, BY NETWORK TECHNOLOGY, 20172025 (THOUSAND UNITS)
TABLE 06. NORTH AMERICAN 5G INFRASTRUCTURE MARKET, BY CHIPSET TYPE, 20172025 ($MILLION)
TABLE 07. NORTH AMERICAN 5G INFRASTRUCTURE MARKET, BY CHIPSET TYPE, 20172025 (THOUSAND UNITS)
TABLE 08. NORTH AMERICAN 5G INFRASTRUCTURE MARKET, BY APPLICATIONS, 20172025 ($MILLION)
TABLE 09. NORTH AMERICAN 5G INFRASTRUCTURE MARKET, BY APPLICATION, 20172025 (THOUSAND UNITS)
TABLE 10. NORTH AMERICAN 5G INFRASTRUCTURE MARKET, BY COUNTRY, 20172025 ($MILLION)
TABLE 11. U. S. 5G INFRASTRUCTURE MARKET, BY COMMUNICATION INFRASTRUCTURE, 20172025 ($MILLION)
TABLE 12. U. S. 5G INFRASTRUCTURE MARKET, BY COMMUNICATION INFRASTRUCTURE, 20172025 (THOUSAND UNITS)
TABLE 13. U. S. 5G INFRASTRUCTURE MARKET, BY NETWORK TECHNOLOGY, 20172025 ($MILLION)
TABLE 14. U. S. 5G INFRASTRUCTURE MARKET, BY NETWORK TECHNOLOGY, 20172025 (THOUSAND UNITS)
TABLE 15. U.S. 5G INFRASTRUCTURE MARKET, BY CHIPSET TYPE, 20172025 ($MILLION)
TABLE 16. U.S. 5G INFRASTRUCTURE MARKET, BY CHIPSET TYPE, 20172025 (THOUSAND UNITS)
TABLE 17. U.S. 5G INFRASTRUCTURE MARKET, BY APPLICATIONS, 20172025 ($MILLION)
TABLE 18. U.S. 5G INFRASTRUCTURE MARKET, BY APPLICATION, 20172025 (THOUSAND UNITS)
TABLE 19. CANADA 5G INFRASTRUCTURE MARKET, BY COMMUNICATION INFRASTRUCTURE, 20172025 ($MILLION)
TABLE 20. CANADA 5G INFRASTRUCTURE MARKET, BY COMMUNICATION INFRASTRUCTURE, 20172025 (THOUSAND UNITS)
TABLE 21. CANADA 5G INFRASTRUCTURE MARKET, BY NETWORK TECHNOLOGY, 20172025 ($MILLION)
TABLE 22. CANADA 5G INFRASTRUCTURE MARKET, BY NETWORK TECHNOLOGY, 20172025 (THOUSAND UNITS)
TABLE 23. CANADA 5G INFRASTRUCTURE MARKET, BY CHIPSET TYPE, 20172025 ($MILLION)
TABLE 24. CANADA 5G INFRASTRUCTURE MARKET, BY CHIPSET TYPE, 20172025 (THOUSAND UNITS)
TABLE 25. CANADA 5G INFRASTRUCTURE MARKET, BY APPLICATIONS, 20172025 ($MILLION)
TABLE 26. CANADA 5G INFRASTRUCTURE MARKET, BY APPLICATION, 20172025 (THOUSAND UNITS)
TABLE 27. MEXICO 5G INFRASTRUCTURE MARKET, BY COMMUNICATION INFRASTRUCTURE, 20172025 ($MILLION)
TABLE 28. MEXICO 5G INFRASTRUCTURE MARKET, BY COMMUNICATION INFRASTRUCTURE, 20172025 (THOUSAND UNITS)
TABLE 29. MEXICO 5G INFRASTRUCTURE MARKET, BY NETWORK TECHNOLOGY, 20172025 ($MILLION)
TABLE 30. MEXICO 5G INFRASTRUCTURE MARKET, BY NETWORK TECHNOLOGY, 20172025 (THOUSAND UNITS)
TABLE 31. MEXICO 5G INFRASTRUCTURE MARKET, BY CHIPSET TYPE, 20172025 ($MILLION)
TABLE 32. MEXICO 5G INFRASTRUCTURE MARKET, BY CHIPSET TYPE, 20172025 (THOUSAND UNITS)
TABLE 33. MEXICO 5G INFRASTRUCTURE MARKET, BY APPLICATIONS, 20172025 ($MILLION)
TABLE 34. MEXICO 5G INFRASTRUCTURE MARKET, BY APPLICATION, 20172025 (THOUSAND UNITS)
TABLE 35. EUROPEAN 5G INFRASTRUCTURE MARKET, BY COMMUNICATION INFRASTRUCTURE, 20172025 ($MILLION)
TABLE 36. EUROPEAN 5G INFRASTRUCTURE MARKET, BY COMMUNICATION INFRASTRUCTURE, 20172025 (THOUSAND UNITS)
TABLE 37. EUROPEAN 5G INFRASTRUCTURE MARKET, BY NETWORK TECHNOLOGY, 20172025 ($MILLION)
TABLE 38. EUROPEAN 5G INFRASTRUCTURE MARKET, BY NETWORK TECHNOLOGY, 20172025 (THOUSAND UNITS)
TABLE 39. EUROPEAN 5G INFRASTRUCTURE MARKET, BY CHIPSET TYPE, 20172025 ($MILLION)
TABLE 40. EUROPEAN 5G INFRASTRUCTURE MARKET, BY CHIPSET TYPE, 20172025 (THOUSAND UNITS)
TABLE 41. EUROPEAN 5G INFRASTRUCTURE MARKET, BY APPLICATION, 20172025 ($MILLION)
TABLE 42. EUROPEAN 5G INFRASTRUCTURE MARKET, BY APPLICATION, 20172025 (THOUSAND UNITS)
TABLE 43. EUROPE 5G INFRASTRUCTURE MARKET, BY COUNTRY, 20172025 ($MILLION)
TABLE 44. U.K. 5G INFRASTRUCTURE MARKET, BY COMMUNICATION INFRASTRUCTURE, 20172025 ($MILLION)
TABLE 45. U.K. 5G INFRASTRUCTURE MARKET, BY COMMUNICATION INFRASTRUCTURE, 20172025 (THOUSAND UNITS)
TABLE 46. UK. 5G INFRASTRUCTURE MARKET, BY NETWORK TECHNOLOGY, 20172025 ($MILLION)
TABLE 47. UK 5G INFRASTRUCTURE MARKET, BY NETWORK TECHNOLOGY, 20172025 (THOUSAND UNITS)
TABLE 48. UK 5G INFRASTRUCTURE MARKET, BY CHIPSET TYPE, 20172025 ($MILLION)
TABLE 49. UK 5G INFRASTRUCTURE MARKET, BY CHIPSET TYPE, 20172025 (THOUSAND UNITS)
TABLE 50. NORTH AMERICAN 5G INFRASTRUCTURE MARKET, BY APPLICATIONS, 20172025 ($MILLION)
TABLE 51. NORTH AMERICAN 5G INFRASTRUCTURE MARKET, BY APPLICATION, 20172025 (THOUSAND UNITS)
TABLE 52. GERMANY 5G INFRASTRUCTURE MARKET, BY COMMUNICATION INFRASTRUCTURE, 20172025 ($MILLION)
TABLE 53. GERMANY 5G INFRASTRUCTURE MARKET, BY COMMUNICATION INFRASTRUCTURE, 20172025 (THOUSAND UNITS)
TABLE 54. GERMANY 5G INFRASTRUCTURE MARKET, BY NETWORK TECHNOLOGY, 20172025 ($MILLION)
TABLE 55. GERMANY 5G INFRASTRUCTURE MARKET, BY NETWORK TECHNOLOGY, 20172025 (THOUSAND UNITS)
TABLE 56. GERMANY 5G INFRASTRUCTURE MARKET, BY CHIPSET TYPE, 20172025 ($MILLION)
TABLE 57. GERMANY 5G INFRASTRUCTURE MARKET, BY CHIPSET TYPE, 20172025 (THOUSAND UNITS)
TABLE 58. GERMANY 5G INFRASTRUCTURE MARKET, BY APPLICATIONS, 20172025 ($MILLION)
TABLE 59. GERMANY 5G INFRASTRUCTURE MARKET, BY APPLICATION, 20172025 (THOUSAND UNITS)
TABLE 60. FRANCE 5G INFRASTRUCTURE MARKET, BY COMMUNICATION INFRASTRUCTURE, 20172025 ($MILLION)
TABLE 61. FRANCE 5G INFRASTRUCTURE MARKET, BY COMMUNICATION INFRASTRUCTURE, 20172025 (THOUSAND UNITS)
TABLE 62. FRANCE 5G INFRASTRUCTURE MARKET, BY NETWORK TECHNOLOGY, 20172025 ($MILLION)
TABLE 63. FRANCE 5G INFRASTRUCTURE MARKET, BY NETWORK TECHNOLOGY, 20172025 (THOUSAND UNITS)
TABLE 64. FRANCE 5G INFRASTRUCTURE MARKET, BY CHIPSET TYPE, 20172025 ($MILLION)
TABLE 65. FRANCE 5G INFRASTRUCTURE MARKET, BY CHIPSET TYPE, 20172025 (THOUSAND UNITS)
TABLE 66. FRANCE 5G INFRASTRUCTURE MARKET, BY APPLICATIONS, 20172025 ($MILLION)
TABLE 67. FRANCE 5G INFRASTRUCTURE MARKET, BY APPLICATION, 20172025 (THOUSAND UNITS)
TABLE 68. RUSSIA 5G INFRASTRUCTURE MARKET, BY COMMUNICATION INFRASTRUCTURE, 20172025 ($MILLION)
TABLE 69. RUSSIA 5G INFRASTRUCTURE MARKET, BY COMMUNICATION INFRASTRUCTURE, 20172025 ($THOUSAND UNITS)
TABLE 70. RUSSIA 5G INFRASTRUCTURE MARKET, BY NETWORK TECHNOLOGY, 20172025 ($MILLION)
TABLE 71. RUSSIA 5G INFRASTRUCTURE MARKET, BY NETWORK TECHNOLOGY, 20172025 (THOUSAND UNITS)
TABLE 72. RUSSIA 5G INFRASTRUCTURE MARKET, BY CHIPSET TYPE, 20172025 ($MILLION)
TABLE 73. RUSSIA 5G INFRASTRUCTURE MARKET, BY CHIPSET TYPE, 20172025 (THOUSAND UNITS)
TABLE 74. RUSSIA 5G INFRASTRUCTURE MARKET, BY APPLICATIONS, 20172025 ($MILLION)
TABLE 75. RUSSIA 5G INFRASTRUCTURE MARKET, BY APPLICATION, 20172025 (THOUSAND UNITS)
TABLE 76. REST OF EUROPE 5G INFRASTRUCTURE MARKET, BY COMMUNICATION INFRASTRUCTURE, 20172025 ($MILLION)
TABLE 77. REST OF EUROPE 5G INFRASTRUCTURE MARKET, BY COMMUNICATION INFRASTRUCTURE, 20172025 (THOUSAND UNITS)
TABLE 78. REST OF EUROPE 5G INFRASTRUCTURE MARKET, BY CHIPSET TYPE, 20172025 ($MILLION)
TABLE 79. REST OF EUROPE 5G INFRASTRUCTURE MARKET, BY CHIPSET TYPE, 20172025 (THOUSAND UNITS)
TABLE 80. REST OF EUROPE 5G INFRASTRUCTURE MARKET, BY CHIPSET TYPE, 20172025 ($MILLION)
TABLE 81. REST OF EUROPE 5G INFRASTRUCTURE MARKET, BY CHIPSET TYPE, 20172025 (THOUSAND UNITS)
TABLE 82. REST OF EUROPE 5G INFRASTRUCTURE MARKET, BY APPLICATIONS, 20172025 ($MILLION)
TABLE 83. REST OF EUROPE 5G INFRASTRUCTURE MARKET, BY APPLICATION, 20172025 (THOUSAND UNITS)
TABLE 84. ASIA-PACIFIC 5G INFRASTRUCTURE MARKET, BY COMMUNICATION INFRASTRUCTURE, 20172025 ($MILLION)
TABLE 85. ASIA-PACIFIC MOBILE LOGISTICS ROBOTS MARKET, BY COMMUNICATION INFRASTRUCTURE, 20172025 (THOUSAND UNITS)
TABLE 86. ASIA-PACIFIC MOBILE LOGISTICS ROBOTS MARKET, BY NETWORK TECHNOLOGY, 20172025 ($MILLION)
TABLE 87. ASIA-PACIFIC 5G INFRASTRUCTURE MARKET, BY NETWORK TECHNOLOGY, 20172025 (THOUSAND UNITS)
TABLE 88. ASIA-PACIFIC 5G INFRASTRUCTURE MARKET, BY CHIPSET TYPE, 20172025 ($MILLION)
TABLE 89. ASIA-PACIFIC 5G INFRASTRUCTURE MARKET, BY CHIPSET TYPE, 20172025 (THOUSAND UNITS)
TABLE 90. ASIA-PACIFIC 5G INFRASTRUCTURE MARKET, BY APPLICATION, 20172025 ($MILLION)
TABLE 91. ASIA-PACIFIC 5G INFRASTRUCTURE MARKET, BY APPLICATION, 20172025 (THOUSAND UNITS)
TABLE 92. ASIA PACIFIC 5G INFRASTRUCTURE MARKET, BY COUNTRY, 20172025 ($MILLION)
TABLE 93. CHINA 5G INFRASTRUCTURE MARKET, BY COMMUNICATION INFRASTRUCTURE, 20172025 ($MILLION)
TABLE 94. CHINA 5G INFRASTRUCTURE MARKET, BY COMMUNICATION INFRASTRUCTURE, 20172025 (THOUSAND UNITS)
TABLE 95. CHINA 5G INFRASTRUCTURE MARKET, BY NETWORK TECHNOLOGY, 20172025 ($MILLION)
TABLE 96. CHINA 5G INFRASTRUCTURE MARKET, BY NETWORK TECHNOLOGY, 20172025 (THOUSAND UNITS)
TABLE 97. CHINA 5G INFRASTRUCTURE MARKET, BY CHIPSET TYPE, 20172025 ($MILLION)
TABLE 98. CHINA 5G INFRASTRUCTURE MARKET, BY CHIPSET TYPE, 20172025 (THOUSAND UNITS)
TABLE 99. CHINA 5G INFRASTRUCTURE MARKET, BY APPLICATIONS, 20172025 ($MILLION)
TABLE 100. CHINA 5G INFRASTRUCTURE MARKET, BY APPLICATION, 20172025 (THOUSAND UNITS)
TABLE 101. JAPAN 5G INFRASTRUCTURE MARKET, BY COMMUNICATION INFRASTRUCTURE, 20172025 ($MILLION)
TABLE 102. INDIA 5G INFRASTRUCTURE MARKET, BY COMMUNICATION INFRASTRUCTURE, 20172025 (THOUSAND UNITS)
TABLE 103. JAPAN 5G INFRASTRUCTURE MARKET, BY NETWORK TECHNOLOGY, 20172025 ($MILLION)
TABLE 104. JAPAN 5G INFRASTRUCTURE MARKET, BY NETWORK TECHNOLOGY, 20172025 (THOUSAND UNITS)
TABLE 105. JAPAN 5G INFRASTRUCTURE MARKET, BY CHIPSET TYPE, 20172025 ($MILLION)
TABLE 106. JAPAN 5G INFRASTRUCTURE MARKET, BY CHIPSET TYPE, 20172025 (THOUSAND UNITS)
TABLE 107. JAPAN 5G INFRASTRUCTURE MARKET, BY APPLICATIONS, 20172025 ($MILLION)
TABLE 108. JAPAN 5G INFRASTRUCTURE MARKET, BY APPLICATION, 20172025 (THOUSAND UNITS)
TABLE 109. INDIA 5G INFRASTRUCTURE MARKET, BY COMMUNICATION INFRASTRUCTURE, 20172025 ($MILLION)
TABLE 110. INDIA 5G INFRASTRUCTURE MARKET, BY COMMUNICATION INFRASTRUCTURE, 20172025 (THOUSAND UNITS)
TABLE 111. INDIA 5G INFRASTRUCTURE MARKET, BY NETWORK TECHNOLOGY, 20172025 ($MILLION)
TABLE 112. INDIA 5G INFRASTRUCTURE MARKET, BY NETWORK TECHNOLOGY, 20172025 (THOUSAND UNITS)
TABLE 113. INDIA 5G INFRASTRUCTURE MARKET, BY CHIPSET TYPE, 20172025 ($MILLION)
TABLE 114. INDIA 5G INFRASTRUCTURE MARKET, BY CHIPSET TYPE, 20172025 (THOUSAND UNITS)
TABLE 115. INDIA 5G INFRASTRUCTURE MARKET, BY APPLICATIONS, 20172025 ($MILLION)
TABLE 116. INDIA 5G INFRASTRUCTURE MARKET, BY APPLICATION, 20172025 (THOUSAND UNITS)
TABLE 117. SOUTH KOREA 5G INFRASTRUCTURE MARKET, BY COMMUNICATION INFRASTRUCTURE, 20172025 ($MILLION)
TABLE 118. SOUTH KOREA 5G INFRASTRUCTURE MARKET, BY COMMUNICATION INFRASTRUCTURE, 20172025 (THOUSAND UNITS)
TABLE 119. SOUTH KOREA 5G INFRASTRUCTURE MARKET, BY NETWORK TECHNOLOGY, 20172025 ($MILLION)
TABLE 120. SOUTH KOREA 5G INFRASTRUCTURE MARKET, BY NETWORK TECHNOLOGY, 20172025 (THOUSAND UNITS)
TABLE 121. SOUTH KOREA 5G INFRASTRUCTURE MARKET, BY CHIPSET TYPE, 20172025 ($MILLION)
TABLE 122. SOUTH KOREA 5G INFRASTRUCTURE MARKET, BY CHIPSET TYPE, 20172025 (THOUSAND UNITS)
TABLE 123. SOUTH KOREA 5G INFRASTRUCTURE MARKET, BY APPLICATIONS, 20172025 ($MILLION)
TABLE 124. SOUTH KOREA 5G INFRASTRUCTURE MARKET, BY APPLICATION, 20172025 (THOUSAND UNITS)
TABLE 125. REST OF ASIA-PACIFIC 5G INFRASTRUCTURE MARKET, BY COMMUNICATION INFRASTRUCTURE, 20172025 ($MILLION)
TABLE 126. REST OF ASIA-PACIFIC 5G INFRASTRUCTURE MARKET, BY COMMUNICATION INFRASTRUCTURE, 20172025 (THOUSAND UNITS)
TABLE 127. REST OF ASIA-PACIFIC 5G INFRASTRUCTURE MARKET, BY NETWORK TECHNOLOGY, 20172025 ($MILLION)
TABLE 128. REST OF ASIA-PACIFIC 5G INFRASTRUCTURE MARKET, BY NETWORK TECHNOLOGY, 20172025 (THOUSAND UNITS)
TABLE 129. REST OF ASIA-PACIFIC 5G INFRASTRUCTURE MARKET, BY CHIPSET TYPE, 20172025 ($MILLION)
TABLE 130. REST OF ASIA-PACIFIC 5G INFRASTRUCTURE MARKET, BY CHIPSET TYPE, 20172025 (THOUSAND UNITS)
TABLE 131. REST OF ASIA-PACIFIC 5G INFRASTRUCTURE MARKET, BY APPLICATIONS, 20172025 ($MILLION)
TABLE 132. REST OF ASIA-PACIFIC 5G INFRASTRUCTURE MARKET, BY APPLICATION, 20172025 (THOUSAND UNITS)
TABLE 133. LAMEA 5G INFRASTRUCTURE MARKET, BY COMMUNICATION INFRASTRUCTURE, 20172025 ($MILLION)
TABLE 134. LAMEA 5G INFRASTRUCTURE MARKET, BY COMMUNICATION INFRASTRUCTURE, 20172025 (THOUSAND UNITS)
TABLE 135. LAMEA 5G INFRASTRUCTURE MARKET, BY NETWORK TECHNOLOGY, 20172025 ($MILLION)
TABLE 136. LAMEA 5G INFRASTRUCTURE MARKET, BY NETWORK TECHNOLOGY, 20172025 (THOUSAND)
TABLE 137. LAMEA 5G INFRASTRUCTURE MARKET, BY CHIPSET TYPE, 20172025 ($MILLION)
TABLE 138. LAMEA 5G INFRASTRUCTURE MARKET, BY CHIPSET TYPE, 20172025 (THOUSAND)
TABLE 139. LAMEA 5G INFRASTRUCTURE MARKET, BY APPLICATION, 20172025 ($MILLION)
TABLE 140. LAMEA 5G INFRASTRUCTURE MARKET, BY NETWORK TECHNOLOGY, 20172025 (THOUSAND)
TABLE 141. LAMEA 5G INFRASTRUCTURE MARKET, BY APPLICATION, 20172025 ($MILLION)
TABLE 142. LATIN AMERICA 5G INFRASTRUCTURE MARKET, BY COMMUNICATION INFRASTRUCTURE, 20172025 ($MILLION)
TABLE 143. LATIN AMERICA 5G INFRASTRUCTURE MARKET, BY COMMUNICATION INFRASTRUCTURE, 20172025 (THOUSAND UNITS)
TABLE 144. LATIN AMERICA 5G INFRASTRUCTURE MARKET, BY NETWORK TECHNOLOGY, 20172025 ($MILLION)
TABLE 145. LATIN AMERICA 5G INFRASTRUCTURE MARKET, BY NETWORK TECHNOLOGY, 20172025 (THOUSAND UNITS)
TABLE 146. LATIN AMERICA 5G INFRASTRUCTURE MARKET, BY CHIPSET TYPE, 20172025 ($MILLION)
TABLE 147. LATIN AMERICA 5G INFRASTRUCTURE MARKET, BY CHIPSET TYPE, 20172025 (THOUSAND UNITS)
TABLE 148. LATIN AMERICA 5G INFRASTRUCTURE MARKET, BY APPLICATIONS, 20172025 ($MILLION)
TABLE 149. LATIN AMERICA 5G INFRASTRUCTURE MARKET, BY APPLICATION, 20172025 (THOUSAND UNITS)
TABLE 150. MIDDLE EAST 5G INFRASTRUCTURE MARKET, BY COMMUNICATION INFRASTRUCTURE, 20172025 ($MILLION)
TABLE 151. MIDDLE EAST 5G INFRASTRUCTURE MARKET, BY COMMUNICATION INFRASTRUCTURE, 20172025 (THOUSAND UNITS)
TABLE 152. MIDDLE EAST 5G INFRASTRUCTURE MARKET, BY NETWORK TECHNOLOGY, 20172025 ($MILLION)
TABLE 153. MIDDLE EAST 5G INFRASTRUCTURE MARKET, BY NETWORK TECHNOLOGY, 20172025 (THOUSAND UNITS)
TABLE 154. MIDDLE EAST 5G INFRASTRUCTURE MARKET, BY CHIPSET TYPE, 20172025 ($MILLION)
TABLE 155. MIDDLE EAST 5G INFRASTRUCTURE MARKET, BY CHIPSET TYPE, 20172025 (THOUSAND UNITS)
TABLE 156. MIDDLE EAST 5G INFRASTRUCTURE MARKET, BY APPLICATIONS, 20172025 ($MILLION)
TABLE 157. MIDDLE EAST 5G INFRASTRUCTURE MARKET, BY APPLICATION, 20172025 (THOUSAND UNITS)
TABLE 158. AFRICA 5G INFRASTRUCTURE MARKET, BY COMMUNICATION INFRASTRUCTURE, 20172025 ($MILLION)
TABLE 159. AFRICA 5G INFRASTRUCTURE MARKET, BY COMMUNICATION INFRASTRUCTURE, 20172025 (THOUSAND UNITS)
TABLE 160. AFRICA 5G INFRASTRUCTURE MARKET, BY NETWORK TECHNOLOGY, 20172025 ($MILLION)
TABLE 161. AFRICA 5G INFRASTRUCTURE MARKET, BY NETWORK TECHNOLOGY, 20172025 (THOUSAND UNITS)
TABLE 162. AFRICA 5G INFRASTRUCTURE MARKET, BY CHIPSET TYPE, 20172025 ($MILLION)
TABLE 163. AFRICA 5G INFRASTRUCTURE MARKET, BY CHIPSET TYPE, 20172025 (THOUSAND UNITS)
TABLE 164. NORTH AMERICAN 5G INFRASTRUCTURE MARKET, BY APPLICATIONS, 20172025 ($MILLION)
TABLE 165. NORTH AMERICAN 5G INFRASTRUCTURE MARKET, BY APPLICATION, 20172025 (THOUSAND UNITS)
TABLE 166. AETHON: COMPANY SNAPSHOT
TABLE 167. AETHON (ST ENGINEERING LTD): OPERATING SEGMENTS
TABLE 168. AETHON: PRODUCT PORTFOLIO
TABLE 169. AETHON: KEY STRATEGIC MOVES AND DEVELOPMENTS
TABLE 170. ASIC ROBOTICS AG: COMPANY SNAPSHOT
TABLE 171. ASIC ROBOTICS AG: PRODUCT PORTFOLIO
TABLE 172. AMAZON ROBOTICS LLC: COMPANY SNAPSHOT
TABLE 173. AMAZON ROBOTICS LLC: PRODUCT PORTFOLIO
TABLE 174. CLEARPATH ROBOTICS INC.: COMPANY SNAPSHOT
TABLE 175. CLEARPATH ROBOTICS INC.: PRODUCT PORTFOLIO
TABLE 176. CLEARPATH ROBOTICS INC.: KEY STRATEGIC MOVES AND DEVELOPMENTS
TABLE 177. FETCH ROBOTICS, INC.: COMPANY SNAPSHOT
TABLE 178. FETCH ROBOTICS, INC.: PRODUCT PORTFOLIO
TABLE 179. FETCH ROBOTICS, INC.: KEY STRATEGIC MOVES AND DEVELOPMENTS
TABLE 180. GREYORANGE: COMPANY SNAPSHOT
TABLE 181. GREYORANGE: PRODUCT PORTFOLIO
TABLE 182. GREYORANGE: KEY STRATEGIC MOVES AND DEVELOPMENTS
TABLE 183. KUKA AG: COMPANY SNAPSHOT
TABLE 184. KUKA AG: OPERATING SEGMENTS
TABLE 185. KUKA AG: PRODUCT PORTFOLIO
TABLE 186. KUKA AG: KEY STRATEGIC MOVES AND DEVELOPMENTS
TABLE 187. MOBILE INDUSTRIAL ROBOTS APS: COMPANY SNAPSHOT
TABLE 188. MOBILE INDUSTRIAL ROBOTS APS (TERADYNE, INC.): OPERATING SEGMENTS
TABLE 189. MOBILE INDUSTRIAL ROBOTS APS: PRODUCT PORTFOLIO
TABLE 190. MOBILE INDUSTRIAL ROBOTS APS: KEY STRATEGIC MOVES AND DEVELOPMENTS
TABLE 191. OMRON ADEPT TECHNOLOGIES, INC.: COMPANY SNAPSHOT
TABLE 192. OMRON ADEPT TECHNOLOGIES, INC. (OMRON CORPORATION): OPERATING SEGMENTS
TABLE 193. OMRON ADEPT TECHNOLOGIES, INC.: PRODUCT PORTFOLIO
TABLE 194. OMRON ADEPT TECHNOLOGIES, INC.: KEY STRATEGIC MOVES AND DEVELOPMENTS
TABLE 195. SAVIOKE : COMPANY SNAPSHOT
TABLE 196. SAVIOKE : PRODUCT PORTFOLIO
TABLE 197. SAVIOKE : KEY STRATEGIC MOVES AND DEVELOPMENTS
LIST OF FIGURES
FIGURE 01. KEY MARKET SEGMENTS
FIGURE 02. EXECUTIVE SUMMARY
FIGURE 03. EXECUTIVE SUMMARY
FIGURE 04. EXECUTIVE SUMMARY
FIGURE 05. EXECUTIVE SUMMARY
FIGURE 06. EXECUTIVE SUMMARY
FIGURE 07. TOP IMPACTING FACTORS
FIGURE 08. TOP INVESTMENT POCKETS
FIGURE 09. TOP WINNING STRATEGIES, BY YEAR, 20162019*
FIGURE 10. TOP WINNING STRATEGIES, BY YEAR, 20162019*
FIGURE 11. TOP WINNING STRATEGIES, BY COMPANY, 20162019*
FIGURE 12. MODERATE-TO-HIGH BARGAINING POWER OF SUPPLIERS
FIGURE 13. MODERATE-TO-HIGH THREAT OF NEW ENTRANTS
FIGURE 14. MODERATE THREAT OF SUBSTITUTES
FIGURE 15. HIGH-TO-MODERATE INTENSITY OF RIVALRY
FIGURE 16. HIGH-TO-MODERATE BARGAINING POWER OF BUYERS
FIGURE 17. MARKET SHARE ANALYSIS (2017)
FIGURE 18. GLOBAL 5G INFRASTRUCTURE MARKET SHARE, BY COMMUNICATION INFRASTRUCTURE, 20172025 (%)
FIGURE 19. COMPARATIVE SHARE ANALYSIS OF GLOBAL 5G INFRASTRUCTURE MARKET FOR SMALL CELL, BY COUNTRY, 2017 & 2025 (%)
FIGURE 20. COMPARATIVE SHARE ANALYSIS OF GLOBAL 5G INFRASTRUCTURE MARKET FOR MACRO CELL, BY COUNTRY, 2017 & 2025 (%)
FIGURE 21. COMPARATIVE SHARE ANALYSIS OF GLOBAL 5G INFRASTRUCTURE MARKET FOR RADIO ACCESS NETWORK, BY COUNTRY, 2017 & 2025 (%)
FIGURE 22. COMPARATIVE SHARE ANALYSIS OF GLOBAL 5G INFRASTRUCTURE MARKET FOR DISTRIBUTED ANTENNA SYSTEM, BY COUNTRY, 2017 & 2025 (%)
FIGURE 23. GLOBAL 5G INFRASTRUCTURE MARKET SHARE, BY CHIPSET TYPE, 20172025 (%)
FIGURE 24. COMPARATIVE SHARE ANALYSIS OF GLOBAL 5G INFRASTRUCTURE MARKET FOR SOFTWARE DEFINED NETWORKING & NETWORK FUNCTION VIRTUALIZATION, BY COUNTRY, 2017 & 2025 (%)
FIGURE 25. COMPARATIVE SHARE ANALYSIS OF GLOBAL 5G INFRASTRUCTURE MARKET FOR MOBILE EDGE COMPUTING, BY COUNTRY, 2017 & 2025 (%)
FIGURE 26. COMPARATIVE SHARE ANALYSIS OF GLOBAL 5G INFRASTRUCTURE MARKET FOR FOG COMPUTING, BY COUNTRY, 2017 & 2025 (%)
FIGURE 27. GLOBAL 5G INFRASTRUCTURE MARKET SHARE, BY CHIPSET TYPE, 20172025 (%)
FIGURE 28. COMPARATIVE SHARE ANALYSIS OF GLOBAL 5G INFRASTRUCTURE MARKET FOR ASIC, BY COUNTRY, 2017 & 2025 (%)
FIGURE 29. COMPARATIVE SHARE ANALYSIS OF GLOBAL 5G INFRASTRUCTURE MARKET FOR RFIC, BY COUNTRY, 2017 & 2025 (%)
FIGURE 30. COMPARATIVE SHARE ANALYSIS OF GLOBAL 5G INFRASTRUCTURE MARKET FOR MMWAVE TECHNOLOGY CHIPS, BY COUNTRY, 2017 & 2025 (%)
FIGURE 31. COMPARATIVE SHARE ANALYSIS OF GLOBAL 5G INFRASTRUCTURE MARKET FOR FPGA, BY COUNTRY, 2017 & 2025 (%)
FIGURE 32. GLOBAL 5G INFRASTRUCTURE MARKET SHARE, BY APPLICATION, 20172025 (%)
FIGURE 33. COMPARATIVE SHARE ANALYSIS OF GLOBAL 5G INFRASTRUCTURE MARKET FOR AUTOMOTIVE, BY COUNTRY, 2017 & 2025 (%)
FIGURE 34. COMPARATIVE SHARE ANALYSIS OF GLOBAL 5G INFRASTRUCTURE MARKET FOR ENERGY & UTILITIES, BY COUNTRY, 2017 & 2025 (%)
FIGURE 35. COMPARATIVE SHARE ANALYSIS OF GLOBAL 5G INFRASTRUCTURE MARKET FOR HEALTHCARE, BY COUNTRY, 2017 & 2025 (%)
FIGURE 36. COMPARATIVE SHARE ANALYSIS OF GLOBAL 5G INFRASTRUCTURE MARKET FOR RETAIL, BY COUNTRY, 2017 & 2025 (%)
FIGURE 37. COMPARATIVE SHARE ANALYSIS OF GLOBAL 5G INFRASTRUCTURE MARKET FOR OTHERS, BY COUNTRY, 2017 & 2025 (%)
FIGURE 38. 5G INFRASTRUCTURE MARKET, BY REGION, 2017-2025 (%)
FIGURE 39. COMPARATIVE SHARE ANALYSIS OF 5G INFRASTRUCTURE MARKET, BY COUNTRY, 20172025 (%)
FIGURE 40. U. S. 5G INFRASTRUCTURE MARKET, 20172025 ($MILLION)
FIGURE 41. CANADA 5G INFRASTRUCTURE MARKET, 20172025 ($MILLION)
FIGURE 42. MEXICO 5G INFRASTRUCTURE MARKET, 20172025 ($MILLION)
FIGURE 43. COMPARATIVE SHARE ANALYSIS OF 5G INFRASTRUCTURE MARKET, BY COUNTRY, 20172025 (%)
FIGURE 44. U.K. 5G INFRASTRUCTURE MARKET, 20172025 ($MILLION)
FIGURE 45. GERMANY 5G INFRASTRUCTURE MARKET, 20172025 ($MILLION)
FIGURE 46. FRANCE 5G INFRASTRUCTURE MARKET, 20172025 ($MILLION)
FIGURE 47. RUSSIA 5G INFRASTRUCTURE MARKET, 20172025 ($MILLION)
FIGURE 48. REST OF EUROPE 5G INFRASTRUCTURE MARKET, 20172025 ($MILLION)
FIGURE 49. COMPARATIVE SHARE ANALYSIS OF 5G INFRASTRUCTURE MARKET, BY COUNTRY, 20172025 (%)
FIGURE 50. CHINA 5G INFRASTRUCTURE MARKET, 20172025 ($MILLION)
FIGURE 51. JAPAN 5G INFRASTRUCTURE MARKET, 20172025 ($MILLION)
FIGURE 52. INDIA 5G INFRASTRUCTURE MARKET, 20172025 ($MILLION)
FIGURE 53. SOUTH KOREA 5G INFRASTRUCTURE MARKET, 20172025 ($MILLION)
FIGURE 54. REST OF ASIA-PACIFIC 5G INFRASTRUCTURE MARKET, 20172025 ($MILLION)
FIGURE 55. COMPARATIVE SHARE ANALYSIS OF 5G INFRASTRUCTURE MARKET, BY COUNTRY, 20172025 (%)
FIGURE 56. LATIN AMERICA 5G INFRASTRUCTURE MARKET, 20172025 ($MILLION)
FIGURE 57. MIDDLE EAST 5G INFRASTRUCTURE MARKET, 20172025 ($MILLION)
FIGURE 58. AFRICA 5G INFRASTRUCTURE MARKET, 20172025 ($MILLION)
FIGURE 59. AETHON (ST ENGINEERING LTD): REVENUE, 20152017 ($MILLION)
FIGURE 60. AETHON (ST ENGINEERING LTD): REVENUE SHARE BY SEGMENT, 2017 (%)
FIGURE 61. AETHON (ST ENGINEERING LTD): REVENUE SHARE BY REGION, 2017 (%)
FIGURE 62. KUKA AG: REVENUE, 20152017 ($MILLION)
FIGURE 63. KUKA AG: REVENUE SHARE BY SEGMENT, 2017 (%)
FIGURE 64. KUKA AG: REVENUE SHARE BY REGION, 2017 (%)
FIGURE 65. MOBILE INDUSTRIAL ROBOTS APS (TERADYNE, INC.): REVENUE, 20152017 ($MILLION)
FIGURE 66. MOBILE INDUSTRIAL ROBOTS APS (TERADYNE, INC.): REVENUE SHARE BY SEGMENT, 2017 (%)
FIGURE 67. MOBILE INDUSTRIAL ROBOTS APS (TERADYNE, INC.): REVENUE SHARE BY REGION, 2017 (%)
FIGURE 68. OMRON ADEPT TECHNOLOGIES, INC. (OMRON CORPORATION): REVENUE, 20162018 ($MILLION)
FIGURE 69. OMRON ADEPT TECHNOLOGIES, INC. (OMRON CORPORATION): REVENUE SHARE BY SEGMENT, 2018 (%)
FIGURE 70. OMRON ADEPT TECHNOLOGIES, INC. (OMRON CORPORATION): REVENUE SHARE BY REGION, 2018 (%)
$5370
$6450
$8995
