
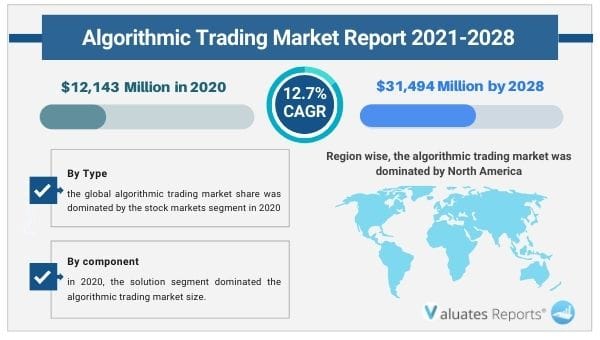
The global algorithmic trading market size was valued at USD 12143 Million in 2020 and is projected to reach USD 31494 Million by 2028 registering a Compound Annual Growth Rate (CAGR) of 12.7% from 2021 to 2028. Some of the key growth drivers for the algorithmic trading market include decreased transaction costs, increased government restrictions, rising demand for market monitoring, and rising demand for quick, dependable, and efficient order execution.
Because they frequently only last for a very brief period of time—often just a few seconds—it takes too much time for traders to execute their own arbitrage computations. As a result, traders use Algorithmic Trading, which can find and evaluate arbitrage opportunities very quickly.
The market for algorithmic trading is anticipated to expand as a result of the rise in demand for trustworthy, efficient, and quick order execution. Large brokerage firms and institutional investors are increasingly utilising algorithmic trading to save trading expenses. This can be explained by the fact that algorithmic trading facilitates faster and easier order execution, which draws exchanges. Additionally, it enables investors and traders to instantly realise profits from little price changes. Algorithmic trading is fueled by the growth in demand for efficient trade since it enables users to quickly execute agreements.
In order to take advantage of the data coming through digitally driven channels, the majority of financial services companies are utilising more AI and machine learning. It is widely used by companies in sectors like banking, insurance, and asset management. This has resulted in the trend of data-driven investing during the last ten years. High-frequency trading or algorithmic trading consequently became more popular. These AI-powered trading platforms analyse massive amounts of data far faster than humans could. As a result, during the projection period, the use of AI and algorithms in financial services presents a growth opportunity for the algorithmic trading sector.
The fact that more trading is being done as a result of greater disposable income is another important factor in the growth of the algorithmic trading business.
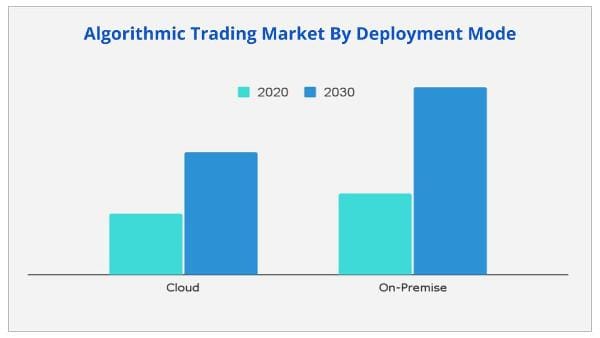
The cloud category is anticipated to be the most profitable based on deployment. This is a result of the growing use of cloud-based solutions by financial institutions to increase productivity and efficiency. Additionally, traders are increasingly using cloud-based algorithmic trading solutions because they ensure effective process automation, data preservation, and cost-effective management.
The solution segment is anticipated to be the most profitable, measured in terms of components. The demand for algorithmic trading solutions is primarily driven by their benefits, which include lower transaction costs due to the lack of human intervention and speedy and accurate trade order placement. To accommodate a variety of consumer needs, market participants are also offering advanced algorithmic trading tools.
The Asia-Pacific area is anticipated to have the highest profitability.
|
Report Metric |
Details |
|
Base Year: |
2020 |
|
Market Size in 2020: |
USD 12,143 Million |
|
Forecast Period: |
2021 to 2028 |
|
Forecast Period 2021 to 2028 CAGR: |
12.7% |
|
2028 Value Projection: |
USD 31,494 Million |
|
No. of Pages: |
242 |
|
Tables & Figures |
120 |
|
Charts |
66 |
|
Segments covered: |
Component, Type, Deployment Mode, and Type of Traders, Region |
Ans. The market size of algorithmic trading surpassed USD 12,143 million in 2020 and will witness a CAGR of over 12.7% through 2028.
Ans. Factors such as rise in demand for reliable, fast, and effective order execution; emergence of favorable government regulations; and the need for market surveillance primarily.
Ans. The key algorithmic trading industry players profiled in the report include 63MOONS, Virtu Financial, Software AG, Refinitiv Ltd. MetaQuotes Software Corp. Symphony Fintech Solutions Pvt Ltd. Argo SE, Tata Consultancy Services, Algo Trader AG, and Tethys
Ans. The algorithmic trading market is segmented on the basis of by Component, Type, Deployment Mode, Type of Traders, and Region.
Ans. The COVID-19 outbreak has low impact on the growth of the algorithmic trading industry, as the algorithmic trading adoption have increased in the face of unprecedented circumstances.
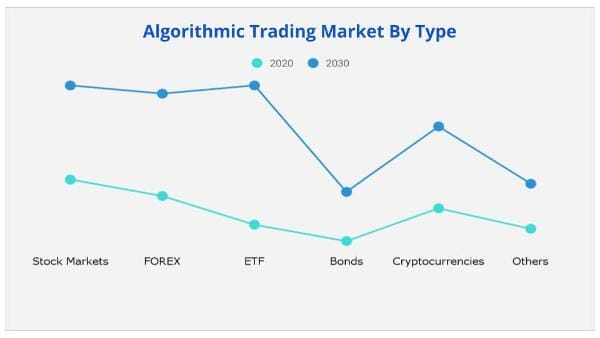
Ans. By type, the global algorithmic trading market share was dominated by the stock markets segment in 2020
CHAPTER 1:INTRODUCTION
1.1.REPORT DESCRIPTION
1.2.KEY BENEFITS FOR STAKEHOLDERS
1.3.KEY MARKET SEGMENTS
1.3.1.Key market players
1.4.RESEARCH METHODOLOGY
1.4.1.Secondary research
1.4.2.Primary research
1.4.3.Analyst tools & models
CHAPTER 2:EXECUTIVE SUMMARY
2.1.KEY FINDINGS
2.1.1.Top impacting factors
2.1.2.Top investment pockets
2.2.CXO PERSPECTIVE
CHAPTER 3:MARKET OVERVIEW
3.1.MARKET DEFINITION AND SCOPE
3.2.KEY FORCES SHAPING THE ALGORITHMIC TRADING MARKET
3.3.MARKET DYNAMICS
3.3.1.Drivers
3.3.1.1.Rise in demand for reliable, fast, and effective order execution
3.3.1.2.Emergence of favorable government regulations
3.3.1.3.The need for market surveillance
3.3.1.4.Rise in demand for reducing the transaction costs
3.3.2.Restraints
3.3.2.1.Insufficient Risk Valuation Capabilities
3.3.3.Opportunities
3.3.3.1.Emergence of AI and algorithms in the financial services
3.3.3.2.Rise in demand for cloud based solutions
3.4.PATENT ANALYSIS
3.4.1.By region (2000-2020)
3.4.2.By applicant
3.5.COVID-19 IMPACT ANALYSIS ON THE ALGORITHMIC TRADING MARKET
3.5.1.Impact on market size
3.5.2.Consumer trends, preferences, and budget impact
3.5.3.Economic impact
3.5.4.Key player strategies to tackle negative impact
3.5.5.Opportunity window
CHAPTER 4:ALGORITHMIC TRADING MARKET, BY COMPONENT
4.1.OVERVIEW
4.2.SOLUTION
4.2.1.Key market trends, growth factors, and opportunities
4.2.2.Market size and forecast, by region
4.2.3.Market analysis, by country
4.3.SERVICES
4.3.1.Key market trends, growth factors, and opportunities
4.3.2.Market size and forecast, by region
4.3.3.Market analysis, by country
CHAPTER 5:ALGORITHMIC TRADING MARKET, BY TYPE
5.1.OVERVIEW
5.2.STOCK MARKETS
5.2.1.Key market trends, growth factors, and opportunities
5.2.2.Market size and forecast, by region
5.2.3.Market analysis, by country
5.3.FOREX
5.3.1.Key market trends, growth factors, and opportunities
5.3.2.Market size and forecast, by region
5.3.3.Market analysis, by country
5.4.ETF
5.4.1.Key market trends, growth factors, and opportunities
5.4.2.Market size and forecast, by region
5.4.3.Market analysis, by country
5.5.BONDS
5.5.1.Key market trends, growth factors, and opportunities
5.5.2.Market size and forecast, by region
5.5.3.Market analysis, by country
5.6.CRYPTOCURRENCIES
5.6.1.Key market trends, growth factors, and opportunities
5.6.2.Market size and forecast, by region
5.6.3.Market analysis, by country
5.7.OTHERS
5.7.1.Key market trends, growth factors, and opportunities
5.7.2.Market size and forecast, by region
5.7.3.Market analysis, by country
CHAPTER 6:ALGORITHMIC TRADING MARKET, BY DEPLOYMENT MODE
6.1.OVERVIEW
6.2.ON-PREMISE
6.2.1.Key market trends, growth factors, and opportunities
6.2.2.Market size and forecast, by region
6.2.3.Market analysis, by country
6.3.CLOUD
6.3.1.Key market trends, growth factors, and opportunities
6.3.2.Market size and forecast, by region
6.3.3.Market analysis, by country
CHAPTER 7:ALGORITHMIC TRADING MARKET, BY TYPE OF TRADERS
7.1.OVERVIEW
7.2.INSTITUTIONAL INVESTORS
7.2.1.Key market trends, growth factors, and opportunities
7.2.2.Market size and forecast, by region
7.2.3.Market analysis, by country
7.3.LONG-TERM TRADERS
7.3.1.Key market trends, growth factors, and opportunities
7.3.2.Market size and forecast, by region
7.3.3.Market analysis, by country
7.4.SHORT-TERM TRADERS
7.4.1.Key market trends, growth factors, and opportunities
7.4.2.Market size and forecast, by region
7.4.3.Market analysis, by country
7.5.RETAIL INVESTORS
7.5.1.Key market trends, growth factors, and opportunities
7.5.2.Market size and forecast, by region
7.5.3.Market analysis, by country
CHAPTER 8:ALGORITHMIC TRADING MARKET, BY REGION
8.1.OVERVIEW
8.2.NORTH AMERICA
8.2.1.Key market trends, growth factors, and opportunities
8.2.2.Market size and forecast, by component
8.2.3.Market size and forecast, by type
8.2.4.Market size and forecast, by Type of traders
8.2.5.Market analysis, by country
8.2.5.1.U.S.
8.2.5.1.1.Market size and forecast, by component
8.2.5.1.2.Market size and forecast, by type
8.2.5.1.3.Market size and forecast, by type of traders
8.2.5.2.Canada
8.2.5.2.1.Market size and forecast, by component
8.2.5.2.2.Market size and forecast, by type
8.2.5.2.3.Market size and forecast, by type of traders
8.3.EUROPE
8.3.1.Key market trends, growth factors, and opportunities
8.3.2.Market size and forecast, by component
8.3.3.Market size and forecast, by type
8.3.4.Market size and forecast, by Type of traders
8.3.5.Market analysis, by country
8.3.5.1.Germany
8.3.5.1.1.Market size and forecast, by component
8.3.5.1.2.Market size and forecast, by type
8.3.5.1.3.Market size and forecast, by type of traders
8.3.5.2.UK
8.3.5.2.1.Market size and forecast, by component
8.3.5.2.2.Market size and forecast, by type
8.3.5.2.3.Market size and forecast, by type of traders
8.3.5.3.France
8.3.5.3.1.Market size and forecast, by component
8.3.5.3.2.Market size and forecast, by type
8.3.5.3.3.Market size and forecast, by type of traders
8.3.5.4.Spain
8.3.5.4.1.Market size and forecast, by component
8.3.5.4.2.Market size and forecast, by type
8.3.5.4.3.Market size and forecast, by type of traders
8.3.5.5.Rest of Europe
8.3.5.5.1.Market size and forecast, by component
8.3.5.5.2.Market size and forecast, by type
8.3.5.5.3.Market size and forecast, by type of traders
8.4.ASIA-PACIFIC
8.4.1.Key market trends, growth factors, and opportunities
8.4.2.Market size and forecast, by component
8.4.3.Market size and forecast, by type
8.4.4.Market size and forecast, by Type of traders
8.4.5.Market analysis, by country
8.4.5.1.China
8.4.5.1.1.Market size and forecast, by component
8.4.5.1.2.Market size and forecast, by type
8.4.5.1.3.Market size and forecast, by type of traders
8.4.5.2.India
8.4.5.2.1.Market size and forecast, by component
8.4.5.2.2.Market size and forecast, by type
8.4.5.2.3.Market size and forecast, by type of traders
8.4.5.3.Japan
8.4.5.3.1.Market size and forecast, by component
8.4.5.3.2.Market size and forecast, by type
8.4.5.3.3.Market size and forecast, by type of traders
8.4.5.4.Australia
8.4.5.4.1.Market size and forecast, by component
8.4.5.4.2.Market size and forecast, by type
8.4.5.4.3.Market size and forecast, by type of traders
8.4.5.5.South Korea
8.4.5.5.1.Market size and forecast, by component
8.4.5.5.2.Market size and forecast, by type
8.4.5.5.3.Market size and forecast, by type of traders
8.4.5.6.Rest of Asia-Pacific
8.4.5.6.1.Market size and forecast, by component
8.4.5.6.2.Market size and forecast, by type
8.4.5.6.3.Market size and forecast, by type of traders
8.5.EUROPE
8.5.1.Key market trends, growth factors, and opportunities
8.5.2.Market size and forecast, by component
8.5.3.Market size and forecast, by type
8.5.4.Market size and forecast, by Type of traders
8.5.5.Market analysis, by country
8.5.5.1.Latin America
8.5.5.1.1.Market size and forecast, by component
8.5.5.1.2.Market size and forecast, by type
8.5.5.1.3.Market size and forecast, by type of traders
8.5.5.2.Middle East
8.5.5.2.1.Market size and forecast, by component
8.5.5.2.2.Market size and forecast, by type
8.5.5.2.3.Market size and forecast, by type of traders
8.5.5.3.Africa
8.5.5.3.1.Market size and forecast, by component
8.5.5.3.2.Market size and forecast, by type
8.5.5.3.3.Market size and forecast, by type of traders
CHAPTER 9:COMPETITIVE LANDSCAPE
9.1.KEY PLAYER POSITIONING ANALYSIS, 2020
9.2.TOP WINNING STRATEGIES
9.3.COMPETITIVE DASHBOARD
9.4.KEY DEVELOPMENTS
9.4.1.New product launches
9.4.2.Collaboration
9.4.3.Acquisition
9.4.4.Partnership
CHAPTER 10:COMPANY PROFILE
10.1.63MOONS
10.1.1.Company overview
10.1.2.Key executives
10.1.3.Company snapshot
10.1.4.Product portfolio
10.1.5.Business performance
10.1.6.Key strategic moves and developments
10.2.VIRTU FINANCIAL
10.2.1.Company overview
10.2.2.Key executives
10.2.3.Company snapshot
10.2.4.Product portfolio
10.2.5.Business performance
10.2.6.Key strategic moves and developments
10.3.SOFTWARE AG
10.3.1.Company overview
10.3.2.Key executive
10.3.3.Company snapshot
10.3.4.Product portfolio
10.3.5.R&D expenditure
10.3.6.Business performance
10.3.7.Key strategic moves and developments
10.4.REFINITIV LTD.
10.4.1.Company overview
10.4.2.Key executive
10.4.3.Company snapshot
10.4.4.Operating business segments
10.4.5.Product portfolio
10.4.6.Business performance
10.4.7.Key strategic moves and developments
10.5.METAQUOTES SOFTWARE CORP.
10.5.1.Company overview
10.5.2.Key executive
10.5.3.Company snapshot
10.5.4.Product portfolio
10.5.5.Key strategic moves and developments
10.6.SYMPHONY FINTECH SOLUTIONS PVT LTD.
10.6.1.Company overview
10.6.2.Key executive
10.6.3.Company snapshot
10.6.4.Product portfolio
10.6.5.Key strategic moves and developments
10.7.ARGO SE
10.7.1.Company overview
10.7.2.Key executives
10.7.3.Company snapshot
10.7.4.Product portfolio
10.7.5.Key strategic moves and developments
10.8.TATA CONSULTANCY SERVICES
10.8.1.Company overview
10.8.2.Key executive
10.8.3.Company snapshot
10.8.4.Product portfolio
10.8.5.R&D expenditure
10.8.6.Business performance
10.8.7.Key strategic moves and developments
10.9.ALGO TRADER AG
10.9.1.Company overview
10.9.2.Key executive
10.9.3.Company snapshot
10.9.4.Product portfolio
10.9.5.Key strategic moves and developments
10.10.TETHYS
10.10.1.Company overview
10.10.2.Key Executives
10.10.3.Company snapshot
10.10.4.Product portfolio
10.10.5.Key strategic moves and developments
Table 01.Algorithmic Trading Market, By Component, 2020–2028 ($Million)
Table 02.Algorithmic Trading Market, By Region, 2020–2028 ($Million)
Table 03.Algorithmic Trading Market For Services, By Region, 2020–2028 ($Million)
Table 04.Algorithmic Trading Market, By Type, 2020–2028 ($Million)
Table 05.Algorithmic Trading Market For Stock Markets, By Region, 2020–2028 ($Million)
Table 06.Forex-Based Algorithmic Trading Market, By Region, 2020–2028 ($Million)
Table 07.Etf-Based Algorithmic Trading Market, By Region, 2020–2028 ($Million)
Table 08.Bonds-Based Algorithmic Trading Market, By Region, 2020–2028 ($Million)
Table 09.Bonds-Based Algorithmic Trading Market, By Region, 2020–2028 ($Million)
Table 10.Others-Based Algorithmic Trading Market, By Region, 2020–2028 ($Million)
Table 11.Algorithmic Trading Market, By Deployment Mode, 2020–2028 ($Million)
Table 12.Algorithmic Trading Market For On-Premise, By Region, 2020–2028 ($Million)
Table 13.Algorithmic Trading Market For Cloud, By Region, 2020–2028 ($Million)
Table 14.Algorithmic Trading Market, By Type Of Traders, 2020–2028 ($Million)
Table 15.Algorithmic Trading Market For Institutional Investors, By Region, 2020–2028 ($Million)
Table 16.Algorithmic Trading Market For Long-Term Traders, By Region, 2020–2028 ($Million)
Table 17.Algorithmic Trading Market For Short-Term Traders, By Region, 2020–2028 ($Million)
Table 18.Algorithmic Trading Market For Government And Eduaction, By Region, 2020–2028 ($Million)
Table 19.Algorithmic Trading Market For It And Telecom, By Region, 2020–2028 ($Million)
Table 20.Algorithmic Trading Market, By Region, 2020–2028 ($Million)
Table 21.North America Algorithmic Trading Market, By Component, 2020–2028 ($Million)
Table 22.North America Algorithmic Trading Market, By Type, 2020–2028 ($Million)
Table 23.North America Algorithmic Trading Market, By Type Of Traders, 2020–2028 ($Million)
Table 24.North America Algorithmic Trading Market, By Country, 2020–2028 ($Million)
Table 25.U.S. Algorithmic Trading Market, By Component, 2020–2028 ($Million)
Table 26.U.S. Algorithmic Trading Market, By Type, 2020–2028 ($Million)
Table 27.U.S. Algorithmic Trading Market, By Type Of Traders, 2020–2028 ($Million)
Table 28.Canada Algorithmic Trading Market, By Component, 2020–2028 ($Million)
Table 29.Canada Algorithmic Trading Market, By Type, 2020–2028 ($Million)
Table 30.Canada Algorithmic Trading Market, By Type Of Traders, 2020–2028 ($Million)
Table 31.Europe Algorithmic Trading Market, By Component, 2020–2028 ($Million)
Table 32.Europe Algorithmic Trading Market, By Type, 2020–2028 ($Million)
Table 33.Europe Algorithmic Trading Market, By Type Of Traders, 2020–2028 ($Million)
Table 34.Europe Algorithmic Trading Market, By Country, 2020–2028 ($Million)
Table 35.Germany Algorithmic Trading Market, By Component, 2020–2028 ($Million)
Table 36.Germany Algorithmic Trading Market, By Type, 2020–2028 ($Million)
Table 37.Germany Algorithmic Trading Market, By Type Of Traders, 2020–2028 ($Million)
Table 38.Uk Algorithmic Trading Market, By Component, 2020–2028 ($Million)
Table 39.Uk Algorithmic Trading Market, By Type, 2020–2028 ($Million)
Table 40.Uk Algorithmic Trading Market, By Type Of Traders, 2020–2028 ($Million)
Table 41.France Algorithmic Trading Market, By Component, 2020–2028 ($Million)
Table 42.France Algorithmic Trading Market, By Type, 2020–2028 ($Million)
Table 43.France Algorithmic Trading Market, By Type Of Traders, 2020–2028 ($Million)
Table 44.Spain Algorithmic Trading Market, By Component, 2020–2028 ($Million)
Table 45.Spain Algorithmic Trading Market, By Type, 2020–2028 ($Million)
Table 46.Spain Algorithmic Trading Market, By Type Of Traders, 2020–2028 ($Million)
Table 47.Rest Of Europe Algorithmic Trading Market, By Component, 2020–2028 ($Million)
Table 48.Rest Of Europe Algorithmic Trading Market, By Type, 2020–2028 ($Million)
Table 49.Rest Of Europe Algorithmic Trading Market, By Type Of Traders, 2020–2028 ($Million)
Table 50.Asia-Pacific Algorithmic Trading Market, By Component, 2020–2028 ($Million)
Table 51.Asia-Pacific Algorithmic Trading Market, By Type, 2020–2028 ($Million)
Table 52.Asia-Pacific Algorithmic Trading Market, By Type Of Traders, 2020–2028 ($Million)
Table 53.Asia-Pacific Algorithmic Trading Market, By Country, 2020–2028 ($Million)
Table 54.China Algorithmic Trading Market, By Component, 2020–2028 ($Million)
Table 55.China Algorithmic Trading Market, By Type, 2020–2028 ($Million)
Table 56.China Algorithmic Trading Market, By Type Of Traders, 2020–2028 ($Million)
Table 57.India Algorithmic Trading Market, By Component, 2020–2028 ($Million)
Table 58.India Algorithmic Trading Market, By Type, 2020–2028 ($Million)
Table 59.India Algorithmic Trading Market, By Type Of Traders, 2020–2028 ($Million)
Table 60.Japan Algorithmic Trading Market, By Component, 2020–2028 ($Million)
Table 61.Japan Algorithmic Trading Market, By Type, 2020–2028 ($Million)
Table 62.Japan Algorithmic Trading Market, By Type Of Traders, 2020–2028 ($Million)
Table 63.Australia Algorithmic Trading Market, By Component, 2020–2028 ($Million)
Table 64.Australia Algorithmic Trading Market, By Type, 2020–2028 ($Million)
Table 65.Australia Algorithmic Trading Market, By Type Of Traders, 2020–2028 ($Million)
Table 66.South Korea Algorithmic Trading Market, By Component, 2020–2028 ($Million)
Table 67.South Korea Algorithmic Trading Market, By Type, 2020–2028 ($Million)
Table 68.South Korea Algorithmic Trading Market, By Type Of Traders, 2020–2028 ($Million)
Table 69.Rest Of Asia-Pacific Algorithmic Trading Market, By Component, 2020–2028 ($Million)
Table 70.Rest Of Asia-Pacific Algorithmic Trading Market, By Type, 2020–2028 ($Million)
Table 71.Rest Of Asia-Pacific Algorithmic Trading Market, By Type Of Traders, 2020–2028 ($Million)
Table 72.Europe Algorithmic Trading Market, By Component, 2020–2028 ($Million)
Table 73.Europe Algorithmic Trading Market, By Type, 2020–2028 ($Million)
Table 74.Europe Algorithmic Trading Market, By Type Of Traders, 2020–2028 ($Million)
Table 75.Europe Algorithmic Trading Market, By Country, 2020–2028 ($Million)
Table 76.Latin America Algorithmic Trading Market, By Component, 2020–2028 ($Million)
Table 77.Latin America Algorithmic Trading Market, By Type, 2020–2028 ($Million)
Table 78.Latin America Algorithmic Trading Market, By Type Of Traders, 2020–2028 ($Million)
Table 79.Middle East Algorithmic Trading Market, By Component, 2020–2028 ($Million)
Table 80.Middle East Algorithmic Trading Market, By Type, 2020–2028 ($Million)
Table 81.Middle East Algorithmic Trading Market, By Type Of Traders, 2020–2028 ($Million)
Table 82.Africa Algorithmic Trading Market, By Component, 2020–2028 ($Million)
Table 83.Africa Algorithmic Trading Market, By Type, 2020–2028 ($Million)
Table 84.Africa Algorithmic Trading Market, By Type Of Traders, 2020–2028 ($Million)
Table 85.Key New Product Launches (2017-2020)
Table 86.Collaboration (2017-2020)
Table 87.Acquistion (2017-2020)
Table 88.Partnership (2017-2020)
Table 89.63 Moons: Key Executives
Table 90.63 Moons: Company Snapshot
Table 91.63 Moons: Product Portfolio
Table 92.Virtu Financial.: Key Executives
Table 93.Virtu Financial: Company Snapshot
Table 94.Virtu Financial: Product Portfolio
Table 95.Software Ag: Key Executive
Table 96.Software Ag: Company Snapshot
Table 97.Software Ag: Product Portfolio
Table 98.Refinitiv Ltd.: Key Executive
Table 99.Refinitiv Ltd.: Company Snapshot
Table 100.London Stock Exchange Group: Operating Segments
Table 101.Refinitiv Ltd.: Product Portfolio
Table 102.Metaquotes Software Corporation: Key Executive
Table 103.Metaquotes Software Corporation: Company Snapshot
Table 104.Metaquotes Software Corporation: Product Portfolio
Table 105.Symphony Fintech Solutions Pvt Ltd.: Key Executive
Table 106.Symphony Fintech Solutions Pvt Ltd.: Company Snapshot
Table 107.Symphony Fintech Solutions Pvt Ltd.: Product Portfolio
Table 108.Symphony Fintech Solutions Pvt Ltd.: Key Strategic Moves And Developments
Table 109.Argo Se: Key Executives
Table 110.Argo Se: Company Snapshot
Table 111.Argo Se: Product Portfolio
Table 112.Tata Consultancy Services: Key Executive
Table 113.Tata Consultancy Services: Company Snapshot
Table 114.Tata Consultancy Services: Product Portfolio
Table 115.Algo Trader: Key Executive
Table 116.Algo Trader Ag: Company Snapshot
Table 117.Algo Trader Ag: Product Portfolio
Table 118.Tethys Technology, Inc: Key Executives
Table 119.Tethys Technology, Inc. Company Snapshot
Table 120.Tethys Technology, Inc.: Product Portfolio
List Of Figures
Figure 01.Key Market Segments
Figure 02.Algorithmic Trading Market Snapshot, By Segment, 2020–2028
Figure 03.Algorithmic Trading Market Snapshot, By Country, 2020–2028
Figure 04.Top Impacting Factors
Figure 05.Top Investment Pockets
Figure 06.Moderate-To-High Bargaining Power Of Suppliers
Figure 07.Moderate-To-High Bargaining Power Of Buyers
Figure 08.Moderate Threat Of Substitutes
Figure 09.Moderate-To-High Threat Of New Entrants
Figure 10.High Competitive Rivalry
Figure 11.Market Dynamics: Global Algorithmic Trading Market
Figure 12.Patent Analysis, By Region
Figure 13.Patent Analysis, By Applicant
Figure 14.Algorithmic Trading Market, By Component, 2020–2028 ($Million)
Figure 15.Comparative Share Analysis Of Algorithmic Trading Market, By Country, 2020 & 2028 (%)
Figure 16.Comparative Share Analysis Of Algorithmic Trading Market For Services, By Country, 2020 & 2028 (%)
Figure 17.Algorithmic Trading Market, By Type, 2020–2028 ($Million)
Figure 18.Comparative Share Analysis Of Stock Markets Algorithmic Trading Market, By Country, 2020 & 2028 (%)
Figure 19.Comparative Share Analysis Of Forex-Based Algorithmic Trading Market, By Country, 2020 & 2028 (%)
Figure 20.Comparative Share Analysis Of Etf-Based Algorithmic Trading Market, By Country, 2020 & 2028 (%)
Figure 21.Comparative Share Analysis Of Bonds-Based Algorithmic Trading Market, By Country, 2020 & 2028 (%)
Figure 22.Comparative Share Analysis Of Bonds-Based Algorithmic Trading Market, By Country, 2020 & 2028 (%)
Figure 23.Comparative Share Analysis Of Others-Based Algorithmic Trading Market, By Country, 2020 & 2028 (%)
Figure 24.Algorithmic Trading Market, By Deployment Mode, 2020–2028 ($Million)
Figure 25.Comparative Share Analysis Of Stock Markets Algorithmic Trading Market For On-Premise, By Country, 2020 & 2028 (%)
Figure 26.Comparative Share Analysis Of Algorithmic Trading Market For Cloud, By Country, 2020 & 2028 (%)
Figure 27.Algorithmic Trading Market, By Type Of Traders, 2020–2028 ($Million)
Figure 28.Comparative Share Analysis Of Algorithmic Trading Market For Institutional Investors, By Country, 2020 & 2028 (%)
Figure 29.Comparative Share Analysis Of Algorithmic Trading Market For Long-Term Traders, By Country, 2020 & 2028 (%)
Figure 30.Comparative Share Analysis Of Algorithmic Trading Market For Short-Term Traders, By Country, 2020 & 2028 (%)
Figure 31.Comparative Share Analysis Of Algorithmic Trading Market For Government And Eduaction, By Country, 2020 & 2028 (%)
Figure 32.Comparative Share Analysis Of Algorithmic Trading Market For Transport & Logistic, By Country, 2020 & 2028 (%)
Figure 33.U.S. Algorithmic Trading Market, 2020–2028 ($Million)
Figure 34.Canada Algorithmic Trading Market, 2020–2028 ($Million)
Figure 35.Germany Algorithmic Trading Market, 2020–2028 ($Million)
Figure 36.Uk Algorithmic Trading Market, 2020–2028 ($Million)
Figure 37.France Algorithmic Trading Market, 2020–2028 ($Million)
Figure 38.Spain Algorithmic Trading Market, 2020–2028 ($Million)
Figure 39.Rest Of Europe Algorithmic Trading Market, 2020–2028 ($Million)
Figure 40.China Algorithmic Trading Market, 2020–2028 ($Million)
Figure 41.India Algorithmic Trading Market, 2020–2028 ($Million)
Figure 42.Japan Algorithmic Trading Market, 2020–2028 ($Million)
Figure 43.Australia Algorithmic Trading Market, 2020–2028 ($Million)
Figure 44.South Korea Algorithmic Trading Market, 2020–2028 ($Million)
Figure 45.Rest Of Asia-Pacific Algorithmic Trading Market, 2020–2028 ($Million)
Figure 46.Latin America Algorithmic Trading Market, 2020–2028 ($Million)
Figure 47.Middle East Algorithmic Trading Market, 2020–2028 ($Million)
Figure 48.Africa Algorithmic Trading Market, 2020–2028 ($Million)
Figure 49.Key Player Positioning Analysis: Global Algorithmic Trading Market
Figure 50.Top Winning Strategies, By Year, 2017-2021
Figure 51.Top Winning Strategies, By Development, 2017-2021
Figure 52.Top Winning Strategies, By Company, 2017-2021
Figure 53.Competitive Dashboard
Figure 54.Competitive Dashboard
Figure 55.Competitive Heatmap Of Key Players
Figure 56.63 Moons: Revenue, 2018–2020 ($Million)
Figure 57.63 Moons: Revenue Share By Region, 2020 (%)
Figure 58.Virtu Financial: Revenue, 2018–2020 ($Million)
Figure 59.Virtu Financial: Revenue Share By Region, 2019 (%)
Figure 60.R&D Expenditure, 2018-2020 ($Million)
Figure 61.Software Ag: Revenue, 2018–2020 ($Million)
Figure 62.London Stock Exchange Group: Revenue, 2018–2020 ($Million)
Figure 63.London Stock Exchange Group: Revenue Share By Segment, 2020 (%)
Figure 64.R&D Expenditure, 2018–2020 ($Million)
Figure 65.Tata Consultancy Services: Revenue, 2018–2020 ($Million)
Figure 66.Tata Consultancy Services: Revenue Share By Region, 2020 (%)
$6169
$10665
HAVE A QUERY?
OUR CUSTOMER