
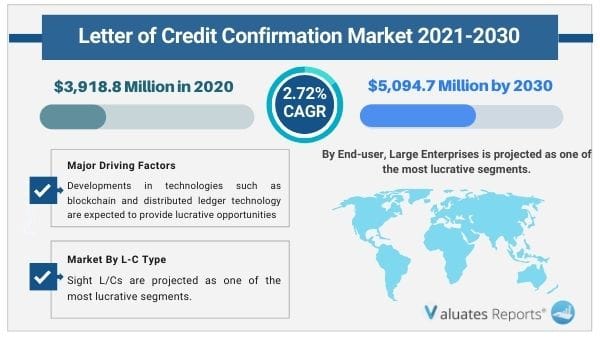
The letter of credit confirmation market was valued at USD 3918.8 million in 2020, and it is anticipated to reach USD 5094.7 million by 2030, registering a CAGR of about 2.72% during the forecast period (2021–2030). Increased non-payment of debt risk and tight regulatory requirements for the secured letter of credit confirmation services are two major factors driving the letter of credit confirmation industry.
Nevertheless, the market for letters of credit confirmation will see certain development restraints throughout the projected period due to rising fraud and cyberattacks in online service channels. Rapid technological progress will also fuel the market's expansion over the study period.
Concerns about trade have grown as a result of growing international commerce because exporters and importers seldom know one another. They are nationals of several nations. The political, social, and economic climates are completely different, which raises the risks associated with conducting business internationally. Even if the issuing bank or the importer is unable to complete the transaction, the additional security offered by the letter of credit confirmation by the confirming bank guarantees payment. The letter of credit is examined by the banks to determine its validity. Therefore, traders favor it. This is hence anticipated to fuel the letter of credit confirmation market's expansion over the course of the predicted time.
Due to the involvement of several intermediaries in the online trading system used by the issuer and beneficiary banks, fraudulent activities have significantly expanded. Because they provide access to private trade information, financial services are the top targets for hackers. Another major threat to the sector is data leakage and fraudulent paperwork supplied by importers and exporters. In the upcoming years, it is anticipated that these reasons will limit the letter of credit confirmation market's expansion. Operational hazards have grown due to globalization.
The whole landscape of the international trade finance business has transformed as a result of the advent of cutting-edge technologies like blockchain and DLT (Distributed Ledger Technology). Numerous problems affect LCs (letters of credit), including inefficiencies in the trading system, delays caused by contracts, exorbitant expenses, and disagreements over murky terms and conditions. Automating contracts on the blockchain ensures quicker compliance, assured payments, and the removal of time-consuming paperwork, hence boosting convenience. In the upcoming years, these factors will accelerate the market for the letter of credit confirmation growth.
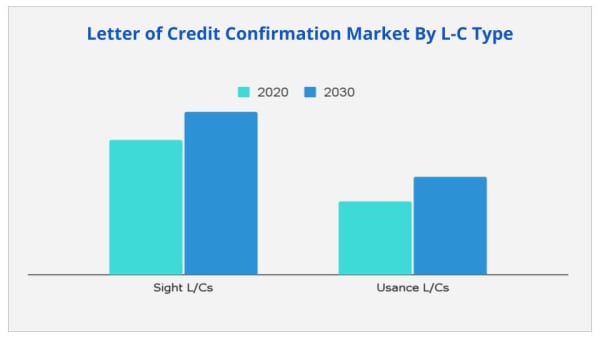
Based on the type, the market share for letters of credit confirmation is predicted to be dominated by the sight L/C segment because sight payments are quicker and instantaneous, which has led to widespread acceptance.
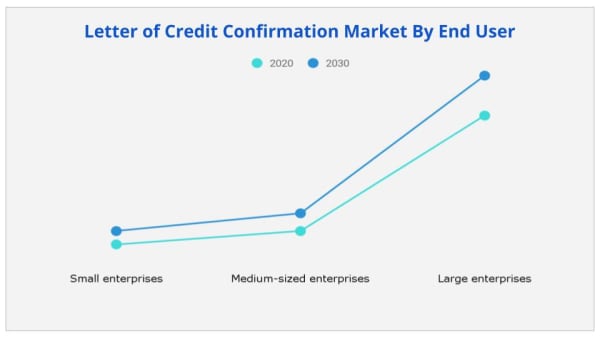
Because many large enterprises operate on a worldwide basis and are the biggest users of letter of credit services, the large enterprise category is anticipated to provide enormous potential for development in the letter of credit confirmation market share.
Due to the expanding economies of emerging nations, the complexity of regulations, and the expansion of enterprises in the area, the Asia-Pacific sector will have the biggest growth in the letter of credit confirmation market share.
| Report Metric | Details |
| Report Name | Letter of Credit Confirmation Market |
| The market size in 2020 | USD 3918.8 million |
| The revenue forecast in 2030 | USD 5094.7 million |
| Growth Rate | CAGR 2.72% |
| Market size available for years | 2021-2030 |
| Forecast units | Value (USD) |
| Segments covered | Type, Application, Industry, Regions |
| Report coverage | Revenue & volume forecast, company share, competitive landscape, growth factors, and trends |
| Geographic regions covered | North America, Europe, Asia Pacific, Latin America, Middle East & Africa |
Ans. The global letter of credit confirmation market size is estimated to grow at a CAGR of 2.72% over the forecast timeframe and reach a market value of around USD 5094.7 million by 2030.
Ans. By End-user, Large Enterprises is projected as one of the most lucrative segments.
Ans. Rise in demand for customized trade finance solutions and regulatory support in growth of strict regulations for secured letter of credit confirmation services are some of major factors drives the letter of credit confirmation market growth.
Ans. The report analyses the profiles of key players operating in the market such as Bank of America Corporation, Citigroup, Inc., DBS Bank Ltd., JP Morgan Chase & Co., Mizuho Bank, Ltd., MUFG Bank, Scotiabank, Standard Chartered, Sumitomo Mitsui Banking Corporation, and The PNC Financial Services Group, Inc
Ans. The global letter of credit confirmation market size was valued at US$ 3918.8 million in 2020.
Ans. The forecast period considered for the global letter of credit confirmation market is 2021 to 2030.
TABLE OF CONTENT
CHAPTER 1:INTRODUCTION
1.1.Report description
1.2.Key benefits for stakeholders
1.3.Key market segments
1.4.Key market segments
1.5.Research methodology
1.5.1.Secondary research
1.5.2.Primary research
1.5.3.Analyst tools & models
CHAPTER 2:EXECUTIVE SUMMARY
2.1.Key findings
2.1.1.Top impacting factors
2.1.2.Top investment pockets
2.2.CXO perspective
CHAPTER 3:MARKET OVERVIEW
3.1.Market definition and scope
3.2.Key forces shaping the letter of credit confirmation market
3.3.Methods of payment collection in letter of credit confirmation market
3.3.1.Invoices
3.3.2.Bills of Exchange
3.3.3.Government Documents
3.4.Market dynamics
3.4.1.Drivers
3.4.1.1.Increased risk of non-payment
3.4.1.2.Rise in demand for customized trade services
3.4.1.3.Growth in strict terms and conditions
3.4.2.Restraint
3.4.2.1.Increase in fraud and cyber attacks
3.4.3.Opportunities
3.4.3.1.New technological developments
3.4.3.2.Untapped potential of emerging economies
CHAPTER 4:LETTER OF CREDIT CONFIRMATION MARKET, BY L/C TYPE
4.1.Overview
4.1.1.Market size and forecast
4.1.2.Market volume and forecast
4.2.Sight L/Cs
4.2.1.Key market trends, growth factors, and opportunities
4.2.2.Market size and forecast, by region
4.2.3.Market volume and forecast, by region
4.3.Usance L/Cs
4.3.1.Key market trends, growth factors, and opportunities
4.3.2.Market size and forecast, by region
4.3.3.Market volume and forecast, by region
CHAPTER 5:LETTER OF CREDIT CONFIRMATION MARKET, BY END USER
5.1.Overview
5.1.1.Market size and forecast, by region
5.1.2.Market volume and forecast, by region
5.2.Small enterprises
5.2.1.Key market trends, growth factors, and opportunities
5.2.2.Market size and forecast, by region
5.2.3.Market volume and forecast, by region
5.3.Medium-sized enterprises
5.3.1.Key market trends, growth factors, and opportunities
5.3.2.Market size and forecast, by region
5.3.3.Market volume and forecast, by region
5.4.Large enterprises
5.4.1.Key market trends, growth factors, and opportunities
5.4.2.Market size and forecast, by region
5.4.3.Market volume and forecast, by region
CHAPTER 6:LETTER OF CREDIT CONFIRMATION MARKET, BY REGION
6.1.Overview
6.1.1.Market size and forecast, by region
6.1.2.Market volume and forecast, by region
6.2.North America
6.2.1.Key market trends, growth factors, and opportunities
6.2.2.Market size and forecast, by L/Cs type
6.2.3.Market volume and forecast, by L/Cs type
6.2.4.Market size and forecast, by end user
6.2.5.Market volume and forecast, by end user
6.2.6.Market revenue analysis, by country
6.2.7.Market volume analysis, by country
6.2.7.1.U.S.
6.2.7.1.1.Market size and forecast, by L/Cs type
6.2.7.1.2.Market volume and forecast, by L/Cs type
6.2.7.1.3.Market size and forecast, by end user
6.2.7.1.4.Market volume and forecast, by end user
6.2.7.2.Canada
6.2.7.2.1.Market size and forecast, by L/Cs type
6.2.7.2.2.Market volume and forecast, by L/Cs type
6.2.7.2.3.Market size and forecast, by end user
6.2.7.2.4.Market volume and forecast, by end user
6.2.7.3.Mexico
6.2.7.3.1.Market size and forecast, by L/Cs type
6.2.7.3.2.Market volume and forecast, by L/Cs type
6.2.7.3.3.Market size and forecast, by end user
6.2.7.3.4.Market volume and forecast, by end user
6.3.Europe
6.3.1.Key market trends, growth factors and opportunities
6.3.2.Market size and forecast, by L/Cs type
6.3.3.Market volume and forecast, by L/Cs type
6.3.4.Market size and forecast, by end user
6.3.5.Market volume and forecast, by end user
6.3.6.Market revenue analysis, by country
6.3.7.Market volume analysis, by country
6.3.7.1.Germany
6.3.7.1.1.Market size and forecast, by L/Cs type
6.3.7.1.2.Market volume and forecast, by L/Cs type
6.3.7.1.3.Market size and forecast, by end user
6.3.7.1.4.Market volume and forecast, by end user
6.3.7.2.France
6.3.7.2.1.Market size and forecast, by L/Cs type
6.3.7.2.2.Market volume and forecast, by L/Cs type
6.3.7.2.3.Market size and forecast, by end user
6.3.7.2.4.Market volume and forecast, by end user
6.3.7.3.UK
6.3.7.3.1.Market size and forecast, by L/Cs type
6.3.7.3.2.Market volume and forecast, by L/Cs type
6.3.7.3.3.Market size and forecast, by end user
6.3.7.3.4.Market volume and forecast, by end user
6.3.7.4.Italy
6.3.7.4.1.Market size and forecast, by L/Cs type
6.3.7.4.2.Market volume and forecast, by L/Cs type
6.3.7.4.3.Market size and forecast, by end user
6.3.7.4.4.Market volume and forecast, by end user
6.3.7.5.Spain
6.3.7.5.1.Market size and forecast, by L/Cs type
6.3.7.5.2.Market volume and forecast, by L/Cs type
6.3.7.5.3.Market size and forecast, by end user
6.3.7.5.4.Market volume and forecast, by end user
6.3.7.6.Russia
6.3.7.6.1.Market size and forecast, by L/Cs type
6.3.7.6.2.Market volume and forecast, by L/Cs type
6.3.7.6.3.Market size and forecast, by end user
6.3.7.6.4.Market volume and forecast, by end user
6.3.7.7.Rest of Europe
6.3.7.7.1.Market size and forecast, by L/Cs type
6.3.7.7.2.Market volume and forecast, by L/Cs type
6.3.7.7.3.Market size and forecast, by end user
6.3.7.7.4.Market volume and forecast, by end user
6.4.Asia-Pacific
6.4.1.Key market trends, growth factors and opportunities
6.4.2.Market size and forecast, by L/Cs type
6.4.3.Market volume and forecast, by L/Cs type
6.4.4.Market size and forecast, by end user
6.4.5.Market volume and forecast, by end user
6.4.6.Market revenue analysis, by country
6.4.7.Market volume analysis, by country
6.4.7.1.Japan
6.4.7.1.1.Market size and forecast, by LCs type
6.4.7.1.2.Market volume and forecast, by LCs type
6.4.7.1.3.Market size and forecast, by end user
6.4.7.1.4.Market volume and forecast, by end user
6.4.7.2.China
6.4.7.2.1.Market size and forecast, by LCs type
6.4.7.2.2.Market volume and forecast, by LCs type
6.4.7.2.3.Market size and forecast, by end user
6.4.7.2.4.Market volume and forecast, by end user
6.4.7.3.Australia
6.4.7.3.1.Market size and forecast, by LCs type
6.4.7.3.2.Market volume and forecast, by L/Cs type
6.4.7.3.3.Market size and forecast, by end user
6.4.7.3.4.Market size and volume, by end user
6.4.7.4.India
6.4.7.4.1.Market size and forecast, by L/Cs type
6.4.7.4.2.Market volume and forecast, by L/Cs type
6.4.7.4.3.Market size and forecast, by end user
6.4.7.4.4.Market size and volume, by end user
6.4.7.5.South Korea
6.4.7.5.1.Market size and forecast, by L/Cs type
6.4.7.5.2.Market volume and forecast, by L/Cs type
6.4.7.5.3.Market size and forecast, by end user
6.4.7.5.4.Market size and volume, by end user
6.4.7.6.Rest of Asia-Pacific
6.4.7.6.1.Market size and forecast, by L/Cs type
6.4.7.6.2.Market volume and forecast, by L/Cs type
6.4.7.6.3.Market size and forecast, by end user
6.4.7.6.4.Market volume and forecast, by end user
6.5.LAMEA
6.5.1.Key market trends, growth factors and opportunities
6.5.2.Market size and forecast, by L/Cs type
6.5.3.Market volume and forecast, by L/Cs type
6.5.4.Market size and forecast, by end user
6.5.5.Market volume and forecast, by end user
6.5.6.Market revenue analysis, by country
6.5.7.Market volume analysis, by country
6.5.7.1.Brazil
6.5.7.1.1.Market size and forecast, by L/Cs type
6.5.7.1.2.Market volume and forecast, by L/Cs type
6.5.7.1.3.Market size and forecast, by end user
6.5.7.1.4.Market volume and forecast, by end user
6.5.7.2.Turkey
6.5.7.2.1.Market size and forecast, by L/Cs type
6.5.7.2.2.Market volume and forecast, by L/Cs type
6.5.7.2.3.Market size and forecast, by end user
6.5.7.2.4.Market volume and forecast, by end user
6.5.7.3.Saudi Arabia
6.5.7.3.1.Market size and forecast, by L/Cs type
6.5.7.3.2.Market volume and forecast, by L/Cs type
6.5.7.3.3.Market size and forecast, by end user
6.5.7.3.4.Market volume and forecast, by end user
6.5.7.4.South Africa
6.5.7.4.1.Market size and forecast, by L/Cs type
6.5.7.4.2.Market volume and forecast, by L/Cs type
6.5.7.4.3.Market size and forecast, by end user
6.5.7.4.4.Market volume and forecast, by end user
6.5.7.5.Rest of LAMEA
6.5.7.5.1.Market size and forecast, by L/Cs type
6.5.7.5.2.Market volume and forecast, by L/Cs type
6.5.7.5.3.Market size and forecast, by end user
6.5.7.5.4.Market volume and forecast, by end user
CHAPTER 7:COMPANY PROFILES
7.1.Bank of America Corporation
7.1.1.Company overview
7.1.2.Key Executives
7.1.3.Company snapshot
7.1.4.Product portfolio
7.1.5.Business performance
7.2.Citigroup, Inc.
7.2.1.Company overview
7.2.2.Key Executives
7.2.3.Company snapshot
7.2.4.Operating business segments
7.2.5.Product portfolio
7.2.6.Business performance
7.3.DBS Bank Ltd.
7.3.1.Company overview
7.3.2.Key Executives
7.3.3.Company snapshot
7.3.4.Product portfolio
7.3.5.Business performance
7.4.JPMorgan Chase & Co.
7.4.1.Company overview
7.4.2.Key Executives
7.4.3.Company snapshot
7.4.4.Product portfolio
7.4.5.Business performance
7.5.Mizuho Bank, Ltd.
7.5.1.Company overview
7.5.2.Key Executives
7.5.3.Company snapshot
7.5.4.Product portfolio
7.5.6.Business performance
7.6.MUFG Bank, Ltd.
7.6.1.Company overview
7.6.2.Key Executives
7.6.3.Company snapshot
7.6.4.Product portfolio
7.7.Scotiabank
7.7.1.Company overview
7.7.2.Key Executives
7.7.3.Company snapshot
7.7.4.Product portfolio
7.7.5.Operating business segments
7.7.6.Business performance
7.8.Standard Chartered
7.8.1.Company overview
7.8.2.Key Executives
7.8.3.Company snapshot
7.8.4.Product portfolio
7.8.5.Operating business segments
7.8.6.Business performance
7.9.Sumitomo Mitsui Banking Corporation
7.9.1.Company overview
7.9.2.Key Executives
7.9.3.Company snapshot
7.9.4.Product portfolio
7.10.The PNC Financial Services Group, Inc.
7.10.1.Company overview
7.10.2.Key Executives
7.10.3.Company snapshot
7.10.4.Product portfolio
7.10.5.Business performance
List of Tables & Figures
Table 01.Letter Of Credit Confirmation Market Revenue, By L/C Type, 2020-2030 ($Million)
Table 02.Letter Of Credit Confirmation Market Volume, By L/C Type, 2020-2030 ($Million)
Table 03.Letter Of Credit Confirmation Market Revenue For Sight L/Cs, By Region, 2020-2030 ($Million)
Table 04.Letter Of Credit Confirmation Market Volume For Sight L/Cs, By Region, 2020-2030 ($Million)
Table 05.Letter Of Credit Confirmation Market Revenue For Usance L/Cs, By Region, 2020-2030 ($Million)
Table 06.Letter Of Credit Confirmation Market Volume For Usance L/Cs, By Region, 2020-2030 ($Million)
Table 07.Letter Of Credit Confirmation Market Revenue, By End User, 2020–2030 ($Million)
Table 08.Letter Of Credit Confirmation Market Volume, By End User, 2020–2030 ($Million)
Table 09.Letter Of Credit Confirmation Market Revenue For Small Enterprises, By Region, 2020-2030 ($Million)
Table 10.Letter Of Credit Confirmation Market Volume For Small Enterprises, By Region, 2020-2030 ($Million)
Table 11.Letter Of Credit Confirmation Market Revenue For Medium Sized Enterprises, By Region, 2020-2030 ($Million)
Table 12.Letter Of Credit Confirmation Market Volume For Medium Sized Enterprises, By Region, 2020-2030 ($Million)
Table 13.Letter Of Credit Confirmation Market Revenue For Large Enterprises, By Region, 2020-2030 ($Million)
Table 14.Letter Of Credit Confirmation Market Volume For Large Enterprises, By Region, 2020-2030 ($Million)
Table 15.Letter Of Credit Confirmation Market Revenue, By Region, 2020-2030 ($Million)
Table 16.Letter Of Credit Confirmation Market Volume, By Region, 2020-2030 ($Million)
Table 17.North America Letter Of Credit Confirmation Market Revenue, By L/C Type, 2020–2030 ($Million)
Table 18.North America Letter Of Credit Confirmation Market Volume, By L/C Type, 2020–2030 ($Million)
Table 19.North America Letter Of Credit Confirmation Market Revenue, By End User, 2020–2030 ($Million)
Table 20.North America Letter Of Credit Confirmation Market Volume, By End User, 2020–2030 ($Million)
Table 21.North America Letter Of Credit Confirmation Market Revenue, By Country, 2020–2030 ($Million)
Table 22.North America Letter Of Credit Confirmation Market Volume, By Country, 2020–2030 ($Million)
Table 23.U.S. Letter Of Credit Confirmation Market Revenue, By L/C Type, 2020–2030 ($Million)
Table 24.U.S. Letter Of Credit Confirmation Market Volume, By L/C Type, 2020–2030 ($Million)
Table 25.U.S. Letter Of Credit Confirmation Market Revenue, By End User, 2020–2030 ($Million)
Table 26.U.S. Letter Of Credit Confirmation Market Volume, By End User, 2020–2030 ($Million)
Table 27.Canada Letter Of Credit Confirmation Market Revenue, By L/C Type, 2020–2030 ($Million)
Table 28.Canada Letter Of Credit Confirmation Market Volume, By L/C Type, 2020–2030 ($Million)
Table 29.Canada Letter Of Credit Confirmation Market Revenue, By End User, 2020–2030 ($Million)
Table 30.Canada Letter Of Credit Confirmation Market Volume, By End User, 2020–2030 ($Million)
Table 31.Mexico Letter Of Credit Confirmation Market Revenue, By L/C Type, 2020–2030 ($Million)
Table 32.Mexico Letter Of Credit Confirmation Market Volume, By L/C Type, 2020–2030 ($Million)
Table 33.Mexico Letter Of Credit Confirmation Market Revenue, By End User, 2020–2030 ($Million)
Table 34.Mexico Letter Of Credit Confirmation Market Volume, By End User, 2020–2030 ($Million)
Table 35.Europe Letter Of Credit Confirmation Market Revenue, By L/C Type, 2020–2030 ($Million)
Table 36.Europe Letter Of Credit Confirmation Market Volume, By L/C Type, 2020–2030 ($Million)
Table 37.Europe Letter Of Credit Confirmation Market Revenue, By End User, 2020–2030 ($Million)
Table 38.Europe Letter Of Credit Confirmation Market Volume, By End User, 2020–2030 ($Million)
Table 39.Europe Letter Of Credit Confirmation Market Revenue, By Country, 2020–2030 ($Million)
Table 40.Europe Letter Of Credit Confirmation Market Volume, By Country, 2020–2030 ($Million)
Table 41.Germany Letter Of Credit Confirmation Market Revenue, By L/C Type, 2020–2030 ($Million)
Table 42.Germany Letter Of Credit Confirmation Market Volume, By L/C Type, 2020–2030 ($Million)
Table 43.Germany Letter Of Credit Confirmation Market Revenue, By End User, 2020–2030 ($Million)
Table 44.Germany Letter Of Credit Confirmation Market Volume, By End User, 2020–2030 ($Million)
Table 45.France Letter Of Credit Confirmation Market Revenue, By L/C Type, 2020–2030 ($Million)
Table 46.France Letter Of Credit Confirmation Market Volume, By L/C Type, 2020–2030 ($Million)
Table 47.France Letter Of Credit Confirmation Market Revenue, By End User, 2020–2030 ($Million)
Table 48.France Letter Of Credit Confirmation Market Volume, By End User, 2020–2030 ($Million)
Table 49.Uk Letter Of Credit Confirmation Market Revenue, By L/C Type, 2020–2030 ($Million)
Table 50.Uk Letter Of Credit Confirmation Market Volume, By L/C Type, 2020–2030 ($Million)
Table 51.Uk Letter Of Credit Confirmation Market Revenue, By End User, 2020–2030 ($Million)
Table 52.Uk Letter Of Credit Confirmation Market Volume, By End User, 2020–2030 ($Million)
Table 53.Italy Letter Of Credit Confirmation Market Revenue, By L/C Type, 2020–2030 ($Million)
Table 54.Italy Letter Of Credit Confirmation Market Volume, By L/C Type, 2020–2030 ($Million)
Table 55.Italy Letter Of Credit Confirmation Market Revenue, By End User, 2020–2030 ($Million)
Table 56.Italy Letter Of Credit Confirmation Market Volume, By End User, 2020–2030 ($Million)
Table 57.Spain Letter Of Credit Confirmation Market Revenue, By L/C Type, 2020–2030 ($Million)
Table 58.Spain Letter Of Credit Confirmation Market Volume, By L/C Type, 2020–2030 ($Million)
Table 59.Spain Letter Of Credit Confirmation Market Revenue, By End User, 2020–2030 ($Million)
Table 60.Spain Letter Of Credit Confirmation Market Volume, By End User, 2020–2030 ($Million)
Table 61.Russia Letter Of Credit Confirmation Market Revenue, By L/C Type, 2020–2030 ($Million)
Table 62.Russia Letter Of Credit Confirmation Market Volume, By L/C Type, 2020–2030 ($Million)
Table 63.Russia Letter Of Credit Confirmation Market Revenue, By End User, 2020–2030 ($Million)
Table 64.Russia Letter Of Credit Confirmation Market Volume, By End User, 2020–2030 ($Million)
Table 65.Rest Of Europe Letter Of Credit Confirmation Market Revenue, By L/C Type, 2020–2030 ($Million)
Table 66.Rest Of Europe Letter Of Credit Confirmation Market Volume, By L/C Type, 2020–2030 ($Million)
Table 67.Rest Of Europe Letter Of Credit Confirmation Market Revenue, By End User, 2020–2030 ($Million)
Table 68.Rest Of Europe Letter Of Credit Confirmation Market Volume, By End User, 2020–2030 ($Million)
Table 69.Asia-Pacific Letter Of Credit Confirmation Market Revenue, By L/C Type, 2020–2030 ($Million)
Table 70.Asia-Pacific Letter Of Credit Confirmation Market Volume, By L/C Type, 2020–2030 ($Million)
Table 71.Asia-Pacific Letter Of Credit Confirmation Market Revenue, By End User, 2020–2030 ($Million)
Table 72.Asia-Pacific Letter Of Credit Confirmation Market Volume, By End User, 2020–2030 ($Million)
Table 73.Asia-Pacific Letter Of Credit Confirmation Market Revenue, By Country, 2020–2030 ($Million)
Table 74.Asia-Pacific Letter Of Credit Confirmation Market Volume, By Country, 2020–2030 ($Million)
Table 75.Japan Letter Of Credit Confirmation Market Revenue, By L/C Type, 2020–2030 ($Million)
Table 76.Japan Letter Of Credit Confirmation Market Volume, By L/C Type, 2020–2030 ($Million)
Table 77.Japan Letter Of Credit Confirmation Market Revenue, By End User, 2020–2030 ($Million)
Table 78.Japan Letter Of Credit Confirmation Market Volume, By End User, 2020–2030 ($Million)
Table 79.China Letter Of Credit Confirmation Market Revenue, By L/C Type, 2020–2030 ($Million)
Table 80.China Letter Of Credit Confirmation Market Volume, By L/C Type, 2020–2030 ($Million)
Table 81.China Letter Of Credit Confirmation Market Revenue, By End User, 2020–2030 ($Million)
Table 82.China Letter Of Credit Confirmation Market Volume, By End User, 2020–2030 ($Million)
Table 83.Australia Letter Of Credit Confirmation Market Revenue, By L/C Type, 2020–2030 ($Million)
Table 84.Australia Letter Of Credit Confirmation Market Volume, By L/C Type, 2020–2030 ($Million)
Table 85.Australia Letter Of Credit Confirmation Market Revenue, By End User, 2020–2030 ($Million)
Table 86.Australia Letter Of Credit Confirmation Market Volume, By End User, 2020–2030 ($Million)
Table 87.India Letter Of Credit Confirmation Market Revenue, By L/C Type, 2020–2030 ($Million)
Table 88.India Letter Of Credit Confirmation Market Volume, By L/C Type, 2020–2030 ($Million)
Table 89.India Letter Of Credit Confirmation Market Revenue, By End User, 2020–2030 ($Million)
Table 90.India Letter Of Credit Confirmation Market Volume, By End User, 2020–2030 ($Million)
Table 91.South Korea Letter Of Credit Confirmation Market Revenue, By L/C Type, 2020–2030 ($Million)
Table 92.South Korea Letter Of Credit Confirmation Market Volume, By L/C Type, 2020–2030 ($Million)
Table 93.South Korea Letter Of Credit Confirmation Market Revenue, By End User, 2020–2030 ($Million)
Table 94.South Korea Letter Of Credit Confirmation Market Volume, By End User, 2020–2030 ($Million)
Table 95.Rest Of Asia-Pacific Letter Of Credit Confirmation Market Revenue, By L/C Type, 2020–2030 ($Million)
Table 96.Rest Of Asia-Pacific Letter Of Credit Confirmation Market Volume, By L/C Type, 2020–2030 ($Million)
Table 97.Rest Of Asia-Pacific Letter Of Credit Confirmation Market Revenue, By End User, 2020–2030 ($Million)
Table 98.Rest Of Asia-Pacific Letter Of Credit Confirmation Market Volume, By End User, 2020–2030 ($Million)
Table 99.Lamea Letter Of Credit Confirmation Market Revenue, By L/C Type, 2020–2030 ($Million)
Table 100.Lamea Letter Of Credit Confirmation Market Volume, By L/C Type, 2020–2030 ($Million)
Table 101.Lamea Letter Of Credit Confirmation Market Revenue, By End User, 2020–2030 ($Million)
Table 102.Lamea Letter Of Credit Confirmation Market Volume, By End User, 2020–2030 ($Million)
Table 103.Lamea Letter Of Credit Confirmation Market Revenue, By Country, 2020–2030 ($Million)
Table 104.Lamea Letter Of Credit Confirmation Market Volume, By Country, 2020–2030 ($Million)
Table 105.Brazil Letter Of Credit Confirmation Market Revenue, By L/C Type, 2020–2030 ($Million)
Table 106.Brazil Letter Of Credit Confirmation Market Volume, By L/C Type, 2020–2030 ($Million)
Table 107.Brazil Letter Of Credit Confirmation Market Revenue, By End User, 2020–2030 ($Million)
Table 108.Brazil Letter Of Credit Confirmation Market Volume, By End User, 2020–2030 ($Million)
Table 109.Turkey Letter Of Credit Confirmation Market Revenue, By L/C Type, 2020–2030 ($Million)
Table 110.Turkey Letter Of Credit Confirmation Market Volume, By L/C Type, 2020–2030 ($Million)
Table 111.Turkey Letter Of Credit Confirmation Market Revenue, By End User, 2020–2030 ($Million)
Table 112.Turkey Letter Of Credit Confirmation Market Volume, By End User, 2020–2030 ($Million)
Table 113.Saudi Arabia Letter Of Credit Confirmation Market Revenue, By L/C Type, 2020–2030 ($Million)
Table 114.Saudi Arabia Letter Of Credit Confirmation Market Volume, By L/C Type, 2020–2030 ($Million)
Table 115.Saudi Arabia Letter Of Credit Confirmation Market Revenue, By End User, 2020–2030 ($Million)
Table 116.Saudi Arabia Letter Of Credit Confirmation Market Volume, By End User, 2020–2030 ($Million)
Table 117.South Africa Letter Of Credit Confirmation Market Revenue, By L/C Type, 2020–2030 ($Million)
Table 118.South Africa Letter Of Credit Confirmation Market Volume, By L/C Type, 2020–2030 ($Million)
Table 119.South Africa Letter Of Credit Confirmation Market Revenue, By End User, 2020–2030 ($Million)
Table 120.South Africa Letter Of Credit Confirmation Market Volume, By End User, 2020–2030 ($Million)
Table 121.Rest Of Lamea Letter Of Credit Confirmation Market Revenue, By L/C Type, 2020–2030 ($Million)
Table 122.Rest Of Lamea Letter Of Credit Confirmation Market Volume, By L/C Type, 2020–2030 ($Million)
Table 123.Rest Of Lamea Letter Of Credit Confirmation Market Revenue, By End User, 2020–2030 ($Million)
Table 124.Rest Of Lamea Letter Of Credit Confirmation Market Volume, By End User, 2020–2030 ($Million)
Table 125.Bank Of America Corporation: Key Executives
Table 126.Bank Of America Corporation: Company Snapshot
Table 127.Bank Of America Corporation: Product Portfolio
Table 128.Citigroup, Inc.: Key Executives
Table 129.Citigroup, Inc.: Company Snapshot
Table 130.Citigroup, Inc.: Operating Segments
Table 131.Citigroup, Inc.: Product Portfolio
Table 132.Dbs Bank Ltd.: Key Executives
Table 133.Dbs Bank Ltd.: Company Snapshot
Table 134.Dbs Bank Ltd: Product Portfolio
Table 135.Jpmorgan Chase & Co.: Key Executives
Table 136.Jpmorgan Chase & Co.: Company Snapshot
Table 137.Jpmorgan Chase & Co.: Product Portfolio
Table 138.Mizuho Bank, Ltd.: Key Executives
Table 139.Mizuho Bank, Ltd.: Company Snapshot
Table 140.Mizuho Bank, Ltd.: Product Portfolio
Table 141.Mufg Bank, Ltd.: Key Executives
Table 142.Mufg Bank, Ltd.: Company Snapshot
Table 143.Mufg Bank, Ltd.: Product Portfolio
Table 144.Scotiabank: Key Executives
Table 145.Scotiabank: Company Snapshot
Table 146.Scotiabank: Product Portfolio
Table 147.Scotiabank: Operating Segments
Table 148.Standard Chartered: Key Executives
Table 149.Standard Chartered: Company Snapshot
Table 150.Standard Chartered: Product Portfolio
Table 151.Standard Chartered: Operating Segments
Table 152.Sumitomo Mitsui Banking Corporation: Key Executives
Table 153.Sumitomo Mitsui Banking Corporation: Company Snapshot
Table 154.Sumitomo Mitsui Banking Corporation: Product Portfolio
Table 155.The Pnc Financial Services Group, Inc.: Key Executives
Table 156.The Pnc Financial Services Group, Inc.: Company Snapshot
Table 157.The Pnc Financial Services Group, Inc.: Product Portfolio
List Of Figures
Figure 01.Key Market Segments
Figure 02.Letter Of Credit Confirmation Market Revenue, By Segmentation, 2020–2030
Figure 03.Letter Of Credit Confirmation Market Revenue, By Region, 2020–2030
Figure 04.Letter Of Credit Confirmation Market Volume, By Segmentation 2020–2030
Figure 05.Letter Of Credit Confirmation Market Volume, By Region, 2020–2030
Figure 06.Top Impacting Factors
Figure 07.Low Bargaining Power Of Suppliers
Figure 08.High Bargaining Power Of Buyer
Figure 09.Moderate Threat Of Substitutes
Figure 10.Moderate Threat Of New Entrants
Figure 11.High Competitive Rivalry
Figure 12.Letter Of Credit Confirmation Market Revenue, By L/C Type, 2020–2030
Figure 13.Letter Of Credit Confirmation Market Revenue, By End User, 2020-2030
Figure 14.U.S. Letter Of Credit Confirmation Market Revenue, 2020-2030 ($Million)
Figure 15.U.S. Letter Of Credit Confirmation Market Volume, 2020-2030 ($Million)
Figure 16.Canada Letter Of Credit Confirmation Market Revenue, 2020-2030 ($Million)
Figure 17.Canada Letter Of Credit Confirmation Market Volume, 2020-2030 ($Million)
Figure 18.Mexico Letter Of Credit Confirmation Market Revenue, 2020-2030 ($Million)
Figure 19.Mexico Letter Of Credit Confirmation Market Volume, 2020-2030 ($Million)
Figure 20.Germany Letter Of Credit Confirmation Market Revenue, 2020-2030 ($Million)
Figure 21.Germany Letter Of Credit Confirmation Market Volume, 2020-2030 ($Million)
Figure 22.France Letter Of Credit Confirmation Market Revenue, 2020-2030 ($Million)
Figure 23.France Letter Of Credit Confirmation Market Volume, 2020-2030 ($Million)
Figure 24.Uk Letter Of Credit Confirmation Market Revenue, 2020-2030 ($Million)
Figure 25.Uk Letter Of Credit Confirmation Market Volume, 2020-2030 ($Million)
Figure 26.Italy Letter Of Credit Confirmation Market Revenue, 2020-2030 ($Million)
Figure 27.Italy Letter Of Credit Confirmation Market Volume, 2020-2030 ($Million)
Figure 28.Spain Letter Of Credit Confirmation Market Revenue, 2020-2030 ($Million)
Figure 29.Spain Letter Of Credit Confirmation Market Volume, 2020-2030 ($Million)
Figure 30.Russia Letter Of Credit Confirmation Market Revenue, 2020-2030 ($Million)
Figure 31.Russia Letter Of Credit Confirmation Market Volume, 2020-2030 ($Million)
Figure 32.Rest Of Europe Letter Of Credit Confirmation Market Revenue, 2020-2030 ($Million)
Figure 33.Rest Of Europe Letter Of Credit Confirmation Market Volume, 2020-2030 ($Million)
Figure 34.Japan Letter Of Credit Confirmation Market Revenue, 2020-2030 ($Million)
Figure 35.Japan Letter Of Credit Confirmation Market Volume, 2020-2030 ($Million)
Figure 36.China Letter Of Credit Confirmation Market Revenue, 2020-2030 ($Million)
Figure 37.China Letter Of Credit Confirmation Market Volume, 2020-2030 ($Million)
Figure 38.Australia Letter Of Credit Confirmation Market Revenue, 2020-2030 ($Million)
Figure 39.Australia Letter Of Credit Confirmation Market Volume, 2020-2030 ($Million)
Figure 40.India Letter Of Credit Confirmation Market Revenue, 2020-2030 ($Million)
Figure 41.India Letter Of Credit Confirmation Market Volume, 2020-2030 ($Million)
Figure 42.South Korea Letter Of Credit Confirmation Market Revenue, 2020-2030 ($Million)
Figure 43.South Korea Letter Of Credit Confirmation Market Volume, 2020-2030 ($Million)
Figure 44.Rest Of Asia-Pacific Letter Of Credit Confirmation Market Revenue, 2020-2030 ($Million)
Figure 45.Rest Of Asia-Pacific Letter Of Credit Confirmation Market Volume, 2020-2030 ($Million)
Figure 46.Brazil Letter Of Credit Confirmation Market Revenue, 2020-2030 ($Million)
Figure 47.Brazil Letter Of Credit Confirmation Market Volume, 2020-2030 ($Million)
Figure 48.Turkey Letter Of Credit Confirmation Market Revenue, 2020-2030 ($Million)
Figure 49.Turkey Letter Of Credit Confirmation Market Volume, 2020-2030 ($Million)
Figure 50.Saudi Arabia Letter Of Credit Confirmation Market Revenue, 2020-2030 ($Million)
Figure 51.Saudi Arabia Letter Of Credit Confirmation Market Volume, 2020-2030 ($Million)
Figure 52.South Africa Letter Of Credit Confirmation Market Revenue, 2020-2030 ($Million)
Figure 53.South Africa Letter Of Credit Confirmation Market Volume, 2020-2030 ($Million)
Figure 54.Rest Of Lamea Letter Of Credit Confirmation Market Revenue, 2020-2030 ($Million)
Figure 55.Rest Of Lamea Letter Of Credit Confirmation Market Volume, 2020-2030 ($Million)
Figure 56.Bank Of America Corporation: Net Revenue, 2018–2020 ($Million)
Figure 57.Bank Of America Corporation: Revenue Share By Countries (2020)
Figure 58.Citigroup, Inc.: Net Revenue, 2018–2020 ($Million)
Figure 59.Dbs Bank Ltd.: Net Income, 2018–2020 ($Million)
Figure 60.Dbs Bank Ltd.: Net Income Share By Segment, 2020 (%)
Figure 61.Dbs Bank Ltd.: Net Income Share By Region, 2020 (%)
Figure 62.Jpmorgan Chase & Co.: Net Revenue, 2018–2020 ($Million)
Figure 63.Jpmorgan Chase & Co.: Revenue Share By Region, 2020 (%)
Figure 64.Mizuho Bank, Ltd.: Net Revenue, 2018–2020 ($Million)
Figure 65.Scotiabank: Net Revenue, 2018–2020 ($Million)
Figure 66.Scotiabank: Revenue Share By Segment (2020)
Figure 67.Standard Chartered: Net Sales, 2018–2020 ($Million)
Figure 68.Standard Chartered: Revenue Share By Segment, 2020 (%)
Figure 69.Standard Chartered: Revenue Share By Region, 2020 (%)
Figure 70.The Pnc Financial Services Group, Inc.: Net Revenue, 2018–2020 ($Million)
$6169
$10665
HAVE A QUERY?
OUR CUSTOMER

SIMILAR REPORTS