
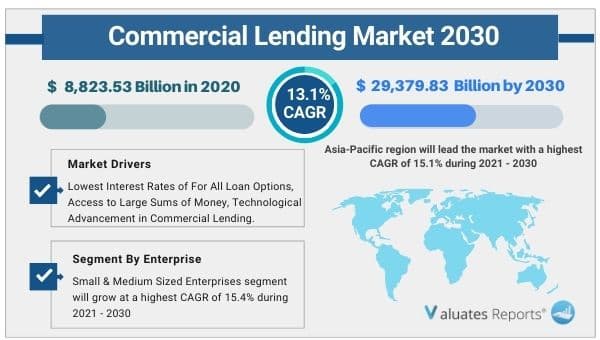
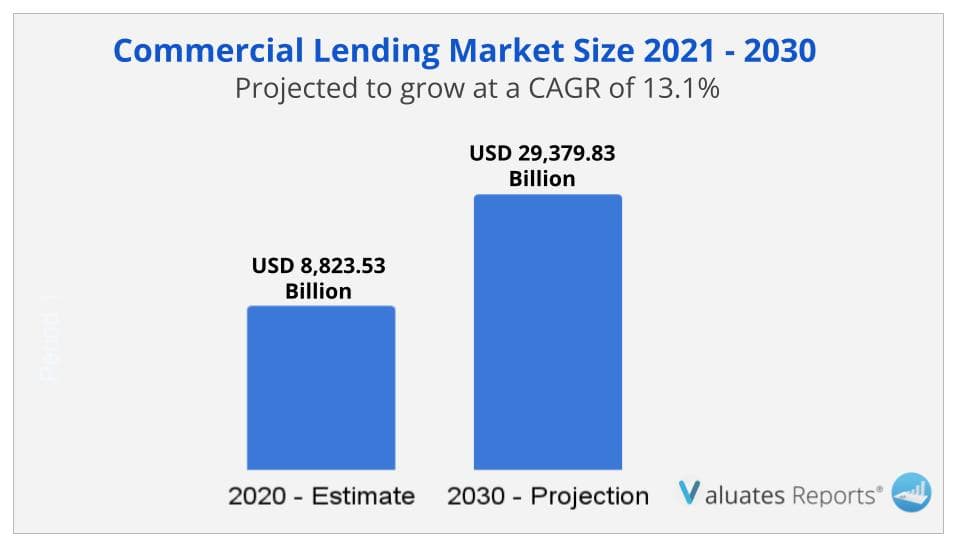
The commercial lending market size was valued at USD 8,823.53 Billion in 2020, and is projected to reach USD 29,379.83 Billion by 2030, growing at a CAGR of 13.1% from 2021 to 2030. Key drivers of the commercial lending market include lower interest rates for all loan options enabling more businesses to take loans. In addition to it, benefits like faster processing and access to large sums of money will bolster the growth of the commercial lending market during the forecast period.
Moreover, rapid technological advancements in the commercial lending sector will boost market growth in the coming years. The covid-19 impact has surged the growth of the commercial lending market and will accelerate further in the coming years.
Lower interest rate facility
Interest rates are very low on all commercial loan options. This allows business owners to gain access to critical funding at lower overhead costs. Further, the facility of fixed monthly repayment and payment options extending over a number of years enables owners to provide proper structure, certainty and give attention to other important business areas such as sales, training staff, overhead expenses, etc. Thus low-interest rates provide more access to funding thereby giving a boost to the growth of the commercial lending market during the forecast period.
Faster processing and access to large sums of money
Commercial lending provides faster processing and access to additional capital for running the day-to-day operations of the business. The extra cash can be used for buying new pieces of equipment, managing payroll expenses, etc. Small business owners may find it intimidating to raise money through equity or debt markets as it is covered with many risks. The easy consolidation of financing in one loan enables business owners to get access to substantial funding which directly aids in the business starting process. Also, the easy application process acts as an additional booster to market growth. Thus benefits such as faster processing and access to large sums of money will drive the growth of the commercial lending market during the forecast period.
Rapid technological advancements
The rapid technological advancements in the commercial lending sector will significantly boost market growth in the coming years. Artificial intelligence and robotic automation strategies are reinventing the entire lending process. These technologies enable commercial lenders to have a better picture of customers’ credit qualifications to make intelligent loan recommendations within minutes. In addition to it, activities such as processing, documentation, payment, verification, etc are all automated leading to enhanced customer experience. Thus rapid technological advancements will bolster the growth of the commercial lending market in the coming years.
Based on region, the Asia Pacific segment is expected to provide lucrative opportunities for growth in the commercial lending market share and will grow at a CAGR of 15.1% during the forecast period as traditional lenders are providing more commercial lending options, growing penetration of internet and smartphones and commercial lending trends among retailers, merchants, restaurants in the region.
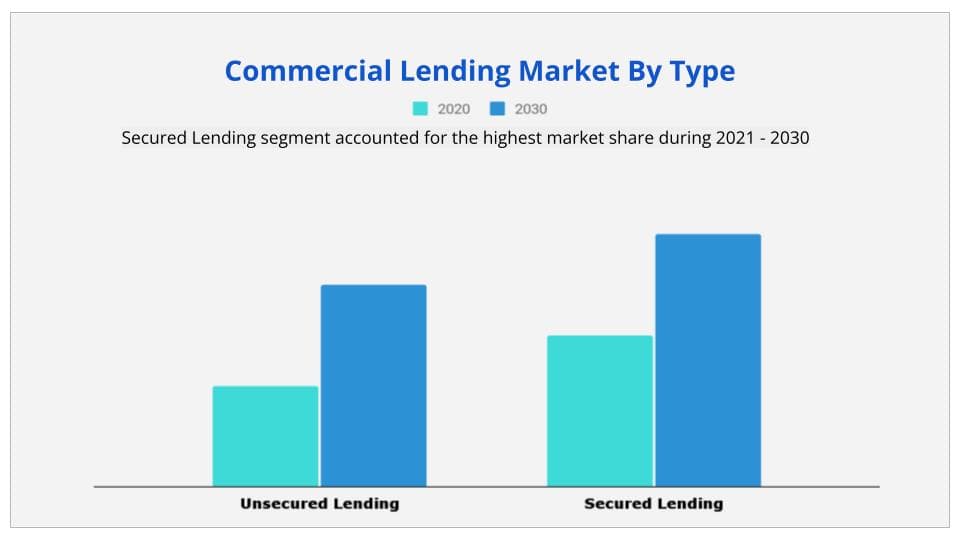
Based on type, the secured lending segment is expected to provide lucrative opportunities for growth in the commercial lending market share due to low-interest rates, high borrowing limits, and more repayment options.
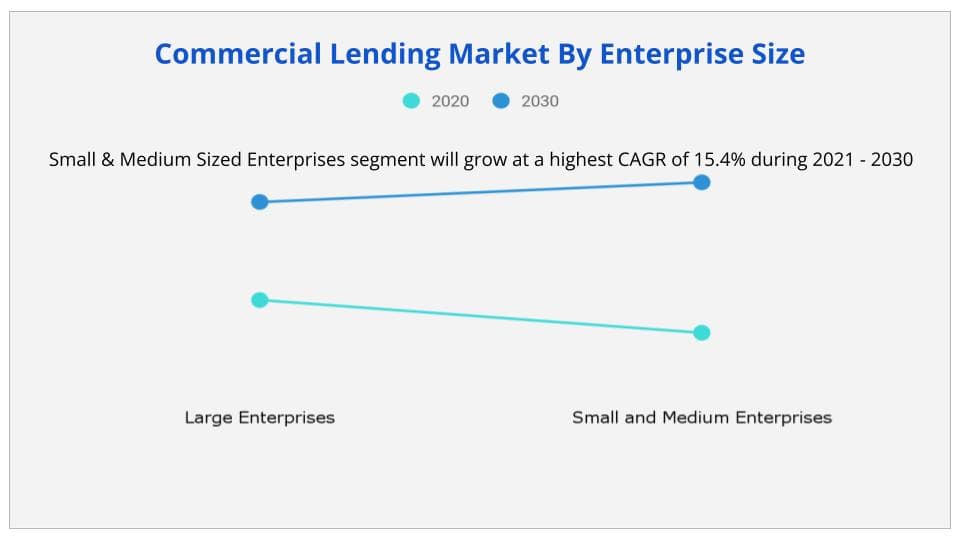
Based on enterprise size, the small and medium-sized enterprises are expected to provide lucrative opportunities for growth in the commercial lending market share and will grow at a CAGR of 15.4% during 2021-2030.
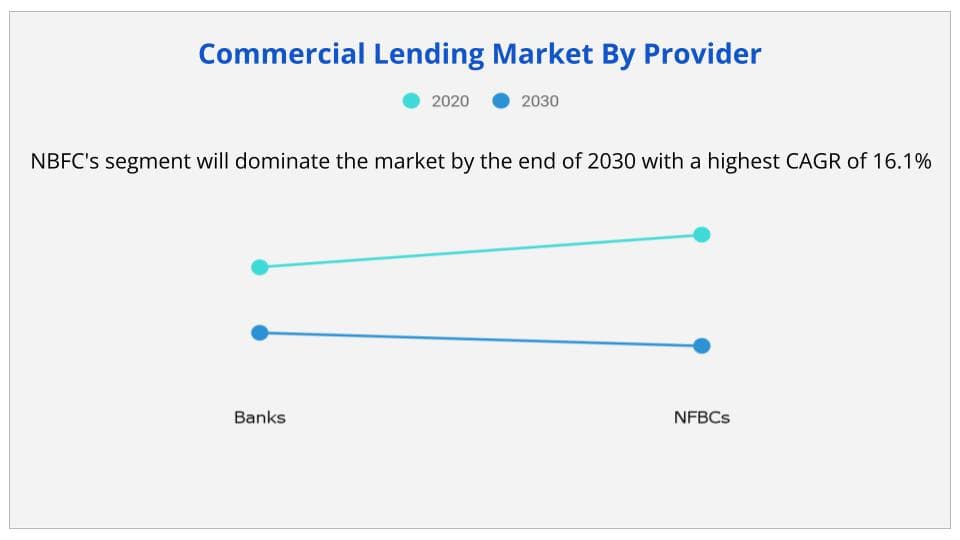
Based on provider, the NBFCs segment is expected to provide lucrative opportunities for growth in the commercial lending market share and will grow at a CAGR of 16.1% during the forecast period.
|
Report Metric |
Details |
|
Report Name |
Commercial Lending Market |
|
Market size value in 2020 |
USD 8,823.53 Billion |
|
Revenue forecast in 2030 |
USD 29,379.83 Billion |
|
Growth Rate |
CAGR 13.1% |
|
Base year considered |
2020 |
|
Forecast Period |
2021-2030 |
|
By Type |
Unsecured Lending and Secured Lending |
|
By Enterprise Size |
Large Enterprises and Small & Medium Sized Enterprises |
|
By Provider |
Banks and NBFCs |
|
Segments Covered |
By Type, By Enterprise Size, By Provider |
|
Report Coverage |
Revenue & volume forecast, company share, competitive landscape, growth factors, and trends |
Ans. The commercial lending market size was valued at $8,823.53 billion in 2020, and is projected to reach $29,379.83 billion by 2030, growing at a CAGR of 13.1% from 2021 to 2030.
Ans. The key players operating in the commercial lending market include American Express Company, Credit Suisse, Fundation Group LLC, Fundbox, Funding Circle, Goldman Sachs, Kabbage, LoanBuilder, Merchant Capital and OnDeck.
Ans. Yes, the report includes a COVID-19 impact analysis. Also, it is further extended into every individual segment of the report.
Ans. Asia-Pacific region will lead the market with a highest CAGR of 15.1% during 2021 - 2030
Ans. NBFC's segment will dominate the market by the end of 2030 with a highest CAGR of 16.1%.
CHAPTER 1:INTRODUCTION
1.1.Report description
1.2.Key benefits for stakeholders
1.3.Key market segments
1.4.Research methodology
1.4.1.Secondary research
1.4.2.Primary research
1.4.3.Analyst tools and models
CHAPTER 2:EXECUTIVE SUMMARY
2.1.Key findings
2.1.1.Top impacting factors
2.1.2.Top investment pockets
2.2.CXO perspective
CHAPTER 3:MARKET OVERVIEW
3.1.Market definition and scope
3.2.Key forces shaping global commercial lending market
3.3.Market dynamics
3.3.1.Drivers
3.3.1.1.Lowest interest rates of all loan options
3.3.1.2.Shorter loan application processes
3.3.1.3.Access to large sums of money
3.3.2.Restraints
3.3.2.1.Stringent qualifying criteria
3.3.2.2.Strict repayment schedule
3.3.3.Opportunities
3.3.3.1.Technological advancements in the commercial lending
3.4.COVID-19 impact analysis on connected enterprise market
3.4.1.Impact on commercial lending market size
3.4.2.Change in consumer trends, preferences, and budget impact, owing to COVID-19
3.4.3.Framework for market challenges faced by commercial lending providers
3.4.4.Economic impact on commercial lending providers
3.4.5.Key player strategies to tackle negative impact on the industry
3.4.6.Opportunity analysis for commercial lending providers
CHAPTER 4:COMMERCIAL LENDING MARKET, BY TYPE
4.1.Overview
4.2.Unsecured Lending
4.2.1.Key market trends, growth factors, and opportunities
4.2.2.Market size and forecast, by region
4.2.3.Market analysis, by country
4.3.Secured lending
4.3.1.Key market trends, growth factors, and opportunities
4.3.2.Market size and forecast, by region
4.3.3.Market analysis, by country
CHAPTER 5:COMMERCIAL LENDING MARKET, BY ENTERPRISE SIZE
5.1.Overview
5.2.Large Enterprises
5.2.1.Key market trends, growth factors, and opportunities
5.2.2.Market size and forecast, by region
5.2.3.Market analysis, by country
5.3.Small & medium sized enterprises
5.3.1.Key market trends, growth factors, and opportunities
5.3.2.Market size and forecast, by region
5.3.3.Market analysis, by country
CHAPTER 6:COMMERCIAL LENDING MARKET, BY PROVIDER
6.1.Overview
6.2.Banks
6.2.1.Key market trends, growth factors, and opportunities
6.2.2.Market size and forecast, by region
6.2.3.Market analysis, by country
6.3.NBFCs
6.3.1.Key market trends, growth factors, and opportunities
6.3.2.Market size and forecast, by region
6.3.3.Market analysis, by country
CHAPTER 7:COMMERCIAL LENDING MARKET, BY REGION
7.1.Overview
7.1.1.Market size and forecast
7.2.North America
7.2.1.Key market trends, growth factors, and opportunities
7.2.2.Market size and forecast, by type
7.2.4.Market size and forecast, by enterprise size
7.2.5.Market size and forecast, by provider
7.2.6.Market analysis, by country
7.2.6.1.U.S.
7.2.6.1.1.Market size and forecast, by type
7.2.6.1.2.Market size and forecast, by enterprise size
7.2.6.1.3.Market size and forecast, by provider
7.2.6.2.Canada
7.2.6.2.1.Market size and forecast, by type
7.2.6.2.2.Market size and forecast, by enterprise size
7.2.6.2.3.Market size and forecast, by provider
7.3.Europe
7.3.1.Key market trends, growth factors, and opportunities
7.3.2.Market size and forecast, by type
7.3.4.Market size and forecast, by enterprise size
7.3.5.Market size and forecast, by provider
7.3.6.Market analysis, by country
7.3.6.1.UK
7.3.6.1.1.Market size and forecast, by type
7.3.6.1.2.Market size and forecast, by enterprise size
7.3.6.1.3.Market size and forecast, by provider
7.3.6.2.Germany
7.3.6.2.1.Market size and forecast, by type
7.3.6.2.2.Market size and forecast, by enterprise size
7.3.6.2.3.Market size and forecast, by provider
7.3.6.3.France
7.3.6.3.1.Market size and forecast, by type
7.3.6.3.2.Market size and forecast, by enterprise size
7.3.6.3.3.Market size and forecast, by provider
7.3.6.4.Italy
7.3.6.4.1.Market size and forecast, by type
7.3.6.4.2.Market size and forecast, by enterprise size
7.3.6.4.3.Market size and forecast, by provider
7.3.6.5.Spain
7.3.6.5.1.Market size and forecast, by type
7.3.6.5.2.Market size and forecast, by enterprise size
7.3.6.5.3.Market size and forecast, by provider
7.3.6.6.Rest of Europe
7.3.6.6.1.Market size and forecast, by type
7.3.6.6.2.Market size and forecast, by enterprise size
7.3.6.6.3.Market size and forecast, by provider
7.4.Asia-Pacific
7.4.1.Key market trends, growth factors, and opportunities
7.4.2.Market size and forecast, by type
7.4.4.Market size and forecast, by enterprise size
7.4.5.Market size and forecast, by provider
7.4.6.Market analysis, by country
7.4.6.1.China
7.4.6.1.1.Market size and forecast, by type
7.4.6.1.2.Market size and forecast, by enterprise size
7.4.6.1.3.Market size and forecast, by provider
7.4.6.2.Japan
7.4.6.2.1.Market size and forecast, by type
7.4.6.2.2.Market size and forecast, by enterprise size
7.4.6.2.3.Market size and forecast, by provider
7.4.6.3.India
7.4.6.3.1.Market size and forecast, by type
7.4.6.3.2.Market size and forecast, by enterprise size
7.4.6.3.3.Market size and forecast, by provider
7.4.6.4.Australia
7.4.6.4.1.Market size and forecast, by type
7.4.6.4.2.Market size and forecast, by enterprise size
7.4.6.4.3.Market size and forecast, by provider
7.4.6.5.South Korea
7.4.6.5.1.Market size and forecast, by type
7.4.6.5.2.Market size and forecast, by enterprise size
7.4.6.5.3.Market size and forecast, by provider
7.4.6.6.Rest of Asia-Pacific
7.4.6.6.1.Market size and forecast, by type
7.4.6.6.2.Market size and forecast, by enterprise size
7.4.6.6.3.Market size and forecast, by provider
7.5.LAMEA
7.5.1.Key market trends, growth factors, and opportunities
7.5.2.Market size and forecast, by type
7.5.4.Market size and forecast, by enterprise size
7.5.5.Market size and forecast, by provider
7.5.6.Market analysis, by country
7.5.6.1.Latin America
7.5.6.1.1.Market size and forecast, by type
7.5.6.1.2.Market size and forecast, by enterprise size
7.5.6.1.3.Market size and forecast, by provider
7.5.6.2.Middle East
7.5.6.2.1.Market size and forecast, by type
7.5.6.2.2.Market size and forecast, by enterprise size
7.5.6.2.3.Market size and forecast, by provider
7.5.6.3.Africa
7.5.6.3.1.Market size and forecast, by type
7.5.6.3.2.Market size and forecast, by enterprise size
7.5.6.3.3.Market size and forecast, by provider
CHAPTER 8:COMPETITIVE LANDSCAPE
8.1.Introduction
8.1.1.Market player positioning, 2020
8.2.Competitive dashboard
8.2.1.Top winning strategies
CHAPTER 9:COMPANY PROFILES
9.1.American Express Company
9.1.1.Company overview
9.1.2.Company snapshot
9.1.3.Operating business segments
9.1.4.Product portfolio
9.1.5.Business performance
9.1.6.Key strategic moves and developments
9.2.CREDIT SUISSE GROUP AG
9.2.1.Company overview
9.2.2.Company snapshot
9.2.3.Operating business segments
9.2.4.Product portfolio
9.2.5.Business performance
9.3.Fundation Group LLC
9.3.1.Company overview
9.3.2.Company snapshot
9.3.3.Product portfolio
9.3.4.Key strategic moves and developments
9.4.Fundbox
9.4.1.Company overview
9.4.2.Company snapshot
9.4.3.Product portfolio
9.5.Funding Circle
9.5.1.Company overview
9.5.2.Company snapshot
9.5.3.Product portfolio
9.5.4.Key strategic moves and developments
9.6.GOLDMAN SACHS
9.6.1.Company overview
9.6.2.Company snapshot
9.6.3.Product portfolio
9.6.4.Business performance
9.7.KABBAGE FUNDING
9.7.1.Company overview
9.7.2.Company snapshot
9.7.3.Product portfolio
9.7.4.Key strategic moves and developments
9.8.LoanBuilder
9.8.1.Company overview
9.8.2.Company snapshot
9.8.3.Product portfolio
9.9.MERCHANT CAPITAL
9.9.1.Company overview
9.9.2.Company snapshot
9.9.3.Product portfolio
9.10.OnDeck
9.10.1.Company overview
9.10.2.Company snapshot
9.10.3.Product portfolio
9.10.4.Key strategic moves and developments
LIST OF TABLES
TABLE 01.COMMERCIAL LENDING MARKET, BY TYPE, 2020-2030 ($BILLION)
TABLE 02.COMMERCIAL LENDING MARKET REVENUE FOR UNSECURED LENDING, BY REGION, 2020-2030 ($BILLION)
TABLE 03.COMMERCIAL LENDING MARKET FOR SECURED LENDING, BY REGION, 2020-2030 ($BILLION)
TABLE 04.COMMERCIAL LENDING MARKET, BY ENTERPRISE SIZE, 2020-2030 ($BILLION)
TABLE 05.COMMERCIAL LENDING MARKET REVENUE FOR LARGE ENTERPRISES, BY REGION, 2020-2030 ($BILLION)
TABLE 06.COMMERCIAL LENDING MARKET FOR SMALL AND MEDIUM SIZED ENTERPRISES, BY REGION, 2020-2030 ($BILLION)
TABLE 07.COMMERCIAL LENDING MARKET, BY PROVIDER, 2020-2030 ($BILLION)
TABLE 08.COMMERCIAL LENDING MARKET REVENUE FOR BANKS, BY REGION, 2020-2030 ($BILLION)
TABLE 09.COMMERCIAL LENDING MARKET FOR NBFCS, BY REGION, 2020-2030 ($BILLION)
TABLE 10.COMMERCIAL LENDING MARKET, BY REGION, 2020-2030 ($BILLION)
TABLE 11.NORTH AMERICA COMMERCIAL LENDING MARKET, BY TYPE, 2020–2030 ($BILLION)
TABLE 12.NORTH AMERICA COMMERCIAL LENDING MARKET, BY ENTERPRISE SIZE, 2020–2030 ($BILLION)
TABLE 13.NORTH AMERICA COMMERCIAL LENDING MARKET, BY PROVIDER, 2020–2030 ($BILLION)
TABLE 14.NORTH AMERICA COMMERCIAL LENDING MARKET REVENUE, BY COUNTRY, 2020–2030 ($BILLION)
TABLE 15.U.S. COMMERCIAL LENDING MARKET REVENUE, BY TYPE, 2020–2030 ($BILLION)
TABLE 16.U.S. COMMERCIAL LENDING MARKET, BY ENTERPRISE SIZE, 2020–2030 ($BILLION)
TABLE 17.U.S. COMMERCIAL LENDING MARKET REVENUE, BY PROVIDER, 2020–2030 ($BILLION)
TABLE 18.CANADA COMMERCIAL LENDING MARKET REVENUE, BY TYPE, 2020–2030 ($BILLION)
TABLE 19.CANADA COMMERCIAL LENDING MARKET, BY ENTERPRISE SIZE, 2020–2030 ($BILLION)
TABLE 20.CANADA COMMERCIAL LENDING MARKET REVENUE, BY PROVIDER, 2020–2030 ($BILLION)
TABLE 21.EUROPE COMMERCIAL LENDING MARKET, BY TYPE, 2020–2030 ($BILLION)
TABLE 22.EUROPE COMMERCIAL LENDING MARKET, BY ENTERPRISE SIZE, 2020–2030 ($BILLION)
TABLE 23.EUROPE COMMERCIAL LENDING MARKET, BY PROVIDER, 2020–2030 ($BILLION)
TABLE 24.EUROPE COMMERCIAL LENDING MARKET REVENUE, BY COUNTRY, 2020–2030 ($BILLION)
TABLE 25.UK COMMERCIAL LENDING MARKET REVENUE, BY TYPE, 2020–2030 ($BILLION)
TABLE 26.UK COMMERCIAL LENDING MARKET, BY ENTERPRISE SIZE, 2020–2030 ($BILLION)
TABLE 27.UK COMMERCIAL LENDING MARKET REVENUE, BY PROVIDER, 2020–2030 ($BILLION)
TABLE 28.GERMANY COMMERCIAL LENDING MARKET REVENUE, BY TYPE, 2020–2030 ($BILLION)
TABLE 29.GERMANY COMMERCIAL LENDING MARKET, BY ENTERPRISE SIZE, 2020–2030 ($BILLION)
TABLE 30.GERMANY COMMERCIAL LENDING MARKET REVENUE, BY PROVIDER, 2020–2030 ($BILLION)
TABLE 31.FRANCE COMMERCIAL LENDING MARKET REVENUE, BY TYPE, 2020–2030 ($BILLION)
TABLE 32.FRANCE COMMERCIAL LENDING MARKET, BY ENTERPRISE SIZE, 2020–2030 ($BILLION)
TABLE 33.FRANCE COMMERCIAL LENDING MARKET REVENUE, BY PROVIDER, 2020–2030 ($BILLION)
TABLE 34.ITALY COMMERCIAL LENDING MARKET REVENUE, BY TYPE, 2020–2030 ($BILLION)
TABLE 35.ITALY COMMERCIAL LENDING MARKET, BY ENTERPRISE SIZE, 2020–2030 ($BILLION)
TABLE 36.ITALY COMMERCIAL LENDING MARKET REVENUE, BY PROVIDER, 2020–2030 ($BILLION)
TABLE 37.SPAIN COMMERCIAL LENDING MARKET REVENUE, BY TYPE, 2020–2030 ($BILLION)
TABLE 38.SPAIN COMMERCIAL LENDING MARKET, BY ENTERPRISE SIZE, 2020–2030 ($BILLION)
TABLE 39.SPAIN COMMERCIAL LENDING MARKET REVENUE, BY PROVIDER, 2020–2030 ($BILLION)
TABLE 40.REST OF EUROPE COMMERCIAL LENDING MARKET REVENUE, BY TYPE, 2020–2030 ($BILLION)
TABLE 41.REST OF EUROPE COMMERCIAL LENDING MARKET, BY ENTERPRISE SIZE, 2020–2030 ($BILLION)
TABLE 42.REST OF EUROPE COMMERCIAL LENDING MARKET REVENUE, BY PROVIDER, 2020–2030 ($BILLION)
TABLE 43.ASIA-PACIFIC COMMERCIAL LENDING MARKET, BY TYPE, 2020–2030 ($BILLION)
TABLE 44.ASIA-PACIFIC COMMERCIAL LENDING MARKET, BY ENTERPRISE SIZE, 2020–2030 ($BILLION)
TABLE 45.ASIA-PACIFIC COMMERCIAL LENDING MARKET, BY PROVIDER, 2020–2030 ($BILLION)
TABLE 46.ASIA-PACIFIC COMMERCIAL LENDING MARKET REVENUE, BY COUNTRY, 2020–2030 ($BILLION)
TABLE 47.CHINA COMMERCIAL LENDING MARKET REVENUE, BY TYPE, 2020–2030 ($BILLION)
TABLE 48.CHINA COMMERCIAL LENDING MARKET, BY ENTERPRISE SIZE, 2020–2030 ($BILLION)
TABLE 49.CHINA COMMERCIAL LENDING MARKET REVENUE, BY PROVIDER, 2020–2030 ($BILLION)
TABLE 50.JAPAN COMMERCIAL LENDING MARKET REVENUE, BY TYPE, 2020–2030 ($BILLION)
TABLE 51.JAPAN COMMERCIAL LENDING MARKET, BY ENTERPRISE SIZE, 2020–2030 ($BILLION)
TABLE 52.JAPAN COMMERCIAL LENDING MARKET REVENUE, BY PROVIDER, 2020–2030 ($BILLION)
TABLE 53.INDIA COMMERCIAL LENDING MARKET REVENUE, BY TYPE, 2020–2030 ($BILLION)
TABLE 54.INDIA COMMERCIAL LENDING MARKET, BY ENTERPRISE SIZE, 2020–2030 ($BILLION)
TABLE 55.INDIA COMMERCIAL LENDING MARKET REVENUE, BY PROVIDER, 2020–2030 ($BILLION)
TABLE 56.AUSTRALIA COMMERCIAL LENDING MARKET REVENUE, BY TYPE, 2020–2030 ($BILLION)
TABLE 57.AUSTRALIA COMMERCIAL LENDING MARKET, BY ENTERPRISE SIZE, 2020–2030 ($BILLION)
TABLE 58.AUSTRALIA COMMERCIAL LENDING MARKET REVENUE, BY PROVIDER, 2020–2030 ($BILLION)
TABLE 59.SOUTH KOREA COMMERCIAL LENDING MARKET REVENUE, BY TYPE, 2020–2030 ($BILLION)
TABLE 60.SOUTH KOREA COMMERCIAL LENDING MARKET, BY ENTERPRISE SIZE, 2020–2030 ($BILLION)
TABLE 61.SOUTH KOREA COMMERCIAL LENDING MARKET REVENUE, BY PROVIDER, 2020–2030 ($BILLION)
TABLE 62.REST OF ASIA-PACIFIC COMMERCIAL LENDING MARKET REVENUE, BY TYPE, 2020–2030 ($BILLION)
TABLE 63.REST OF ASIA-PACIFIC COMMERCIAL LENDING MARKET, BY ENTERPRISE SIZE, 2020–2030 ($BILLION)
TABLE 64.REST OF ASIA-PACIFIC COMMERCIAL LENDING MARKET REVENUE, BY PROVIDER, 2020–2030 ($BILLION)
TABLE 65.LAMEA COMMERCIAL LENDING MARKET, BY TYPE, 2020–2030 ($BILLION)
TABLE 66.LAMEA COMMERCIAL LENDING MARKET, BY ENTERPRISE SIZE, 2020–2030 ($BILLION)
TABLE 67.LAMEA COMMERCIAL LENDING MARKET, BY PROVIDER, 2020–2030 ($BILLION)
TABLE 68.LAMEA COMMERCIAL LENDING MARKET REVENUE, BY COUNTRY, 2020–2030 ($BILLION)
TABLE 69.LATIN AMERICA COMMERCIAL LENDING MARKET REVENUE, BY TYPE, 2020–2030 ($BILLION)
TABLE 70.LATIN AMERICA COMMERCIAL LENDING MARKET, BY ENTERPRISE SIZE, 2020–2030 ($BILLION)
TABLE 71.LATIN AMERICA COMMERCIAL LENDING MARKET REVENUE, BY PROVIDER, 2020–2030 ($BILLION)
TABLE 72.MIDDLE EAST COMMERCIAL LENDING MARKET REVENUE, BY TYPE, 2020–2030 ($BILLION)
TABLE 73.MIDDLE EAST COMMERCIAL LENDING MARKET, BY ENTERPRISE SIZE, 2020–2030 ($BILLION)
TABLE 74.MIDDLE EAST COMMERCIAL LENDING MARKET REVENUE, BY PROVIDER, 2020–2030 ($BILLION)
TABLE 75.AFRICA COMMERCIAL LENDING MARKET REVENUE, BY TYPE, 2020–2030 ($BILLION)
TABLE 76.AFRICA COMMERCIAL LENDING MARKET, BY ENTERPRISE SIZE, 2020–2030 ($BILLION)
TABLE 77.AFRICA COMMERCIAL LENDING MARKET REVENUE, BY PROVIDER, 2020–2030 ($BILLION)
TABLE 78.AMERICAN EXPRESS COMPANY: COMPANY SNAPSHOT
TABLE 79.AMERICAN EXPRESS COMPANY: OPERATING SEGMENTS
TABLE 80.AMERICAN EXPRESS COMPANY: PRODUCT PORTFOLIO
TABLE 81.CREDIT SUISSE GROUP AG: COMPANY SNAPSHOT
TABLE 82.CREDIT SUISSE GROUP AG: OPERATING SEGMENTS
TABLE 83.CREDIT SUISSE GROUP AG: PRODUCT PORTFOLIO
TABLE 84.FUNDATION GROUP LLC: COMPANY SNAPSHOT
TABLE 85.FUNDATION GROUP LLC: PRODUCT PORTFOLIO
TABLE 86.FUNDBOX: COMPANY SNAPSHOT
TABLE 87.FUNDBOX: PRODUCT PORTFOLIO
TABLE 88.FUNDING CIRCLE: COMPANY SNAPSHOT
TABLE 89.FUNDING CIRCLE: PRODUCT PORTFOLIO
TABLE 90.GOLDMAN SACHS: COMPANY SNAPSHOT
TABLE 91.GOLDMAN SACHS: PRODUCT PORTFOLIO
TABLE 92.KABBAGE FUNDING: COMPANY SNAPSHOT
TABLE 93.KABBAGE FUNDING: PRODUCT PORTFOLIO
TABLE 94.LOANBUILDER: COMPANY SNAPSHOT
TABLE 95.LOANBUILDER: PRODUCT PORTFOLIO
TABLE 96.MERCHANT CAPITAL: COMPANY SNAPSHOT
TABLE 97.MERCHANT CAPITAL: PRODUCT PORTFOLIO
TABLE 98.ONDECK: COMPANY SNAPSHOT
TABLE 99.ONDECK: PRODUCT PORTFOLIO
LIST OF FIGURES
FIGURE 01.KEY MARKET SEGMENTS
FIGURE 02.COMMERCIAL LENDING MARKET SNAPSHOT, BY SEGMENTATION, 2021–2030
FIGURE 03.COMMERCIAL LENDING MARKET SNAPSHOT, BY REGION, 2021–2030
FIGURE 04.COMMERCIAL LENDING MARKET: TOP IMPACTING FACTOR
FIGURE 05.TOP INVESTMENT POCKETS
FIGURE 06.MODERATE BARGAINING POWER OF SUPPLIERS
FIGURE 07.MODERATELY HIGH BARGAINING POWER OF BUYER
FIGURE 08.MODERATE THREAT OF SUBSTITUTES
FIGURE 09.MODERATELY HIGH THREAT OF NEW ENTRANTS
FIGURE 10.HIGH COMPETITIVE RIVALRY
FIGURE 11.MARKET DYNAMICS: COMMERCIAL LENDING MARKET
FIGURE 12.COMMERCIAL LENDING MARKET, BY TYPE, 2020-2030
FIGURE 13.COMPARATIVE COUNTRY ANALYSIS OF COMMERCIAL LENDING MARKET FOR UNSECURED LENDING, 2020 & 2030 (%)
FIGURE 14.COMPARATIVE COUNTRY ANALYSIS OF COMMERCIAL LENDING MARKET FOR SECURED LENDING, 2020 & 2030 (%)
FIGURE 15.COMMERCIAL LENDING MARKET, BY ENTERPRISE SIZE, 2020-2030
FIGURE 16.COMPARATIVE COUNTRY ANALYSIS OF COMMERCIAL LENDING MARKET FOR LARGE ENTERPRISES, 2020 & 2030 (%)
FIGURE 17.COMPARATIVE COUNTRY ANALYSIS OF COMMERCIAL LENDING MARKET FOR SMALL & MEDIUM SIZED ENTERPRISES, 2020 & 2030 (%)
FIGURE 18.COMMERCIAL LENDING MARKET, BY PROVIDER, 2020-2030
FIGURE 19.COMPARATIVE COUNTRY ANALYSIS OF COMMERCIAL LENDING MARKET FOR BANKS, 2020 & 2030 (%)
FIGURE 20.COMPARATIVE COUNTRY ANALYSIS OF COMMERCIAL LENDING MARKET FOR NBFCS, 2020 & 2030 (%)
FIGURE 21.U.S. COMMERCIAL LENDING MARKET REVENUE, 2020–2030 ($BILLION)
FIGURE 22.CANADA COMMERCIAL LENDING MARKET REVENUE, 2020–2030 ($BILLION)
FIGURE 23.UK COMMERCIAL LENDING MARKET REVENUE, 2020–2030 ($BILLION)
FIGURE 24.GERMANY COMMERCIAL LENDING MARKET REVENUE, 2020–2030 ($BILLION)
FIGURE 25.FRANCE COMMERCIAL LENDING MARKET REVENUE, 2020–2030 ($BILLION)
FIGURE 26.ITALY COMMERCIAL LENDING MARKET REVENUE, 2020–2030 ($BILLION)
FIGURE 27.SPAIN COMMERCIAL LENDING MARKET REVENUE, 2020–2030 ($BILLION)
FIGURE 28.REST OF EUROPE COMMERCIAL LENDING MARKET REVENUE, 2020–2030 ($BILLION)
FIGURE 29.CHINA COMMERCIAL LENDING MARKET REVENUE, 2020–2030 ($BILLION)
FIGURE 30.JAPAN COMMERCIAL LENDING MARKET REVENUE, 2020–2030 ($BILLION)
FIGURE 31.INDIA COMMERCIAL LENDING MARKET REVENUE, 2020–2030 ($BILLION)
FIGURE 32.AUSTRALIA COMMERCIAL LENDING MARKET REVENUE, 2020–2030 ($BILLION)
FIGURE 33.SOUTH KOREA COMMERCIAL LENDING MARKET REVENUE, 2020–2030 ($BILLION)
FIGURE 34.REST OF ASIA-PACIFIC COMMERCIAL LENDING MARKET REVENUE, 2020–2030 ($BILLION)
FIGURE 35.LATIN AMERICA COMMERCIAL LENDING MARKET REVENUE, 2020–2030 ($BILLION)
FIGURE 36.MIDDLE EAST COMMERCIAL LENDING MARKET REVENUE, 2020–2030 ($BILLION)
FIGURE 37.AFRICA COMMERCIAL LENDING MARKET REVENUE, 2020–2030 ($BILLION)
FIGURE 38.MARKET PLAYER POSITIONING, 2020
FIGURE 39.COMPETITIVE DASHBOARD
FIGURE 40.COMPETITIVE DASHBOARD
FIGURE 41.COMPETITIVE HEATMAP OF KEY PLAYERS
FIGURE 42.TOP WINNING STRATEGIES, BY YEAR, 2019–2021
FIGURE 43.TOP WINNING STRATEGIES, BY DEVELOPMENT, 2019–2021
FIGURE 44.TOP WINNING STRATEGIES, BY COMPANY, 2019–2021
FIGURE 45.AMERICAN EXPRESS COMPANY: REVENUE, 2018–2020 ($MILLION)
FIGURE 46.AMERICAN EXPRESS COMPANY: REVENUE SHARE, BY SEGMENT, 2020 (%)
FIGURE 47.AMERICAN EXPRESS COMPANY: REVENUE SHARE, BY REGION, 2020 (%)
FIGURE 48.CREDIT SUISSE GROUP AG: REVENUE, 2018–2020 ($MILLION)
FIGURE 49.CREDIT SUISSE GROUP AG: REVENUE SHARE, BY SEGMENT, 2020 (%)
FIGURE 50.CREDIT SUISSE GROUP AG: REVENUE SHARE, BY REGION, 2020 (%)
FIGURE 51.GOLDMAN SACHS: NET REVENUE, 2018–2020 ($MILLION)
FIGURE 53.GOLDMAN SACHS: REVENUE SHARE, BY REGION (2020)
$6169
$6930
$10665
