
The global electric truck market was valued at US$ 392.3 million in 2020 and is projected to reach US$ 3861.8 million by 2030 registering a Compound Annual Growth Rate (CAGR) of 26.4% from 2021 to 2030. Key drivers of the electric truck market include an increase in government initiatives for promoting e-mobility.
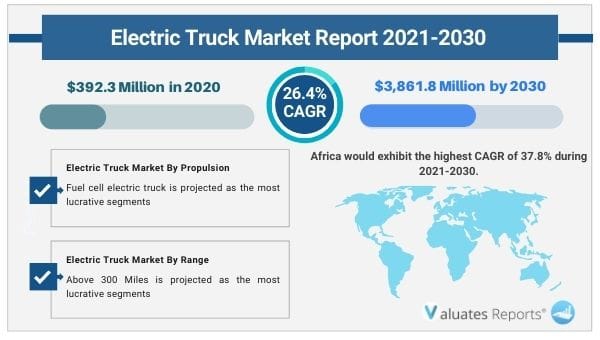
Further, strict emission norms for fossil fuel-powered commercial vehicles will drive the growth of the electric truck market during the forecast period. Moreover, the lack of charging infrastructure will restrain the market growth. However, growing demand from the logistics sector is expected to fuel the growth of the electric truck market in the coming years.
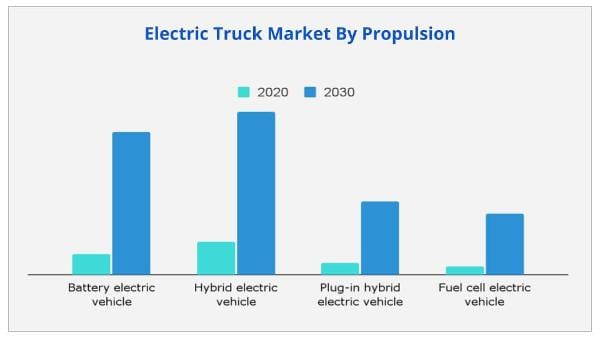
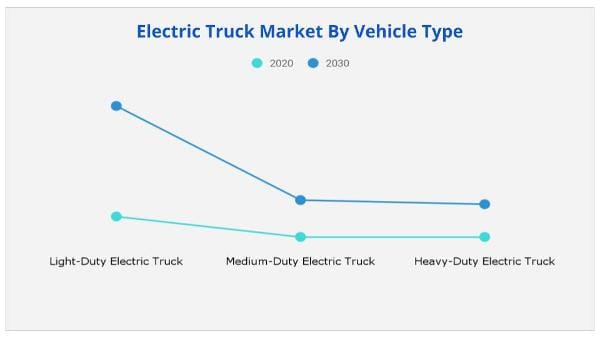
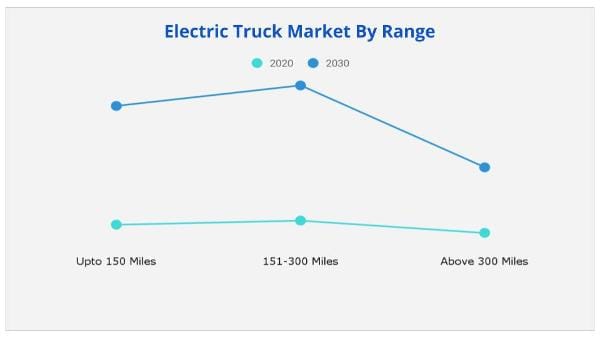
The electric truck market is segmented on the basis of propulsion, vehicle type, range, and region. By propulsion, the market is classified into the battery-electric truck, hybrid electric truck, plug-in hybrid electric truck, and fuel-cell electric truck. By vehicle type, it is categorized into light-duty electric truck, medium-duty electric truck, and heavy-duty electric truck. By range, it is divided into upto 150 miles, 151 to 300 miles, and above 300 miles. By region, the market is analyzed across North America, Europe, Asia-Pacific, Latin America & Middle East (LAME) and Africa.
The companies profiled in the global electric trucks industry report are AB Volvo, BYD Compay Ltd., Daimler AG, Dongfeng Motor Company, Geely Automobiles Holdings Limited, Man SE, Paccar Inc., Scania, Tata Motors and Workhorse.
Several governments around the world are putting pressure on vehicle manufacturers to cut down carbon emissions caused by diesel fuel combustion vehicles. This has led to the investment in battery-electric trucks. Further, tax credits, subsidies, highway toll exemptions, and incentives are just some of the ways governments are persuading people to purchase electric mobility vehicles in the form of trucks, fuel cells, and batteries. Thus growing government initiatives across the globe are leading to wide-scale adoption of electric trucks thereby fuelling the growth of the electric truck market during the forecast period.
Environmental agencies, regulatory bodies, and governments around the world are enacting strict rules for restricting nitrogen oxides and carbon dioxide emissions in the air. Regulations such as the Kyoto Protocol and COP21 have put an extra burden on vehicle manufacturers to reduce the production of fossil fuel-run commercial vehicles. This has led to the rise in efforts to make transportation cleaner propelling the demand for electric vehicles ultimately surging the growth of the electric truck market during the forecast period.
There is a huge boom in the production of electric vehicles and trucks. A sufficient amount of charging infrastructure is required to meet the ever-growing need for recharge of electric fleets. However, countries are struggling to match up to the ever-increasing demand which is expected to restrain the market growth. On the contrary, increasing demand from the freight transportation industry will bolster growth in the coming years. Logistics is seeing a rapid surge due to the significant penetration of the e-commerce industry. The logistics industry contributes massive amounts of carbon dioxide which is why companies are focussing on making their transport fleets greener which will drive growth. Thus lack of charging infrastructure will hamper the market but increasing demand from the logistics industry will propel the growth of the electric truck market during the forecast period.
Based on region, Asia-pacific is expected to provide lucrative opportunities for growth in the electric truck market share. LAMEA will witness the fastest growth during the forecast period due to strict government regulations on emissions. Africa will grow at the highest CAGR of 37.8%.
Based on propulsion, the fuel cell electric truck segment is expected to provide lucrative opportunities for growth in the electric truck market share and will grow at the fastest CAGR of 29.9% during the forecast period.
Based on vehicle type, the light-duty electric truck segment is expected to provide lucrative opportunities for growth in the electric truck market share during the forecast period.
By range, the above 300 miles segment is expected to provide lucrative opportunities for growth in the electric truck market share during the forecast period.
|
Report Metric |
Details |
|
Base Year: |
2020 |
|
Market Size in 2020: |
USD 392.3 Million |
|
Forecast Period: |
2021 to 2030 |
|
Forecast Period 2021 to 2030 CAGR: |
26.4% |
|
2030 Value Projection: |
USD 3,861.8 Million |
|
No. of Pages: |
317 |
|
Tables & Figures |
143 |
|
Charts |
91 |
|
Segments covered: |
By Propulsion, Vehicle Type and Range, Region |
Ans. The market size of electric truck surpassed USD 392.3 million in 2020 and will witness a Compound Annual Growth Rate (CAGR) of over 26.4% through 2030.
Ans. Strict emission norms for fossil fuel-powered commercial vehicles will drive the growth of the electric truck market during the forecast period
Ans. The global electric trucks industry report are AB Volvo, BYD Compay Ltd., Daimler AG, Dongfeng Motor Company, Geely Automobiles Holdings Limited, Man SE, Paccar Inc., Scania, Tata Motors and Workhorse.
Ans. The electric truck market is segmented on the basis of Propulsion, Vehicle Type and Range, Region.
Ans. The electric truck market is projected to reach USD 3861.8 million by 2030.
Ans. There are several new competetive developments in electric truck in the market in recent years incluing development in battery technologies, autonomous electric trucks, launch of various advanced electric trucks among others,
Ans. Currently Asia-Pacific leading the electric truck market, whereas africa is expected to provide more business opportunities for E-Truck in future
CHAPTER 1:INTRODUCTION
1.1.Report description
1.2.Key benefits for stakeholders
1.3.Key market segments
1.4.Research methodology
1.4.1.Primary research
1.4.2.Secondary research
1.4.3.Analyst tools and models
CHAPTER 2:EXECUTIVE SUMMARY
2.1.CXO perspective
CHAPTER 3:MARKET OVERVIEW
3.1.Market definition and scope
3.2.Key findings
3.2.1.Top impacting factors
3.2.2.Top investment pockets
3.2.3.Top winning strategies
3.3.Porter’s five forces analysis
3.4.Market share analysis, 2020 (%)
3.5.Market dynamics
3.5.1.Drivers
3.5.1.1.Increasing government initiatives for promotion of e-mobility
3.5.1.2.Stringent emission norms imposed on fossil-fuel powered commercial vehicles
3.5.1.3.Reducing cost of electric vehicle batteries
3.5.2.Restraints
3.5.2.1.Lack of charging infrastructure
3.5.2.2.High cost of electric trucks
3.5.3.Opportunities
3.5.3.1.Rising demand for electric trucks from the logistics sector
3.5.3.2.Development of self-driving electric truck technology
3.6.Impact of COVID-19 on Market
3.6.1.Evolution of Outbreaks
3.6.1.1.COVID-19
3.6.2.Macro-economic impact analysis
3.6.3.Micro-economic impact analysis
3.6.4.Covid impact on electric vehicle market
3.7.Assessment on China and India Automotive and Mobility Sector
3.7.1.China
3.7.1.1.Overview
3.7.1.2.Drivers
3.7.1.3.Restraint
3.7.1.4.Opportunities
3.7.2.India
3.7.2.1.Overview
3.7.2.2.Drivers
3.7.2.3.Restraint
3.7.2.4.Opportunities
3.8.Assessment on EV Regulation Scenario in Africa
3.8.1.Overview
CHAPTER 4:ELECTRIC TRUCK MARKET, BY PROPULSION
4.1.Overview
4.2.Battery electric truck
4.2.1.Key market trends, growth factors and opportunities
4.2.2.Market size and forecast, by region
4.2.3.Market analysis by country
4.3.Hybrid electric truck
4.3.1.Key market trends, growth factors, and opportunities
4.3.2.Market size and forecast, by region
4.3.3.Market analysis by country
4.4.Plug-in hybrid electric truck
4.4.1.Key market trends, growth factors and opportunities
4.4.2.Market size and forecast, by region
4.4.3.Market analysis by country
4.5.Fuel-cell electric truck
4.5.1.Key market trends, growth factors, and opportunities
4.5.2.Market size and forecast, by region
4.5.3.Market analysis by country
CHAPTER 5:ELECTRIC TRUCK MARKET, BY VEHICLE TYPE
5.1.Overview
5.2.Light-duty electric truck
5.2.1.Key market trends, growth factors and opportunities
5.2.2.Market size and forecast, by region
5.2.3.Market analysis by country
5.3.Medium-duty electric truck
5.3.1.Key market trends, growth factors, and opportunities
5.3.2.Market size and forecast, by region
5.3.3.Market analysis by country
5.4.Heavy-duty electric truck
5.4.1.Key market trends, growth factors, and opportunities
5.4.2.Market size and forecast, by region
5.4.3.Market analysis by country
CHAPTER 6:ELECTRIC TRUCK MARKET, BY RANGE
6.1.Overview
6.2.Up to 150 Miles
6.2.1.Key market trends, growth factors and opportunities
6.2.2.Market size and forecast, by region
6.2.3.Market analysis by country
6.3.151 to 300 miles
6.3.1.Key market trends, growth factors, and opportunities
6.3.2.Market size and forecast, by region
6.3.3.Market analysis by country
6.4.Above 300 Miles
6.4.1.Key market trends, growth factors, and opportunities
6.4.2.Market size and forecast, by region
6.4.3.Market analysis by country
CHAPTER 7:ELECTRIC TRUCK MARKET, BY REGION
7.1.Overview
7.2.North America
7.2.1.Key market trends, growth factors, and opportunities
7.2.2.Market size and forecast, by propulsion
7.2.3.Market size and forecast, by vehicle type
7.2.4.Market size and forecast, by range
7.2.5.Market analysis by country
7.2.5.1.U.S.
7.2.5.1.1.Market size and forecast, by propulsion
7.2.5.1.2.Market size and forecast, by vehicle type
7.2.5.1.3.Market size and forecast, by range
7.2.5.2.Canada
7.2.5.2.1.Market size and forecast, by propulsion
7.2.5.2.2.Market size and forecast, by vehicle type
7.2.5.2.3.Market size and forecast, by range
7.2.5.3.Mexico
7.2.5.3.1.Market size and forecast, by propulsion
7.2.5.3.2.Market size and forecast, by vehicle type
7.2.5.3.3.Market size and forecast, by Range
7.3.Europe
7.3.1.Key market trends, growth factors, and opportunities
7.3.2.Market size and forecast, by propulsion
7.3.3.Market size and forecast, by vehicle type
7.3.4.Market size and forecast, by range
7.3.5.Market analysis by country
7.3.5.1.UK
7.3.5.1.1.Market size and forecast, by propulsion
7.3.5.1.2.Market size and forecast, by vehicle type
7.3.5.1.3.Market size and forecast, by Range
7.3.5.2.Germany
7.3.5.2.1.Market size and forecast, by propulsion
7.3.5.2.2.Market size and forecast, by vehicle type
7.3.5.2.3.Market size and forecast, by range
7.3.5.3.France
7.3.5.3.1.Market size and forecast, by propulsion
7.3.5.3.2.Market size and forecast, by vehicle type
7.3.5.3.3.Market size and forecast, by range
7.3.5.4.Russia
7.3.5.4.1.Market size and forecast, by propulsion
7.3.5.4.2.Market size and forecast, by vehicle type
7.3.5.4.3.Market size and forecast, by range
7.3.5.5.Rest of Europe
7.3.5.5.1.Market size and forecast, by propulsion
7.3.5.5.2.Market size and forecast, by vehicle type
7.3.5.5.3.Market size and forecast, by range
7.4.Asia-Pacific
7.4.1.Key market trends, growth factors, and opportunities
7.4.2.Market size and forecast, by propulsion
7.4.3.Market size and forecast, by vehicle type
7.4.4.Market size and forecast, by range
7.4.5.Market analysis by country
7.4.5.1.China
7.4.5.1.1.Market size and forecast, by propulsion
7.4.5.1.2.Market size and forecast, by vehicle type
7.4.5.1.3.Market size and forecast, by range
7.4.5.2.India
7.4.5.2.1.Market size and forecast, by propulsion
7.4.5.2.2.Market size and forecast, by vehicle type
7.4.5.2.3.Market size and forecast, by range
7.4.5.3.Japan
7.4.5.3.1.Market size and forecast, by propulsion
7.4.5.3.2.Market size and forecast, by vehicle type
7.4.5.3.3.Market size and forecast, by range
7.4.5.4.South Korea
7.4.5.4.1.Market size and forecast, by propulsion
7.4.5.4.2.Market size and forecast, by vehicle type
7.4.5.4.3.Market size and forecast, by range
7.4.5.5.Rest of Asia-Pacific
7.4.5.5.1.Market size and forecast, by propulsion
7.4.5.5.2.Market size and forecast, by vehicle type
7.4.5.5.3.Market size and forecast, by range
7.5.LAME
7.5.1.Key market trends, growth factors, and opportunities
7.5.2.Market size and forecast, by propulsion
7.5.3.Market size and forecast, by vehicle type
7.5.4.Market size and forecast, by range
7.5.5.Market analysis by country
7.5.5.1.Latin America
7.5.5.1.1.Market size and forecast, by propulsion
7.5.5.1.2.Market size and forecast, by vehicle type
7.5.5.1.3.Market size and forecast, by range
7.5.5.2.Middle East
7.5.5.2.1.Market size and forecast, by propulsion
7.5.5.2.2.Market size and forecast, by vehicle type
7.5.5.2.3.Market size and forecast, by range
7.6.Africa
7.6.1.Key market trends, growth factors, and opportunities
7.6.2.Market size and forecast, by propulsion
7.6.3.Market size and forecast, by vehicle type
7.6.4.Market size and forecast, by range
7.6.5.Market analysis by country
7.6.5.1.Nigeria
7.6.5.2.Kenya
7.6.5.3.Ghana
7.6.5.4.South Africa
7.6.5.5.Rest of Africa
CHAPTER 8:COMPANY PROFILES
8.1.AB VOLVO
8.1.1.Company overview
8.1.2.Key executives
8.1.3.Company snapshot
8.1.4.Operating business segments
8.1.5.Product portfolio
8.1.6.R&D expenditure
8.1.7.Business performance
8.1.8.Key strategic moves and developments
8.2.BYD COMPAY LTD.
8.2.1.Company overview
8.2.2.Key executives
8.2.3.Company snapshot
8.2.4.Operating business segments
8.2.5.Product portfolio
8.2.6.R&D expenditure
8.2.7.Business performance
8.2.8.Key strategic moves and developments
8.3.DAIMLER AG
8.3.1.Company overview
8.3.2.Key executives
8.3.3.Company snapshot
8.3.4.Operating business segments
8.3.5.Product portfolio
8.3.6.R&D expenditure
8.3.7.Business performance
8.3.8.Key strategic moves and developments
8.4.DONGFENG MOTOR COMPANY
8.4.1.Company overview
8.4.2.Key executives
8.4.3.Company snapshot
8.4.4.Operating business segments
8.4.5.Product portfolio
8.4.6.R&D expenditure
8.4.7.Business performance
8.4.8.Key strategic moves and developments
8.5.GEELY AUTOMOBILES HOLDINGS LIMITED.
8.5.1.Company overview
8.5.2.Key executives
8.5.3.Company snapshot
8.5.4.Operating business segments
8.5.5.Product portfolio
8.5.6.R&D expenditure
8.5.7.Business performance
8.5.8.Key strategic moves and developments
8.6.MAN SE
8.6.1.Company overview
8.6.2.Key executives
8.6.3.Company snapshot
8.6.4.Operating business segments
8.6.5.Product portfolio
8.6.6.R&D expenditure
8.6.7.Business performance
8.6.8.Key strategic moves and developments
8.7.PACCAR INC.
8.7.1.Company overview
8.7.2.Key executives
8.7.3.Company snapshot
8.7.4.Operating business segments
8.7.5.Product portfolio
8.7.6.R&D expenditure
8.7.7.Business performance
8.7.8.Key strategic moves and developments
8.8.SCANIA
8.8.1.Company overview
8.8.2.Key executives
8.8.3.Company snapshot
8.8.4.Operating business segments
8.8.5.Product portfolio
8.8.6.R&D expenditure
8.8.7.Business performance
8.8.8.Key strategic moves and developments
8.9.TATA MOTORS
8.9.1.Company overview
8.9.2.Key executives
8.9.3.Company snapshot
8.9.4.Operating business segments
8.9.5.Product portfolio
8.9.6.R&D expenditure
8.9.7.Business performance
8.10.WORKHORSE
8.10.1.Company overview
8.10.2.Key executives
8.10.3.Company snapshot
8.10.4.Operating business segments
8.10.5.Product portfolio
8.10.6.R&D expenditure
8.10.7.Business performance
8.10.8.Key strategic moves and developments
Table 01.Ev Regulation And Initatives Scenario In Africa
Table 02.Electric Truck Market, By Propulsion, 2020–2030 ($Million)
Table 03.Electric Truck Market Revenue For Battery Electric Truck, By Region 2020–2030 ($Million)
Table 04.Electric Truck Market Revenue For Hybrid Electric Truck, By Region 2020–2030 ($Million)
Table 05.Electric Truck Market Revenue For Plug-In Hybrid Electric Truck, By Region 2020–2030 ($Million)
Table 06.Electric Truck Market Revenue For Fuel Cell Electric Truck, By Region 2020–2030 ($Million)
Table 07.Electric Truck Market, By Vehicle Type, 2020–2030($Million)
Table 08.Electric Truck Market Revenue For Light-Duty Electric Truck, By Region 2020–2030 ($Million)
Table 09.Electric Truck Market Revenue For Medium-Duty Electric Truck, By Region 2020–2030 ($Million)
Table 10.Electric Truck Market Revenue For Heavy-Duty Electric Truck, By Region 2020–2030 ($Million)
Table 11.Electric Truck Market, By Range, 2020–2030($Million)
Table 12.Electric Truck Market Revenue For Upto 150 Miles, By Region 2020–2030 ($Million)
Table 13.Electric Truck Market Revenue For 151 To 300 Miles, By Region 2020–2030 ($Million)
Table 14.Electric Truck Market Revenue For Above 300 Miles, By Region 2020–2030 ($Million)
Table 15.North America Electric Truck Market, By Propulsion, 2020–2030 ($Million)
Table 16.North America Electric Truck Market, By Vehicle Type, 2020–2030 ($Million)
Table 17.North America Electric Truck Market, By Range, 2020–2030 ($Million)
Table 18.U. S. Electric Truck Market, By Propulsion, 2020–2030 ($Million)
Table 19.U. S. Electric Truck Market, By Vehicle Type, 2020–2030 ($Million)
Table 20.U. S. Electric Truck Market, By Range, 2020–2030 ($Million)
Table 21.Canada Electric Truck Market, By Propulsion, 2020–2030 ($Million)
Table 22.Canada Electric Truck Market, By Vehicle Type, 2020–2030 ($Million)
Table 23.Canada Electric Truck Market, By Range, 2020–2030 ($Million)
Table 24.Mexico Electric Truck Market, By Propulsion, 2020–2030 ($Million)
Table 25.Mexico Electric Truck Market, By Vehicle Type, 2020–2030 ($Million)
Table 26.Mexico Electric Truck Market, By Range, 2020–2030 ($Million)
Table 27.Europe Electric Truck Market, By Propulsion, 2020–2030 ($Million)
Table 28.Europe Electric Truck Market, By Vehicle Type, 2020–2030 ($Million)
Table 29.Europe Electric Truck Market, By Range, 2020–2030 ($Million)
Table 30.Uk Electric Truck Market, By Propulsion, 2020–2030 ($Million)
Table 31.Uk Electric Truck Market, By Vehicle Type, 2020–2030 ($Million)
Table 32.Uk Electric Truck Market, By Range, 2020–2030 ($Million)
Table 33.Germany Electric Truck Market, By Propulsion, 2020–2030 ($Million)
Table 34.Germany Electric Truck Market, By Vehicle Type, 2020–2030 ($Million)
Table 35.Germany Electric Truck Market, By Range, 2020–2030 ($Million)
Table 36.France Electric Truck Market, By Propulsion, 2020–2030 ($Million)
Table 37.France Electric Truck Market, By Vehicle Type, 2020–2030 ($Million)
Table 38.France Electric Truck Market, By Range, 2020–2030 ($Million)
Table 39.Russia Electric Truck Market, By Propulsion, 2020–2030 ($Million)
Table 40.Russia Electric Truck Market, By Vehicle Type, 2020–2030 ($Million)
Table 41.Russia Electric Truck Market, By Range, 2020–2030 ($Million)
Table 42.Rest Of Europe Electric Truck Market, By Propulsion, 2020–2030 ($Million)
Table 43.Rest Of Europe Electric Truck Market, By Vehicle Type, 2020–2030 ($Million)
Table 44.Rest Of Europe Electric Truck Market, By Range, 2020–2030 ($Million)
Table 45.Asia-Pacific Electric Truck Market, By Propulsion, 2020–2030 ($Million)
Table 46.Asia-Pacific Electric Truck Market, By Vehicle Type, 2020–2030 ($Million)
Table 47.Asia-Pacific Electric Truck Market, By Range, 2020–2030 ($Million)
Table 48.China Electric Truck Market, By Propulsion, 2020–2030 ($Million)
Table 49.China Electric Truck Market, By Vehicle Type, 2020–2030 ($Million)
Table 50.China Electric Truck Market, By Range, 2020–2030 ($Million)
Table 51.India Electric Truck Market, Bypropulsion, 2020–2030 ($Million)
Table 52.India Electric Truck Market, By Vehicle Type, 2020–2030 ($Million)
Table 53.India Electric Truck Market, By Range, 2020–2030 ($Million)
Table 54.Japan Electric Truck Market, By Propulsion, 2020–2030 ($Million)
Table 55.Japan Electric Truck Market, By Vehicle Type, 2020–2030 ($Million)
Table 56.Japan Electric Truck Market, By Range, 2020–2030 ($Million)
Table 57.South Korea Electric Truck Market, By Propulsion, 2020–2030 ($Million)
Table 58.South Korea Electric Truck Market, By Vehicle Type, 2020–2030 ($Million)
Table 59.South Korea Electric Truck Market, By Range, 2020–2030 ($Million)
Table 60.Rest Of Asia-Pacific Electric Truck Market, By Propulsion, 2020–2030 ($Million)
Table 61.Rest Of Asia-Pacific Electric Truck Market, By Vehicle Type, 2020–2030 ($Million)
Table 62.Rest Of Asia-Pacific Electric Truck Market, By Range, 2020–2030 ($Million)
Table 63.Lame Electric Truck Market, By Propulsion, 2020–2030 ($Million)
Table 64.Lame Electric Truck Market, By Vehicle Type, 2020–2030 ($Million)
Table 65.Lame Electric Truck Market, By Range, 2020–2030 ($Million)
Table 66.Latin America Electric Truck Market, By Propulsion, 2020–2030 ($Million)
Table 67.Latin America Electric Truck Market, By Vehicle Type, 2020–2030 ($Million)
Table 68.Latin America Electric Truck Market, By Range, 2020–2030 ($Million)
Table 69.Middle East Electric Truck Market, By Propulsion, 2020–2030 ($Million)
Table 70.Middle East Electric Truck Market, By Vehicle Type, 2020–2030 ($Million)
Table 71.Middle East Electric Truck Market, By Range, 2020–2030 ($Million)
Table 72.Africa Electric Truck Market, By Propulsion, 2020–2030 ($Million)
Table 73.Africa Electric Truck Market, By Vehicle Type, 2020–2030 ($Million)
Table 74.Africa Electric Truck Market, By Range, 2020–2030 ($Million)
Table 75.Ab Volvo: Key Executives
Table 76.Ab Volvo: Company Snapshot
Table 77.Ab Volvo: Operating Segments
Table 78.Ab Volvo: Product Portfolio
Table 79.Ab Volvo: R&D Expenditure, 2018–2020 ($Million)
Table 80.Ab Volvo: Net Sales, 2018–2020 ($Million)
Table 81.Ab Volvo: Key Strategic Moves And Developments
Table 82.Byd Company Ltd.: Key Executives
Table 83.Byd Company Ltd.: Company Snapshot
Table 84.Byd Company Ltd.: Operating Segments
Table 85.Byd Company Ltd.: Product Portfolio
Table 86.Byd Company Ltd.: R&D Expenditure, 2018–2020 ($Million)
Table 87.Byd Company Ltd.: Net Sales, 2018–2020 ($Million)
Table 88.Acro Aircraft Seating Ltd.: Key Strategic Moves And Developments
Table 89.Daimler Ag: Key Executives
Table 90.Daimler Ag: Company Snapshot
Table 91.Daimler Ag: Operating Segments
Table 92.Daimler Ag: Product Portfolio
Table 93.Daimler Ag: R&D Expenditure, 2018–2020 ($Million)
Table 94.Daimler Ag: Net Sales, 2018–2020 ($Million)
Table 95.Daimler Ag: Key Strategic Moves And Developments
Table 96.Dongfeng Motor Company: Key Executives
Table 97.Dongfeng Motor Company: Company Snapshot
Table 98.Dongfeng Motor Company: Operating Segments
Table 99.Dongfeng Motor Company: Product Portfolio
Table 100.Dongfeng Motor Company: R&D Expenditure, 2018–2020 ($Million)
Table 101.Dongfeng Motor Company: Net Sales, 2018–2020 ($Million)
Table 102.Dongfeng Motor Company: Key Strategic Moves And Developments
Table 103.Geely Automobiles Holdings Limited: Key Executives
Table 104.Geely Automobiles Holdings Limited: Company Snapshot
Table 105.Geely Automobiles Holdings Limited: Operating Segments
Table 106.Geely Automobiles Holdings Limited: Product Portfolio
Table 107.Geely Automobiles Holdings Limited: R&D Expenditure, 2018–2020 ($Million)
Table 108.Geely Automobiles Holdings Limited: Net Sales, 2018–2020 ($Million)
Table 109.Geely Automobiles Holdings Limited: Key Strategic Moves And Developments
Table 110.Man Se: Key Executives
Table 111.Man Se: Company Snapshot
Table 112.Man Se: Operating Segments
Table 113.Man Se: Product Portfolio
Table 114.Man Se: R&D Expenditure, 2018–2020 ($Million)
Table 115.Man Se: Net Sales, 2018–2020 ($Million)
Table 116.Man Se: Key Strategic Moves And Developments
Table 117.Paccar Inc: Key Executives
Table 118.Paccar Inc: Company Snapshot
Table 119.Paccar Inc: Operating Segments
Table 120.Paccar Inc: Product Portfolio
Table 121.Paccar Inc.: R&D Expenditure, 2018–2020 ($Million)
Table 122.Paccar Inc.: Net Sales, 2018–2020 ($Million)
Table 123.Paccar Inc.: Key Strategic Moves And Developments
Table 124.Scania: Key Executives
Table 125.Scania: Company Snapshot
Table 126.Scania: Operating Segments
Table 127.Scania: Product Portfolio
Table 128.Scania: R&D Expenditure, 2018–2020 ($Million)
Table 129.Scania: Net Sales, 2018–2020 ($Million)
Table 130.Scania: Key Strategic Moves And Developments
Table 131.Tata Motors: Key Executives
Table 132.Tata Motors: Company Snapshot
Table 133.Tata Motors: Operating Segments
Table 134.Tata Motors: Product Portfolio
Table 135.Tata Motors: R&D Expenditure, 2018–2020 ($Million)
Table 136.Tata Motors: Net Sales, 2018–2020 ($Million)
Table 137.Workhorse: Key Executives
Table 138.Workhorse: Company Snapshot
Table 139.Workhorse: Operating Segments
Table 140.Workhorse: Product Portfolio
Table 141.Workhorse: R&D Expenditure, 2018–2020 ($Million)
Table 142.Workhorse: Net Sales, 2018–2020 ($Million)
Table 143.Workhorse: Key Strategic Moves And Developments
List Of Figures
Figure 01.Key Market Segments
Figure 02.Executive Summary
Figure 03.Executive Summary
Figure 04.Top Impacting Factors
Figure 05.Top Investment Pockets
Figure 06.Top Winning Strategies, By Year, 2018–2021*
Figure 07.Top Winning Strategies, By Year, 2018–2021*
Figure 08.Top Winning Strategies, By Company, 2018–2021*
Figure 09.Moderate-To-High Bargaining Power Of Suppliers
Figure 10.Moderate-To-High Threat Of New Entrants
Figure 11.Moderate Threat Of Substitutes
Figure 12.High-To-Moderate Intensity Of Rivalry
Figure 13.Moderate-To-High To Bargaining Power Of Buyers
Figure 14.Market Share Analysis (2019)
Figure 15.Electric Truck Market Share, By Propulsion, 2020–2030 (%)
Figure 16.Comparative Share Analysis Of Electric Truck Market For Battery Electric Truck , By Country, 2020 & 2030 ($Million)
Figure 17.Comparative Share Analysis Of Electric Truck Market For Hybrid Electric Truck , By Country, 2020 & 2030 ($Million)
Figure 18.Comparative Share Analysis Of Electric Truck Market For Plug-In Hybrid Electric Truck , By Country, 2020 & 2030 ($Million)
Figure 19.Comparative Share Analysis Of Electric Truck Market For Fuel Cell Electric Truck, By Country, 2020 & 2030 ($Million)
Figure 20.Electric Truck Market Share, By Vehicle Type, 2020–2030 (%)
Figure 21.Comparative Share Analysis Of Electric Truck Market For Light-Duty Electric Truck, By Country, 2020 & 2030 ($Million)
Figure 22.Comparative Share Analysis Of Electric Truck Market For Medium-Duty Electric Truck, By Country, 2020 & 2030 ($Million)
Figure 23.Comparative Share Analysis Of Electric Truck Market For Heavy-Duty Electric Truck,By Country, 2020 & 2030 ($Million)
Figure 24.Electric Truck Market Share, By Range, 2020–2030 (%)
Figure 25.Comparative Share Analysis Of Electric Truck Market For Upto 150 Miles, By Country, 2020 & 2030 ($Million)
Figure 26.Comparative Share Analysis Of Electric Truck Market For 151 To 300 Miles, By Country, 2020 & 2030 ($Million)
Figure 27.Comparative Share Analysis Of Electric Truck Market For Above 300 Miles, By Country, 2020 & 2030 ($Million)
Figure 28.Electric Truck Market, By Region, 2020–2030 (%)
Figure 29.Comparative Share Analysis Of Electric Truck Market, By Country, 2020–2030 (%)
Figure 30.U. S. Electric Truck Market, 2020–2030 ($Million)
Figure 31.Canada Electric Truck Market, 2020–2030 ($Million)
Figure 32.Mexico Electric Truck Market, 2020–2030 ($Million)
Figure 33.Comparative Share Analysis Of Electric Truck Market, By Country, 2020–2030 (%)
Figure 34.Uk Electric Truck Market, 2020–2030 ($Million)
Figure 35.Germany Electric Truck Market, 2020–2030 ($Million)
Figure 36.France Electric Truck Market, 2020–2030 ($Million)
Figure 37.Russia Electric Truck Market, 2020–2030 ($Million)
Figure 38.Rest Of Europe Electric Truck Market, 2020–2030 ($Million)
Figure 39.Comparative Share Analysis Of Electric Truck Market, By Country, 2020–2030 (%)
Figure 40.China Electric Truck Market, 2020–2030 ($Million)
Figure 41.India Electric Truck Market, 2020–2030 ($Million)
Figure 42.Japan Electric Truck Market, 2020–2030 ($Million)
Figure 43.South Korea Electric Truck Market, 2020–2030 ($Million)
Figure 44.Rest Of Asia-Pacific Electric Truck Market, 2020–2030 ($Million)
Figure 45.Comparative Share Analysis Of Electric Truck Market, By Country, 2020–2030 (%)
Figure 46.Latin America Electric Truck Market, 2020–2030 ($Million)
Figure 47.Middle East Electric Truck Market, 2020–2030 ($Million)
Figure 48.Comparative Share Analysis Of Electric Truck Market, By Country, 2020–2030 (%)
Figure 49.Nigeria Electric Truck Market, 2020–2030 ($Million)
Figure 50.Kenya Electric Truck Market, 2020–2030 ($Million)
Figure 51.Ghana Electric Truck Market, 2020–2030 ($Million)
Figure 52.Nigeria Electric Truck Market, 2020–2030 ($Million)
Figure 53.Rest Of Africa Electric Truck Market, 2020–2030 ($Million)
Figure 54.Ab Volvo: R&D Expenditure, 2018–2020 ($Million)
Figure 55.Ab Volvo: Net Sales, 2018–2020 ($Million)
Figure 56.Ab Volvo: Revenue Share By Segment, 2020 (%)
Figure 57.Ab Volvo: Revenue Share By Region, 2020 (%)
Figure 58.Byd Company Ltd.: R&D Expenditure, 2018–2020 ($Million)
Figure 59.Byd Company Ltd.: Net Sales, 2018–2020 ($Million)
Figure 60.Byd Company Ltd.: Revenue Share By Segment, 2020 (%)
Figure 61.Byd Company Ltd.: Revenue Share By Region, 2020 (%)
Figure 62.Daimler Ag: R&D Expenditure, 2018–2020 ($Million)
Figure 63.Daimler Ag: Net Sales, 2018–2020 ($Million)
Figure 64.Daimler Ag: Revenue Share By Segment, 2020 (%)
Figure 65.Daimler Ag: Revenue Share By Region, 2020 (%)
Figure 66.Dongfeng Motor Company: R&D Expenditure, 2018–2020 ($Million)
Figure 67.Dongfeng Motor Company: Net Sales, 2018–2020 ($Million)
Figure 68.Dongfeng Motor Company: Revenue Share By Segment, 2020 (%)
Figure 69.Geely Automobiles Holdings Limited: R&D Expenditure, 2018–2020 ($Million)
Figure 70.Geely Automobiles Holdings Limited: Net Sales, 2018–2020 ($Million)
Figure 71.Geely Automobiles Holdings Limited: Revenue Share By Segment, 2020 (%)
Figure 72.Geely Automobiles Holdings Limited: Revenue Share By Region, 2020 (%)
Figure 73.Man Se: R&D Expenditure, 2018–2020 ($Million)
Figure 74.Man Se: Net Sales, 2018–2020 ($Million)
Figure 75.Man Se: Revenue Share By Segment, 2020 (%)
Figure 76.Man Se: Revenue Share By Region, 2020 (%)
Figure 77.Paccar Inc.: R&D Expenditure, 2018–2020 ($Million)
Figure 78.Paccar Inc.: Net Sales, 2018–2020 ($Million)
Figure 79.Paccar Inc.: Revenue Share By Segment, 2020 (%)
Figure 80.Paccar Inc.: Revenue Share By Region, 2020 (%)
Figure 81.Scania: R&D Expenditure, 2018–2020 ($Million)
Figure 82.Scania: Net Sales, 2018–2020 ($Million)
Figure 83.Scania: Revenue Share By Segment, 2020 (%)
Figure 84.Scania: Revenue Share By Region, 2020 (%)
Figure 85.Tata Motors: R&D Expenditure, 2018–2020 ($Million)
Figure 86.Tata Motors: Net Sales, 2018–2020 ($Million)
Figure 87.Tata Motors: Revenue Share By Segment, 2020 (%)
Figure 88.Tata Motors: Revenue Share By Region, 2020 (%)
Figure 89.Workhorse: R&D Expenditure, 2018–2020 ($Million)
Figure 90.Workhorse: Net Sales, 2018–2020 ($Million)
Figure 91.Workhorse: Revenue Share By Segment, 2020 (%)
$5769
$9995
HAVE A QUERY?
OUR CUSTOMER

SIMILAR REPORTS