
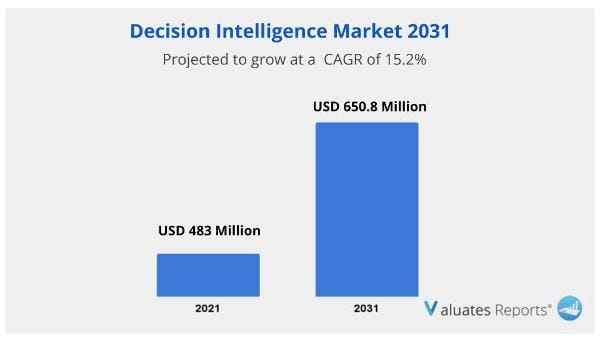
The global decision intelligence market was valued at USD 9.8 billion in 2021 and is projected to reach USD 39.3 billion by 2031, growing at a CAGR of 15.2% from 2022 to 2031. The need for rapid, accurate judgments to ensure better outcomes and an increasing need for multiple problem-solving options are some of the key factors projected to drive the worldwide decision intelligence market revenue growth during the forecast period.
A wide range of industries is now able to fully utilize decision intelligence thanks to the development of ML and AI. This is then anticipated to fuel the market for decision intelligence's expansion.
Decision intelligence integrates data with options and consequences for the goal of helping, augmenting, and automating business decisions. It blends techniques (such as decision theories and decision mapping) with technologies to enhance the decision-making process in businesses. (such as automation and machine learning). Decision intelligence includes both ongoing examination of choice results and the improvement of those outcomes through a feedback system. Additionally, it is anticipated that a sizeable portion of the market for decision intelligence's revenue growth would be fueled by the rising demand to reduce certain risks connected to human decision-making. One of the most pervasive problems in businesses is poor decision-making, which can reduce production and raise the cost of goods.
Decision intelligence is emerging as a solution to the urgent need to digitize and utilize cutting-edge technologies like AI and ML. It may integrate decision support, decision management, and complex systems applications. Forecasting and prediction power are improved by both AI and ML, supporting decision intelligence. In a wide range of use cases and industries, organizations employ decision intelligence to accelerate and automate decision-making processes. Decision intelligence helps bridge the gap between data and better decision-making for organizations striving to survive in a sea of data. This is then anticipated to fuel the market for decision intelligence's expansion.
Big data is the practice of storing, analyzing, and visualizing a wide range of structured, semi-structured, and unstructured data that organizations receive in order to gain insightful knowledge. Big data analytics use a number of intricate analytical techniques, such as statistical algorithms, predictive models, etc., to analyze and manage enormous and varied datasets from several sources and sizes. This is then anticipated to fuel the market for decision intelligence's expansion.
North America dominated the decision intelligence market size in terms of the region in 2021 and is anticipated to maintain its position during the forecast period. This is due to the ability of cutting-edge technologies like artificial intelligence (AI), machine learning (ML), intelligent apps, and natural language queries to transform data dashboards and business analytics into more comprehensive decision-support platforms.
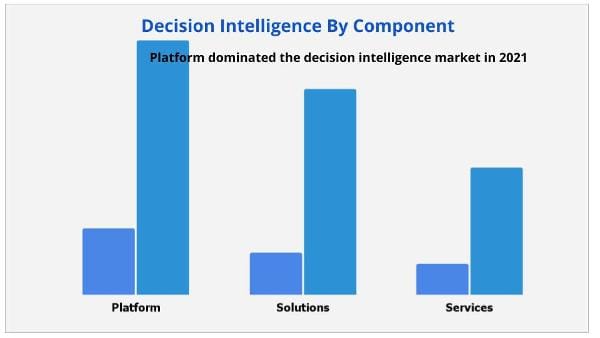
The platform segment dominated the decision intelligence market share in 2021 and is predicted to maintain its dominance during the forecast period as a result of the rise in data-driven decision-making using a decision intelligence platform. The platform democratizes the power of data science and machine learning algorithms so that users of all technical and non-technical backgrounds can access previously inaccessible insights.
Based on the size of the company, the decision intelligence market is split into two categories: major companies and small and medium organizations. In 2021, the large enterprise sector generated the largest revenue share in the decision intelligence market.
Cloud and on-premises deployment categories make up the decision intelligence market. The cloud sector of the decision intelligence market recorded the highest revenue share in 2021. This is due to the fact that plenty of companies think cloud-based AI services are the best option. Instead of building a large data center, businesses can access organizations utilizing the infrastructure already in existence.
Deployment Mode
Large Enterprise Size
Industry Verticals
Cargill, Incorporated, cj foods, corbion, GIMMESEAWEED, HUBER, IrishSeaweeds, MaraSeaweed, Ocean Harvest Technology Limited, qingdao bright moon seaweed group co.,ltd., Roland Foods LLC, SeaSnax, seasol international pty ltd, Seaweed & Co., SINGHA CORPORATION CO., LTD., TAOKAENOI FOOD & MARKETING PCL
Region
| Report Metric | Details |
| Report Name | Decision Intelligence Market |
| The market size in 2021 | USD 9.8 Billion |
| The revenue forecast in 2031 | USD 39.3 Billion |
| Growth Rate | Compound Annual Growth Rate (CAGR) of 2.0% from 2021 to 2031 |
| Market size available for years | 2021-2031 |
| Forecast units | Value (USD) |
| Segments covered | By Component, Deployment mode, Enterprise size, industry verticals & Region |
| Report coverage | Revenue & volume forecast, company share, competitive landscape, growth factors, and trends |
| Geographic regions covered | North America, Europe, Asia Pacific, Latin America, Middle East & Africa |
Ans. The global decision intelligence market was valued at $9.8 billion in 2021, and is projected to reach $39.3 billion by 2031, growing at a CAGR of 15.2% from 2022 to 2031.
Ans. Platform dominated the decision intelligence market in 2021, owing to various organizations which accelerates data-driven decision making with the help of decision intelligence platform.
Ans. North America dominated the decision intelligence market in 2021, owing to the growing deployment of AI and ML which enables decision intelligence in U.S. government sector to improve the delivery of public services.
CHAPTER 1: INTRODUCTION
CHAPTER 2: EXECUTIVE SUMMARY
CHAPTER 3: MARKET OVERVIEW
CHAPTER 4: DECISION INTELLIGENCE MARKET, BY COMPONENT
CHAPTER 5: DECISION INTELLIGENCE MARKET, BY DEPLOYMENT MODE
CHAPTER 6: DECISION INTELLIGENCE MARKET, BY ENTERPRISE SIZE
CHAPTER 7: DECISION INTELLIGENCE MARKET, BY INDUSTRY VERTICAL
CHAPTER 8: DECISION INTELLIGENCE MARKET, BY REGION
CHAPTER 9: COMPETITIVE LANDSCAPE
CHAPTER 10: COMPANY PROFILES
LIST OF TABLES
TABLE 01. GLOBAL DECISION INTELLIGENCE MARKET, BY COMPONENT, 2021-2031 ($MILLION)
TABLE 02. DECISION INTELLIGENCE MARKET FOR PLATFORM, BY REGION, 2021-2031 ($MILLION)
TABLE 03. DECISION INTELLIGENCE MARKET FOR SOLUTIONS, BY REGION, 2021-2031 ($MILLION)
TABLE 04. DECISION INTELLIGENCE MARKET FOR SERVICES, BY REGION, 2021-2031 ($MILLION)
TABLE 05. GLOBAL DECISION INTELLIGENCE MARKET, BY DEPLOYMENT MODE, 2021-2031 ($MILLION)
TABLE 06. DECISION INTELLIGENCE MARKET FOR ON-PREMISE, BY REGION, 2021-2031 ($MILLION)
TABLE 07. DECISION INTELLIGENCE MARKET FOR CLOUD, BY REGION, 2021-2031 ($MILLION)
TABLE 08. GLOBAL DECISION INTELLIGENCE MARKET, BY ENTERPRISE SIZE, 2021-2031 ($MILLION)
TABLE 09. DECISION INTELLIGENCE MARKET FOR LARGE ENTERPRISE, BY REGION, 2021-2031 ($MILLION)
TABLE 10. DECISION INTELLIGENCE MARKET FOR SMALL AND MEDIUM-SIZED ENTERPRISES (SMES), BY REGION, 2021-2031 ($MILLION)
TABLE 11. GLOBAL DECISION INTELLIGENCE MARKET, BY INDUSTRY VERTICAL, 2021-2031 ($MILLION)
TABLE 12. DECISION INTELLIGENCE MARKET FOR ENERGY AND UTILITIES, BY REGION, 2021-2031 ($MILLION)
TABLE 13. DECISION INTELLIGENCE MARKET FOR BFSI, BY REGION, 2021-2031 ($MILLION)
TABLE 14. DECISION INTELLIGENCE MARKET FOR IT AND TELECOM, BY REGION, 2021-2031 ($MILLION)
TABLE 15. DECISION INTELLIGENCE MARKET FOR GOVERNMENT, BY REGION, 2021-2031 ($MILLION)
TABLE 16. DECISION INTELLIGENCE MARKET FOR HEALTHCARE, BY REGION, 2021-2031 ($MILLION)
TABLE 17. DECISION INTELLIGENCE MARKET FOR MANUFACTURING, BY REGION, 2021-2031 ($MILLION)
TABLE 18. DECISION INTELLIGENCE MARKET FOR RETAIL AND CONSUMER GOODS, BY REGION, 2021-2031 ($MILLION)
TABLE 19. DECISION INTELLIGENCE MARKET FOR OTHERS, BY REGION, 2021-2031 ($MILLION)
TABLE 20. DECISION INTELLIGENCE MARKET, BY REGION, 2021-2031 ($MILLION)
TABLE 21. NORTH AMERICA DECISION INTELLIGENCE MARKET, BY COMPONENT, 2021-2031 ($MILLION)
TABLE 22. NORTH AMERICA DECISION INTELLIGENCE MARKET, BY DEPLOYMENT MODE, 2021-2031 ($MILLION)
TABLE 23. NORTH AMERICA DECISION INTELLIGENCE MARKET, BY ENTERPRISE SIZE, 2021-2031 ($MILLION)
TABLE 24. NORTH AMERICA DECISION INTELLIGENCE MARKET, BY INDUSTRY VERTICAL, 2021-2031 ($MILLION)
TABLE 25. NORTH AMERICA DECISION INTELLIGENCE MARKET, BY COUNTRY, 2021-2031 ($MILLION)
TABLE 26. U.S. DECISION INTELLIGENCE MARKET, BY COMPONENT, 2021-2031 ($MILLION)
TABLE 27. U.S. DECISION INTELLIGENCE MARKET, BY DEPLOYMENT MODE, 2021-2031 ($MILLION)
TABLE 28. U.S. DECISION INTELLIGENCE MARKET, BY ENTERPRISE SIZE, 2021-2031 ($MILLION)
TABLE 29. U.S. DECISION INTELLIGENCE MARKET, BY INDUSTRY VERTICAL, 2021-2031 ($MILLION)
TABLE 30. CANADA DECISION INTELLIGENCE MARKET, BY COMPONENT, 2021-2031 ($MILLION)
TABLE 31. CANADA DECISION INTELLIGENCE MARKET, BY DEPLOYMENT MODE, 2021-2031 ($MILLION)
TABLE 32. CANADA DECISION INTELLIGENCE MARKET, BY ENTERPRISE SIZE, 2021-2031 ($MILLION)
TABLE 33. CANADA DECISION INTELLIGENCE MARKET, BY INDUSTRY VERTICAL, 2021-2031 ($MILLION)
TABLE 34. EUROPE DECISION INTELLIGENCE MARKET, BY COMPONENT, 2021-2031 ($MILLION)
TABLE 35. EUROPE DECISION INTELLIGENCE MARKET, BY DEPLOYMENT MODE, 2021-2031 ($MILLION)
TABLE 36. EUROPE DECISION INTELLIGENCE MARKET, BY ENTERPRISE SIZE, 2021-2031 ($MILLION)
TABLE 37. EUROPE DECISION INTELLIGENCE MARKET, BY INDUSTRY VERTICAL, 2021-2031 ($MILLION)
TABLE 38. EUROPE DECISION INTELLIGENCE MARKET, BY COUNTRY, 2021-2031 ($MILLION)
TABLE 39. UK DECISION INTELLIGENCE MARKET, BY COMPONENT, 2021-2031 ($MILLION)
TABLE 40. UK DECISION INTELLIGENCE MARKET, BY DEPLOYMENT MODE, 2021-2031 ($MILLION)
TABLE 41. UK DECISION INTELLIGENCE MARKET, BY ENTERPRISE SIZE, 2021-2031 ($MILLION)
TABLE 42. UK DECISION INTELLIGENCE MARKET, BY INDUSTRY VERTICAL, 2021-2031 ($MILLION)
TABLE 43. GERMANY DECISION INTELLIGENCE MARKET, BY COMPONENT, 2021-2031 ($MILLION)
TABLE 44. GERMANY DECISION INTELLIGENCE MARKET, BY DEPLOYMENT MODE, 2021-2031 ($MILLION)
TABLE 45. GERMANY DECISION INTELLIGENCE MARKET, BY ENTERPRISE SIZE, 2021-2031 ($MILLION)
TABLE 46. GERMANY DECISION INTELLIGENCE MARKET, BY INDUSTRY VERTICAL, 2021-2031 ($MILLION)
TABLE 47. FRANCE DECISION INTELLIGENCE MARKET, BY COMPONENT, 2021-2031 ($MILLION)
TABLE 48. FRANCE DECISION INTELLIGENCE MARKET, BY DEPLOYMENT MODE, 2021-2031 ($MILLION)
TABLE 49. FRANCE DECISION INTELLIGENCE MARKET, BY ENTERPRISE SIZE, 2021-2031 ($MILLION)
TABLE 50. FRANCE DECISION INTELLIGENCE MARKET, BY INDUSTRY VERTICAL, 2021-2031 ($MILLION)
TABLE 51. ITALY DECISION INTELLIGENCE MARKET, BY COMPONENT, 2021-2031 ($MILLION)
TABLE 52. ITALY DECISION INTELLIGENCE MARKET, BY DEPLOYMENT MODE, 2021-2031 ($MILLION)
TABLE 53. ITALY DECISION INTELLIGENCE MARKET, BY ENTERPRISE SIZE, 2021-2031 ($MILLION)
TABLE 54. ITALY DECISION INTELLIGENCE MARKET, BY INDUSTRY VERTICAL, 2021-2031 ($MILLION)
TABLE 55. SPAIN DECISION INTELLIGENCE MARKET, BY COMPONENT, 2021-2031 ($MILLION)
TABLE 56. SPAIN DECISION INTELLIGENCE MARKET, BY DEPLOYMENT MODE, 2021-2031 ($MILLION)
TABLE 57. SPAIN DECISION INTELLIGENCE MARKET, BY ENTERPRISE SIZE, 2021-2031 ($MILLION)
TABLE 58. SPAIN DECISION INTELLIGENCE MARKET, BY INDUSTRY VERTICAL, 2021-2031 ($MILLION)
TABLE 59. REST OF EUROPE DECISION INTELLIGENCE MARKET, BY COMPONENT, 2021-2031 ($MILLION)
TABLE 60. REST OF EUROPE DECISION INTELLIGENCE MARKET, BY DEPLOYMENT MODE, 2021-2031 ($MILLION)
TABLE 61. REST OF EUROPE DECISION INTELLIGENCE MARKET, BY ENTERPRISE SIZE, 2021-2031 ($MILLION)
TABLE 62. REST OF EUROPE DECISION INTELLIGENCE MARKET, BY INDUSTRY VERTICAL, 2021-2031 ($MILLION)
TABLE 63. ASIA-PACIFIC DECISION INTELLIGENCE MARKET, BY COMPONENT, 2021-2031 ($MILLION)
TABLE 64. ASIA-PACIFIC DECISION INTELLIGENCE MARKET, BY DEPLOYMENT MODE, 2021-2031 ($MILLION)
TABLE 65. ASIA-PACIFIC DECISION INTELLIGENCE MARKET, BY ENTERPRISE SIZE, 2021-2031 ($MILLION)
TABLE 66. ASIA-PACIFIC DECISION INTELLIGENCE MARKET, BY INDUSTRY VERTICAL, 2021-2031 ($MILLION)
TABLE 67. ASIA-PACIFIC DECISION INTELLIGENCE MARKET, BY COUNTRY, 2021-2031 ($MILLION)
TABLE 68. CHINA DECISION INTELLIGENCE MARKET, BY COMPONENT, 2021-2031 ($MILLION)
TABLE 69. CHINA DECISION INTELLIGENCE MARKET, BY DEPLOYMENT MODE, 2021-2031 ($MILLION)
TABLE 70. CHINA DECISION INTELLIGENCE MARKET, BY ENTERPRISE SIZE, 2021-2031 ($MILLION)
TABLE 71. CHINA DECISION INTELLIGENCE MARKET, BY INDUSTRY VERTICAL, 2021-2031 ($MILLION)
TABLE 72. INDIA DECISION INTELLIGENCE MARKET, BY COMPONENT, 2021-2031 ($MILLION)
TABLE 73. INDIA DECISION INTELLIGENCE MARKET, BY DEPLOYMENT MODE, 2021-2031 ($MILLION)
TABLE 74. INDIA DECISION INTELLIGENCE MARKET, BY ENTERPRISE SIZE, 2021-2031 ($MILLION)
TABLE 75. INDIA DECISION INTELLIGENCE MARKET, BY INDUSTRY VERTICAL, 2021-2031 ($MILLION)
TABLE 76. JAPAN DECISION INTELLIGENCE MARKET, BY COMPONENT, 2021-2031 ($MILLION)
TABLE 77. JAPAN DECISION INTELLIGENCE MARKET, BY DEPLOYMENT MODE, 2021-2031 ($MILLION)
TABLE 78. JAPAN DECISION INTELLIGENCE MARKET, BY ENTERPRISE SIZE, 2021-2031 ($MILLION)
TABLE 79. JAPAN DECISION INTELLIGENCE MARKET, BY INDUSTRY VERTICAL, 2021-2031 ($MILLION)
TABLE 80. AUSTRALIA DECISION INTELLIGENCE MARKET, BY COMPONENT, 2021-2031 ($MILLION)
TABLE 81. AUSTRALIA DECISION INTELLIGENCE MARKET, BY DEPLOYMENT MODE, 2021-2031 ($MILLION)
TABLE 82. AUSTRALIA DECISION INTELLIGENCE MARKET, BY ENTERPRISE SIZE, 2021-2031 ($MILLION)
TABLE 83. AUSTRALIA DECISION INTELLIGENCE MARKET, BY INDUSTRY VERTICAL, 2021-2031 ($MILLION)
TABLE 84. SOUTH KOREA DECISION INTELLIGENCE MARKET, BY COMPONENT, 2021-2031 ($MILLION)
TABLE 85. SOUTH KOREA DECISION INTELLIGENCE MARKET, BY DEPLOYMENT MODE, 2021-2031 ($MILLION)
TABLE 86. SOUTH KOREA DECISION INTELLIGENCE MARKET, BY ENTERPRISE SIZE, 2021-2031 ($MILLION)
TABLE 87. SOUTH KOREA DECISION INTELLIGENCE MARKET, BY INDUSTRY VERTICAL, 2021-2031 ($MILLION)
TABLE 88. REST OF ASIA-PACIFIC DECISION INTELLIGENCE MARKET, BY COMPONENT, 2021-2031 ($MILLION)
TABLE 89. REST OF ASIA-PACIFIC DECISION INTELLIGENCE MARKET, BY DEPLOYMENT MODE, 2021-2031 ($MILLION)
TABLE 90. REST OF ASIA-PACIFIC DECISION INTELLIGENCE MARKET, BY ENTERPRISE SIZE, 2021-2031 ($MILLION)
TABLE 91. REST OF ASIA-PACIFIC DECISION INTELLIGENCE MARKET, BY INDUSTRY VERTICAL, 2021-2031 ($MILLION)
TABLE 92. LAMEA DECISION INTELLIGENCE MARKET, BY COMPONENT, 2021-2031 ($MILLION)
TABLE 93. LAMEA DECISION INTELLIGENCE MARKET, BY DEPLOYMENT MODE, 2021-2031 ($MILLION)
TABLE 94. LAMEA DECISION INTELLIGENCE MARKET, BY ENTERPRISE SIZE, 2021-2031 ($MILLION)
TABLE 95. LAMEA DECISION INTELLIGENCE MARKET, BY INDUSTRY VERTICAL, 2021-2031 ($MILLION)
TABLE 96. LAMEA DECISION INTELLIGENCE MARKET, BY COUNTRY, 2021-2031 ($MILLION)
TABLE 97. LATIN AMERICA DECISION INTELLIGENCE MARKET, BY COMPONENT, 2021-2031 ($MILLION)
TABLE 98. LATIN AMERICA DECISION INTELLIGENCE MARKET, BY DEPLOYMENT MODE, 2021-2031 ($MILLION)
TABLE 99. LATIN AMERICA DECISION INTELLIGENCE MARKET, BY ENTERPRISE SIZE, 2021-2031 ($MILLION)
TABLE 100. LATIN AMERICA DECISION INTELLIGENCE MARKET, BY INDUSTRY VERTICAL, 2021-2031 ($MILLION)
TABLE 101. MIDDLE EAST DECISION INTELLIGENCE MARKET, BY COMPONENT, 2021-2031 ($MILLION)
TABLE 102. MIDDLE EAST DECISION INTELLIGENCE MARKET, BY DEPLOYMENT MODE, 2021-2031 ($MILLION)
TABLE 103. MIDDLE EAST DECISION INTELLIGENCE MARKET, BY ENTERPRISE SIZE, 2021-2031 ($MILLION)
TABLE 104. MIDDLE EAST DECISION INTELLIGENCE MARKET, BY INDUSTRY VERTICAL, 2021-2031 ($MILLION)
TABLE 105. AFRICA DECISION INTELLIGENCE MARKET, BY COMPONENT, 2021-2031 ($MILLION)
TABLE 106. AFRICA DECISION INTELLIGENCE MARKET, BY DEPLOYMENT MODE, 2021-2031 ($MILLION)
TABLE 107. AFRICA DECISION INTELLIGENCE MARKET, BY ENTERPRISE SIZE, 2021-2031 ($MILLION)
TABLE 108. AFRICA DECISION INTELLIGENCE MARKET, BY INDUSTRY VERTICAL, 2021-2031 ($MILLION)
TABLE 109. GOOGLE LLC: KEY EXECUTIVES
TABLE 110. GOOGLE LLC: COMPANY SNAPSHOT
TABLE 111. GOOGLE LLC: SERVICE SEGMENTS
TABLE 112. GOOGLE LLC: PRODUCT PORTFOLIO
TABLE 113. GOOGLE LLC: KEY STRATERGIES
TABLE 114. INTERNATIONAL BUSINESS MACHINES CORPORATION: KEY EXECUTIVES
TABLE 115. INTERNATIONAL BUSINESS MACHINES CORPORATION: COMPANY SNAPSHOT
TABLE 116. INTERNATIONAL BUSINESS MACHINES CORPORATION: SERVICE SEGMENTS
TABLE 117. INTERNATIONAL BUSINESS MACHINES CORPORATION: PRODUCT PORTFOLIO
TABLE 118. INTERNATIONAL BUSINESS MACHINES CORPORATION: KEY STRATERGIES
TABLE 119. ORACLE CORPORATION: KEY EXECUTIVES
TABLE 120. ORACLE CORPORATION: COMPANY SNAPSHOT
TABLE 121. ORACLE CORPORATION: PRODUCT SEGMENTS
TABLE 122. ORACLE CORPORATION: PRODUCT PORTFOLIO
TABLE 123. ORACLE CORPORATION: KEY STRATERGIES
TABLE 124. MICROSOFT CORPORATION: KEY EXECUTIVES
TABLE 125. MICROSOFT CORPORATION: COMPANY SNAPSHOT
TABLE 126. MICROSOFT CORPORATION: SERVICE SEGMENTS
TABLE 127. MICROSOFT CORPORATION: PRODUCT PORTFOLIO
TABLE 128. MICROSOFT CORPORATION: KEY STRATERGIES
TABLE 129. BOARD INTERNATIONAL: KEY EXECUTIVES
TABLE 130. BOARD INTERNATIONAL: COMPANY SNAPSHOT
TABLE 131. BOARD INTERNATIONAL: PRODUCT SEGMENTS
TABLE 132. BOARD INTERNATIONAL: PRODUCT PORTFOLIO
TABLE 133. BOARD INTERNATIONAL: KEY STRATERGIES
TABLE 134. CLARIFAI, INC.: KEY EXECUTIVES
TABLE 135. CLARIFAI, INC.: COMPANY SNAPSHOT
TABLE 136. CLARIFAI, INC.: PRODUCT SEGMENTS
TABLE 137. CLARIFAI, INC.: PRODUCT PORTFOLIO
TABLE 138. CLARIFAI, INC.: KEY STRATERGIES
TABLE 139. DIWO.AI: KEY EXECUTIVES
TABLE 140. DIWO.AI: COMPANY SNAPSHOT
TABLE 141. DIWO.AI: PRODUCT SEGMENTS
TABLE 142. DIWO.AI: PRODUCT PORTFOLIO
TABLE 143. DIWO.AI: KEY STRATERGIES
TABLE 144. INTEL CORPORATION: KEY EXECUTIVES
TABLE 145. INTEL CORPORATION: COMPANY SNAPSHOT
TABLE 146. INTEL CORPORATION: SERVICE SEGMENTS
TABLE 147. INTEL CORPORATION: PRODUCT PORTFOLIO
TABLE 148. INTEL CORPORATION: KEY STRATERGIES
TABLE 149. H2O.AI: KEY EXECUTIVES
TABLE 150. H2O.AI: COMPANY SNAPSHOT
TABLE 151. H2O.AI: SERVICE SEGMENTS
TABLE 152. H2O.AI: PRODUCT PORTFOLIO
TABLE 153. H2O.AI: KEY STRATERGIES
TABLE 154. METAPHACTS GMBH: KEY EXECUTIVES
TABLE 155. METAPHACTS GMBH: COMPANY SNAPSHOT
TABLE 156. METAPHACTS GMBH: PRODUCT SEGMENTS
TABLE 157. METAPHACTS GMBH: PRODUCT PORTFOLIO
TABLE 158. METAPHACTS GMBH: KEY STRATERGIES
LIST OF FIGURES
FIGURE 01. DECISION INTELLIGENCE MARKET, 2021-2031
FIGURE 02. SEGMENTATION OF DECISION INTELLIGENCE MARKET, 2021-2031
FIGURE 03. TOP INVESTMENT POCKETS IN DECISION INTELLIGENCE MARKET (2022-2031)
FIGURE 04. LOW BARGAINING POWER OF SUPPLIERS
FIGURE 05. LOW BARGAINING POWER OF BUYERS
FIGURE 06. LOW THREAT OF SUBSTITUTES
FIGURE 07. LOW THREAT OF NEW ENTRANTS
FIGURE 08. LOW INTENSITY OF RIVALRY
FIGURE 09. DRIVERS, RESTRAINTS AND OPPORTUNITIES: GLOBALDECISION INTELLIGENCE MARKET
FIGURE 10. DECISION INTELLIGENCE MARKET, BY COMPONENT, 2021(%)
FIGURE 11. COMPARATIVE SHARE ANALYSIS OF DECISION INTELLIGENCE MARKET FOR PLATFORM, BY COUNTRY 2021-2031(%)
FIGURE 12. COMPARATIVE SHARE ANALYSIS OF DECISION INTELLIGENCE MARKET FOR SOLUTIONS, BY COUNTRY 2021-2031(%)
FIGURE 13. COMPARATIVE SHARE ANALYSIS OF DECISION INTELLIGENCE MARKET FOR SERVICES, BY COUNTRY 2021-2031(%)
FIGURE 14. DECISION INTELLIGENCE MARKET, BY DEPLOYMENT MODE, 2021(%)
FIGURE 15. COMPARATIVE SHARE ANALYSIS OF DECISION INTELLIGENCE MARKET FOR ON-PREMISE, BY COUNTRY 2021-2031(%)
FIGURE 16. COMPARATIVE SHARE ANALYSIS OF DECISION INTELLIGENCE MARKET FOR CLOUD, BY COUNTRY 2021-2031(%)
FIGURE 17. DECISION INTELLIGENCE MARKET, BY ENTERPRISE SIZE, 2021(%)
FIGURE 18. COMPARATIVE SHARE ANALYSIS OF DECISION INTELLIGENCE MARKET FOR LARGE ENTERPRISE, BY COUNTRY 2021-2031(%)
FIGURE 19. COMPARATIVE SHARE ANALYSIS OF DECISION INTELLIGENCE MARKET FOR SMALL AND MEDIUM-SIZED ENTERPRISES (SMES), BY COUNTRY 2021-2031(%)
FIGURE 20. DECISION INTELLIGENCE MARKET, BY INDUSTRY VERTICAL, 2021(%)
FIGURE 21. COMPARATIVE SHARE ANALYSIS OF DECISION INTELLIGENCE MARKET FOR ENERGY AND UTILITIES, BY COUNTRY 2021-2031(%)
FIGURE 22. COMPARATIVE SHARE ANALYSIS OF DECISION INTELLIGENCE MARKET FOR BFSI, BY COUNTRY 2021-2031(%)
FIGURE 23. COMPARATIVE SHARE ANALYSIS OF DECISION INTELLIGENCE MARKET FOR IT AND TELECOM, BY COUNTRY 2021-2031(%)
FIGURE 24. COMPARATIVE SHARE ANALYSIS OF DECISION INTELLIGENCE MARKET FOR GOVERNMENT, BY COUNTRY 2021-2031(%)
FIGURE 25. COMPARATIVE SHARE ANALYSIS OF DECISION INTELLIGENCE MARKET FOR HEALTHCARE, BY COUNTRY 2021-2031(%)
FIGURE 26. COMPARATIVE SHARE ANALYSIS OF DECISION INTELLIGENCE MARKET FOR MANUFACTURING, BY COUNTRY 2021-2031(%)
FIGURE 27. COMPARATIVE SHARE ANALYSIS OF DECISION INTELLIGENCE MARKET FOR RETAIL AND CONSUMER GOODS, BY COUNTRY 2021-2031(%)
FIGURE 28. COMPARATIVE SHARE ANALYSIS OF DECISION INTELLIGENCE MARKET FOR OTHERS, BY COUNTRY 2021-2031(%)
FIGURE 29. DECISION INTELLIGENCE MARKET BY REGION, 2021
FIGURE 30. U.S. DECISION INTELLIGENCE MARKET, 2021-2031 ($MILLION)
FIGURE 31. CANADA DECISION INTELLIGENCE MARKET, 2021-2031 ($MILLION)
FIGURE 32. UK DECISION INTELLIGENCE MARKET, 2021-2031 ($MILLION)
FIGURE 33. GERMANY DECISION INTELLIGENCE MARKET, 2021-2031 ($MILLION)
FIGURE 34. FRANCE DECISION INTELLIGENCE MARKET, 2021-2031 ($MILLION)
FIGURE 35. ITALY DECISION INTELLIGENCE MARKET, 2021-2031 ($MILLION)
FIGURE 36. SPAIN DECISION INTELLIGENCE MARKET, 2021-2031 ($MILLION)
FIGURE 37. REST OF EUROPE DECISION INTELLIGENCE MARKET, 2021-2031 ($MILLION)
FIGURE 38. CHINA DECISION INTELLIGENCE MARKET, 2021-2031 ($MILLION)
FIGURE 39. INDIA DECISION INTELLIGENCE MARKET, 2021-2031 ($MILLION)
FIGURE 40. JAPAN DECISION INTELLIGENCE MARKET, 2021-2031 ($MILLION)
FIGURE 41. AUSTRALIA DECISION INTELLIGENCE MARKET, 2021-2031 ($MILLION)
FIGURE 42. SOUTH KOREA DECISION INTELLIGENCE MARKET, 2021-2031 ($MILLION)
FIGURE 43. REST OF ASIA-PACIFIC DECISION INTELLIGENCE MARKET, 2021-2031 ($MILLION)
FIGURE 44. LATIN AMERICA DECISION INTELLIGENCE MARKET, 2021-2031 ($MILLION)
FIGURE 45. MIDDLE EAST DECISION INTELLIGENCE MARKET, 2021-2031 ($MILLION)
FIGURE 46. AFRICA DECISION INTELLIGENCE MARKET, 2021-2031 ($MILLION)
FIGURE 47. TOP WINNING STRATEGIES, BY YEAR
FIGURE 48. TOP WINNING STRATEGIES, BY DEVELOPMENT
FIGURE 49. TOP WINNING STRATEGIES, BY COMPANY
FIGURE 50. PRODUCT MAPPING OF TOP 10 PLAYERS
FIGURE 51. COMPETITIVE DASHBOARD
FIGURE 52. COMPETITIVE HEATMAP: DECISION INTELLIGENCE MARKET
FIGURE 53. TOP PLAYER POSITIONING, 2021
FIGURE 54. GOOGLE LLC: NET REVENUE, 2019-2021 ($MILLION)
FIGURE 55. GOOGLE LLC: REVENUE SHARE BY SEGMENT, 2021 (%)
FIGURE 56. GOOGLE LLC: REVENUE SHARE BY REGION, 2021 (%)
FIGURE 57. IBM CORPORATION: NET REVENUE, 2019-2021 ($MILLION)
FIGURE 58. IBM CORPORATION: REVENUE SHARE BY SEGMENT, 2021 (%)
FIGURE 59. IBM CORPORATION: REVENUE SHARE BY REGION, 2021 (%)
FIGURE 60. ORACLE CORPORATION: NET REVENUE, 2020-2022 ($MILLION)
FIGURE 61. ORACLE CORPORATION: RESEARCH & DEVELOPMENT EXPENDITURE, 2020-2022
FIGURE 62. ORACLE CORPORATION: REVENUE SHARE BY SEGMENT, 2022 (%)
FIGURE 63. ORACLE CORPORATION: REVENUE SHARE BY REGION, 2022 (%)
FIGURE 64. MICROSOFT CORPORATION: NET REVENUE, 2020-2022 ($MILLION)
FIGURE 65. MICROSOFT CORPORATION: RESEARCH & DEVELOPMENT EXPENDITURE, 2020-2022 ($MILLION)
FIGURE 66. MICROSOFT CORPORATION: REVENUE SHARE BY SEGMENT, 2022 (%)
FIGURE 67. MICROSOFT CORPORATION: REVENUE SHARE BY REGION, 2022 (%)
FIGURE 68. INTEL CORPORATION: RESEARCH & DEVELOPMENT EXPENDITURE, 2020-2022 ($MILLION)
FIGURE 69. INTEL CORPORATION: NET REVENUE, 2020-2022 ($MILLION)
FIGURE 70. INTEL CORPORATION: REVENUE SHARE BY SEGMENT, 2022 (%)
FIGURE 71. INTEL CORPORATION: REVENUE SHARE BY REGION, 2022 (%)
$5730
$6450
$9600
HAVE A QUERY?
OUR CUSTOMER

SIMILAR REPORTS
Add to Cart
Add to Cart
Add to Cart
Add to Cart