
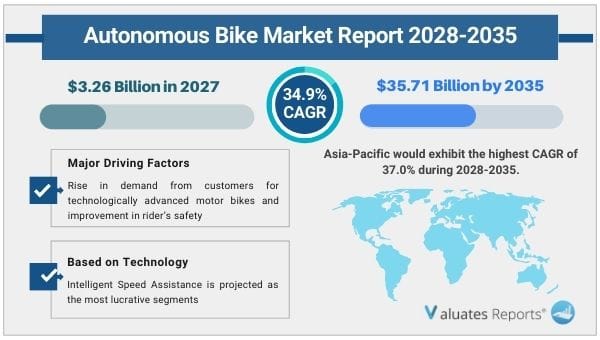
The global autonomous bike market was valued at $3.26 billion in 2027, and is projected to reach $35.71 billion by 2035, registering a CAGR of 34.9% from 2028 to 2035. Factors such as rise in demand from customers for technologically advanced motor bikes and improvement in rider’s safety are expected to notably contribute toward the growth of the autonomous bike market during the forecast period. However, concerns about inaccuracy & calibration as well as design issues in autonomous vehicles and high costs associated with the operation of autonomous bikes are anticipated to hamper the growth of the market. On the contrary, increase in initiatives regarding the design & development of innovative systems and rise in installation of smart technologies in motorbikes are expected to offer lucrative opportunities for the global autonomous bike market in the near future.
An autonomous vehicle is one that is capable to function itself and perform the required operations without involving any human involvement, by utilizing its ability to detect its environments. While autonomous cars are expected to be introduced soon, various companies such as Yamaha, Kawasaki, BMW, Honda, and Ford are involved in developing autonomous bikes. In addition, few colleges and universities, such as Michigan Institute of Technology (MIT), are also involved in making autonomous bikes across the world.
An autonomous bike makes use of gyroscopes and accelerometers or it counts on a flexible rake angle of the front tire and a motor for the handlebar to balance itself. Similar to other autonomous automobiles, an autonomous motorcycle may possibly use cutting-edge sensor technology, artificial intelligence (AI), and wireless connectivity to balance the vehicle without any intervention by a driver. Although bikes may not balance and drive themselves as of now, they are on the edge of becoming simpler to drive both for learners and skilled riders alike. Moreover, autonomous bikes are expected to ensure high safety on roads, and continuous developments in enhancing the technologies will augment the usability of autonomous bikes over the years.
In line with the efforts regarding the development of autonomous bikes, some of the potential bike manufacturers have showcased their autonomous bikes in the past years. For instance, in January 2017, Honda unveiled its self-balancing concept bike. In September 2018, BMW presented its first autonomous motorbike BMW R 1200 GS at the BMW Motorrad Techday. Increase in efforts by global players in making autonomous bikes is expected to boost the development of the global autonomous bike market during the forecast period.
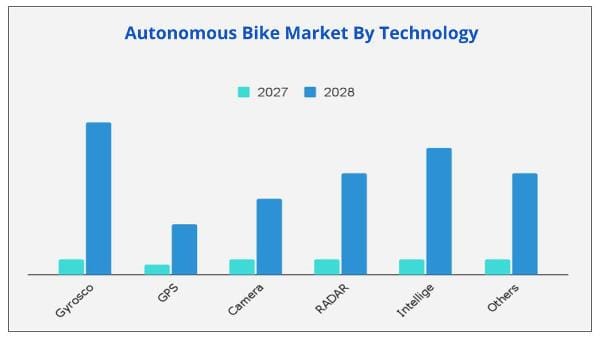
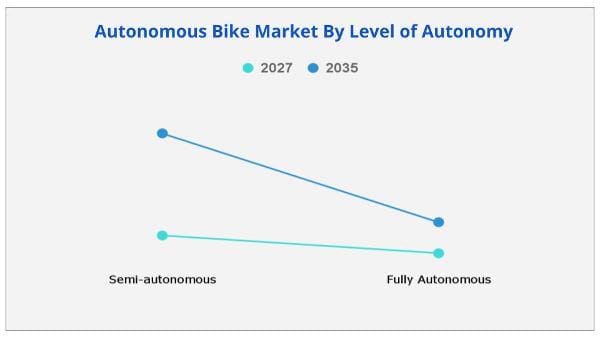
The global autonomous bike market is segmented into technology, level of autonomy, vehicle type, and region. Depending on technology, the market is fragmented into gyroscope, GPS, camera, RADAR, intelligent speed assistance, and others. By level of autonomy, it is categorized into semi-autonomous and fully autonomous. On the basis of vehicle type, it is segregated into motorcycle, kick scooter, and e-bicycle. Region wise, the market is analyzed across North America, Europe, Asia-Pacific, and LAMEA.
The key players operating in the global autonomous bike market include BMW Group, Flo Mobility Private Limited, Go X Apollo, Honda Motor Co., Ltd., IAV, Kawasaki Heavy Industries, Ltd., Refraction AI, Spin, Tortoise, and Yamaha Motor Co., Ltd.
Motorbikes are the most used conveyance option to travel from one location to another. They let the riders move through constricted spaces, are fast & highly maneuverable, and offer a thrilling experience while traveling on different terrains. Over the years, different kinds of motorcycles such as sport bikes, cruiser bikes, touring bikes, and mopeds have been launched to cater to different customer needs. The buyers of motorcycles have well-accepted electric bikes, which is increasing the penetration of electric bikes globally. Furthermore, electric bikes produce zero emissions, superior power output, reduced maintenance, and offer unique designs, which are expected to boost their demand over the years.
With an increasing number of cars being fitted with advanced navigation, infotainment, telematics, and autonomous technologies, the demand for such features in bikes is anticipated to increase in the coming years. While a rising number of companies are installing features such as GPS and connected bikes, some companies are developing autonomous bikes that will offer a superior driving experience to riders.
Battery-powered autonomous bikes will be capable of self-balancing and will be able to stand upright even at extremely low speeds. By installing state-of-the-art sensor systems and AI technologies, bikes would offer features that will cater to the requirements of a skilled as well as an untrained rider. Hence, rise in demand for technologically advanced bikes is expected to propel the growth of the global autonomous bike market during the forecast timeframe.
Manufacturers of autonomous bikes are developing models that ensure improved safety of riders. Yearly, millions of motorcyclists encounter crashes in the U.S. alone. According to data publicized by the National Highway Traffic Safety Administration (NHTSA), a total of 6,756,000 police-reported motor vehicle traffic crashes were recorded in 2019. The recent boom in the development of driver assistance technology is expected to improve the safety of motorcycle riders in the near future. Moreover, the incorporation of a self-balancing feature in motorcycles will not only prevent the riders from falling during accidents but also prevent them from experiencing roll-over wounds. With surge in demand for safer bikes, autonomous bikes are expected to gain high traction over the years, which, in turn, will augment the growth of the global market.
Bikes are highly susceptible to road conditions, and even minor deformities on the roads can lead to drastic accidents. Fitting motorcycles and scooters with modern technologies such as LiDAR and highly accurate geographical data can help them in having a better understanding of the characteristics of any road, letting their AI systems adapt their driving actions based on changes in road conditions, for instance, minor bumps and depressions. With the advancement in technologies that are being tested for autonomous bikes, riding them is expected to become safer and more efficient over the years. Thus, improvement in rider’s safety is anticipated to notably contribute toward the growth of the global market.
Sensors are crucial components of the current fleet of automobiles. They are critically important to enable a whole lot of things in a vehicle, for instance, from existing advanced driver-assistance systems (ADAS) features and automated braking & lane keeping. For highly automated vehicles, the accuracy of sensors becomes more critical. Satisfactorily safe and high accuracy is of utmost importance, and calibration ensures that the vehicle’s sensors are operating at the highest reliability.
Sensors can often get out of calibration due to their daily usage, standard vibrations, vehicle part replacements, or variations in environmental conditions such as temperature. While vehicles getting out of calibration is quite an issue, no common metrics exist as of today that can measure the miscalibration and there are no specific standards that firms can follow. All manufacturers have their own exclusive sensor suites and a complementary set of unique calibration procedures, which further complicates the issues. In addition, a typical ADAS calibration procedure can last anywhere between 15 minutes to 2 hours and necessitates costly equipment. Furthermore, the automobile itself needs to be prepared for thorough testing and recalibration. For instance, tires must be appropriately inflated, the fuel tank has to be full, and vehicle must stand totally flat on a balanced surface. Most garages and technicians are under-prepared and unsatisfactorily skilled to perform a tedious and intricate method. This eventually leads to unsuitable calibration that risks the life of the vehicle’s passengers. Hence, inaccuracy and calibration issues in autonomous vehicles are expected to hinder the growth of the global autonomous bike market during the forecast period.
Leading motorcycle manufacturers have made significant technological advancements in the design of autonomous bikes to make them more efficient, responsive, and safe. In recent years, several companies have revealed their concept design of autonomous bikes. The manufacturers such as BMW, Kawasaki, Honda, and Yamaha are designing autonomous bikes by leveraging advanced AI and self-balancing technologies to enable the bikes to detect and act instantaneously according to the variations in the environment. For instance, in 2017, AB Dynamics and AutoRD showcased the Autonomous BMW C1 calling it the world's first self-driving motorbike. It is equipped with autonomous software, sensors, rebalancing technology, radio controls, and GPS, through which it can drive without a rider. In the same year, Yamaha displayed MOTOROiD—a proof-of-concept model that leverages self-balancing technology and artificial intelligence. MOTOROiD is able to identify motions, making it possible for MOTOROiD to respond to hand movements, for instance, using a raised-up palm to instruct it to start or stop moving. One more example of an autonomous motorcycle is riding Assist-e designed by Honda. It is a self-balancing bike, which implies that it can adjust the center of gravity without the rider’s intervention. Many companies are putting their efforts into making autonomous bikes available to customers in the near future. Such initiatives are anticipated to bolster the growth of the global autonomous bike market.
By Technology
By Level of Autonomy
By Vehicle Type
By Region
Key Players
|
Report Metric |
Details |
|
Report Name |
Autonomous Bike Market |
|
The market size in 2027 |
USD 3.26 Billion |
|
The revenue forecast in 2035 |
USD 35.71 Billion |
|
Growth Rate |
CAGR of 34.9% from 2028 to 2035 |
|
Market size available for years |
2028-2035 |
|
Forecast units |
Value (USD) |
|
Segments covered |
Technology, Level of Autonomy, Vehicle Type, and Region |
|
Report coverage |
Revenue & volume forecast, company share, competitive landscape, growth factors, and trends |
|
Geographic regions covered |
North America, Europe, Asia Pacific, Latin America, Middle East & Africa |
Ans. The global autonomous bike market was valued at $3.26 billion in 2027, and is projected to reach $35.71 billion by 2035, registering a CAGR of 34.9% from 2028 to 2035.
Ans. The upcoming trends includes the introduction of self driving concept in bicycles & scooters which is expected to create an impact on the autonomous bike market.
Ans. Technology is the most influencing segment in the growing in the autonomous bike market.
Ans. North America is and will provide more business opportunities for autonomous bikes in future.
Table of Content
CHAPTER 1:INTRODUCTION
1.1.Report description
1.2.Key benefits for stakeholders
1.3.Key market segments
1.4.Research methodology
1.4.1.Primary research
1.4.2.Secondary research
1.4.3.Analyst tools and models
CHAPTER 2:EXECUTIVE SUMMARY
2.1.CXO perspective
CHAPTER 3:MARKET OVERVIEW
3.1.Market definition and scope
3.2.Key findings
3.2.1.Top impacting factors
3.2.2.Top investment pockets
3.2.3.Top winning strategies
3.3.Porter’s five forces analysis
3.4.Key player positioning, 2020
3.5.Market dynamics
3.5.1.Drivers
3.5.1.1.Rising demand from customers for technologically advanced motor bikes
3.5.1.2.Improvement in rider’s safety
3.5.2.Restraints
3.5.2.1.Inaccuracy and calibration issues in autonomous vehicles
3.5.2.2.Design issues and high costs associated with the operation of autonomous bikes
3.5.3.Opportunities
3.5.3.1.Increasing initiatives regarding the design and development of innovative systems
3.5.3.2.Rising installation of smart technologies in motorbikes
CHAPTER 4:AUTONOMOUS BIKE MARKET, BY TECHNOLOGY
4.1.Overview
4.2.Gyroscope
4.2.1.Key market trends, growth factors, and opportunities
4.2.2.Market size and forecast, by region
4.2.3.Market analysis, by country
4.3.GPS
4.3.1.Key market trends, growth factors, and opportunities
4.3.2.Market size and forecast, by region
4.3.3.Market analysis, by country
4.4.Camera
4.4.1.Key market trends, growth factors, and opportunities
4.4.2.Market size and forecast, by region
4.4.3.Market analysis, by country
4.5.RADAR
4.5.1.Key market trends, growth factors, and opportunities
4.5.2.Market size and forecast, by region
4.5.3.Market analysis, by country
4.6.Intelligent speed assistance
4.6.1.Key market trends, growth factors, and opportunities
4.6.2.Market size and forecast, by region
4.6.3.Market analysis, by country
4.7.Others
4.7.1.Key market trends, growth factors, and opportunities
4.7.2.Market size and forecast, by region
4.7.3.Market analysis, by country
CHAPTER 5:AUTONOMOUS BIKE MARKET, BY LEVEL OF AUTONOMY
5.1.Overview
5.2.Semi-autonomous
5.2.1.Key market trends, growth factors, and opportunities
5.2.2.Market size and forecast, by region
5.2.3.Market analysis, by country
5.3.Fully-autonomous
5.3.1.Key market trends, growth factors, and opportunities
5.3.2.Market size and forecast, by region
5.3.3.Market analysis, by country
CHAPTER 6:.AUTONOMOUS BIKE MARKET, BY VEHICLE TYPE
6.1.Overview
6.2.Motorcycle
6.2.1.Key market trends, growth factors, and opportunities
6.2.2.Market size and forecast, by region
6.2.3.Market analysis, by country
6.3.Kick-scooter
6.3.1.Key market trends, growth factors, and opportunities
6.3.2.Market size and forecast, by region
6.3.3.Market analysis, by country
6.4.E-bicycle
6.4.1.Key market trends, growth factors, and opportunities
6.4.2.Market size and forecast, by region
6.4.3.Market analysis, by country
CHAPTER 7:AUTONOMOUS BIKE MARKET, BY REGION
7.1.Overview
7.2.North America
7.2.1.Key market trends, growth factors, and opportunities
7.2.2.Market size and forecast, by technology
7.2.3.Market size and forecast, by level of autonomy
7.2.4.Market size and forecast, by vehicle type
7.2.5.Market analysis by country
7.2.5.1.U.S.
7.2.5.1.1.Market size and forecast, by technology
7.2.5.1.2.Market size and forecast, by level of autonomy
7.2.5.1.3.Market size and forecast, by vehicle type
7.2.5.2.Canada
7.2.5.2.1.Market size and forecast, by technology
7.2.5.2.2.Market size and forecast, by level of autonomy
7.2.5.2.3.Market size and forecast, by vehicle type
7.2.5.3.Mexico
7.2.5.3.1.Market size and forecast, by technology
7.2.5.3.2.Market size and forecast, by level of autonomy
7.2.5.3.3.Market size and forecast, by vehicle type
7.3.Europe
7.3.1.Key market trends, growth factors, and opportunities
7.3.2.Market size and forecast, by technology
7.3.3.Market size and forecast, by level of autonomy
7.3.4.Market size and forecast, by vehicle type
7.3.5.Market analysis by country
7.3.5.1.Germany
7.3.5.1.1.Market size and forecast, by technology
7.3.5.1.2.Market size and forecast, by level of autonomy
7.3.5.1.3.Market size and forecast, by vehicle type
7.3.5.2.France
7.3.5.2.1.Market size and forecast, by technology
7.3.5.2.2.Market size and forecast, by level of autonomy
7.3.5.2.3.Market size and forecast, by vehicle type
7.3.5.3.UK
7.3.5.3.1.Market size and forecast, by technology
7.3.5.3.2.Market size and forecast, by level of autonomy
7.3.5.3.3.Market size and forecast, by vehicle type
7.3.5.4.Italy
7.3.5.4.1.Market size and forecast, by technology
7.3.5.4.2.Market size and forecast, by level of autonomy
7.3.5.4.3.Market size and forecast, by vehicle type
7.3.5.5.Rest of Europe
7.3.5.5.1.Market size and forecast, by technology
7.3.5.5.2.Market size and forecast, by level of autonomy
7.3.5.5.3.Market size and forecast, by vehicle type
7.4.Asia-Pacific
7.4.1.Key market trends, growth factors, and opportunities
7.4.2.Market size and forecast, by technology
7.4.3.Market size and forecast, by level of autonomy
7.4.4.Market size and forecast, by vehicle type
7.4.5.Market analysis by country
7.4.5.1.China
7.4.5.1.1.Market size and forecast, by technology
7.4.5.1.2.Market size and forecast, by level of autonomy
7.4.5.1.3.Market size and forecast, by vehicle type
7.4.5.2.Japan
7.4.5.2.1.Market size and forecast, by technology
7.4.5.2.2.Market size and forecast, by level of autonomy
7.4.5.2.3.Market size and forecast, by vehicle type
7.4.5.3.India
7.4.5.3.1.Market size and forecast, by technology
7.4.5.3.2.Market size and forecast, by level of autonomy
7.4.5.3.3.Market size and forecast, by vehicle type
7.4.5.4.South Korea
7.4.5.4.1.Market size and forecast, by technology
7.4.5.4.2.Market size and forecast, by level of autonomy
7.4.5.4.3.Market size and forecast, by vehicle type
7.4.5.5.Rest of Asia-Pacific
7.4.5.5.1.Market size and forecast, by technology
7.4.5.5.2.Market size and forecast, by level of autonomy
7.4.5.5.3.Market size and forecast, by vehicle type
7.5.LAMEA
7.5.1.Key market trends, growth factors, and opportunities
7.5.2.Market size and forecast, by technology
7.5.3.Market size and forecast, by level of autonomy
7.5.4.Market size and forecast, by vehicle type
7.5.5.Market analysis by country
7.5.5.1.Latin America
7.5.5.1.1.Market size and forecast, by technology
7.5.5.1.2.Market size and forecast, by level of autonomy
7.5.5.1.3.Market size and forecast, by vehicle type
7.5.5.2.Middle East
7.5.5.2.1.Market size and forecast, by technology
7.5.5.2.2.Market size and forecast, by level of autonomy
7.5.5.2.3.Market size and forecast, by vehicle type
7.5.5.3.Africa
7.5.5.3.1.Market size and forecast, by technology
7.5.5.3.2.Market size and forecast, by level of autonomy
7.5.5.3.3.Market size and forecast, by vehicle type
CHAPTER 8:COMPANY PROFILES
8.1.BMW GROUP
8.1.1.Company overview
8.1.2.Key executives
8.1.3.Company snapshot
8.1.4.Operating business segments
8.1.5.Product portfolio
8.1.6.R&D expenditure
8.1.7.Business performance
8.1.8.Key strategic moves and developments
8.2.FLO MOBILITY PRIVATE LIMITED
8.2.1.Company overview
8.2.2.Key executives
8.2.3.Company snapshot
8.2.4.Product portfolio
8.3.GO X APOLLO
8.3.1.Company overview
8.3.2.Key executives
8.3.3.Company snapshot
8.3.4.Product portfolio
8.4.HONDA MOTOR CO., LTD.
8.4.1.Company overview
8.4.2.Key executives
8.4.3.Company snapshot
8.4.4.Operating business segments
8.4.5.Product portfolio
8.4.6.R&D expenditure
8.4.7.Business performance
8.4.8.Key strategic moves and developments
8.5.IAV
8.5.1.Company overview
8.5.2.Key executives
8.5.3.Company snapshot
8.5.4.Product portfolio
8.5.5.Key strategic moves and developments
8.6.KAWASAKI HEAVY INDUSTRIES, LTD.
8.6.1.Company overview
8.6.2.Key executives
8.6.3.Company snapshot
8.6.4.Operating business segments
8.6.5.Product portfolio
8.6.6.R&D expenditure
8.6.7.Business performance
8.6.8.Key strategic moves and developments
8.7.REFRACTION AI
8.7.1.Company overview
8.7.2.Key executives
8.7.3.Company snapshot
8.7.4.Product portfolio
8.8.SPIN
8.8.1.Company overview
8.8.2.Key executives
8.8.3.Company snapshot
8.8.4.Product portfolio
8.8.5.Key strategic moves and developments
8.9.TORTOISE
8.9.1.Company overview
8.9.2.Key executives
8.9.3.Company snapshot
8.9.4.Product portfolio
8.9.5.Key strategic moves and developments
8.10.YAMAHA MOTOR CO., LTD.
8.10.1.Company overview
8.10.2.Key executives
8.10.3.Company snapshot
8.10.4.Operating business segments
8.10.5.Product portfolio
8.10.6.R&D expenditure
8.10.7.Business performance
8.10.8.Key strategic moves and developments
List of Tables & Figures
Table 01.Autonomous Bike Market, By Technology, 2027–2035 ($Million)
Table 02.Autonomous Bike Market For Gyroscope, By Region 2027–2035 ($Million)
Table 03.Autonomous Bike Market For Gps, By Region 2027–2035 ($Million)
Table 04.Autonomous Bike Market For Camera, By Region 2027–2035 ($Million)
Table 05.Autonomous Bike Market For Radar, By Region 2027–2035 ($Million)
Table 06.Autonomous Bike Market For Intelligent Speed Assistance, By Region 2027–2035 ($Million)
Table 07.Autonomous Bike Market For Others, By Region 2027–2035 ($Million)
Table 08.Autonomous Bike Market, By Level Of Autonomy, 2027–2035 ($Million)
Table 09.Autonomous Bike Market For Semi-autonomous, By Region 2027–2035 ($Million)
Table 10.Autonomous Bike Market For Fully-autonomous, By Region 2027–2035 ($Million)
Table 11.Autonomous Bike Market, By Vehicle Type, 2027–2035 ($Million)
Table 12.Autonomous Bike Market For Motorcycle, By Region 2027–2035 ($Million)
Table 13.Autonomous Bike Market For Kick-scooter, By Region 2027–2035 ($Million)
Table 14.Autonomous Bike Market For E-bicycle, By Region 2027–2035 ($Million)
Table 15.Autonomous Bike Market, By Region, 2027–2035 ($Million)
Table 16.North America Autonomous Bike Market, By Technology, 2027–2035 ($Million)
Table 17.North America Autonomous Bike Market, By Level Of Autonomy, 2027–2035 ($Million)
Table 18.North America Autonomous Bike Market, By Vehicle Type, 2027–2035 ($Million)
Table 19.U.S. Autonomous Bike Market, By Technology, 2027–2035 ($Million)
Table 20.U.S. Autonomous Bike Market, By Level Of Autonomy, 2027–2035 ($Million)
Table 21.U.S. Autonomous Bike Market, By Vehicle Type, 2027–2035 ($Million)
Table 22.Canada Autonomous Bike Market, By Technology, 2027–2035 ($Million)
Table 23.Canada Autonomous Bike Market, By Level Of Autonomy, 2027–2035 ($Million)
Table 24.Canada Autonomous Bike Market, By Vehicle Type, 2027–2035 ($Million)
Table 25.Mexico Autonomous Bike Market, By Technology, 2027–2035 ($Million)
Table 26.Mexico Autonomous Bike Market, By Level Of Autonomy, 2027–2035 ($Million)
Table 27.Mexico Autonomous Bike Market, By Vehicle Type, 2027–2035 ($Million)
Table 28.Europe Autonomous Bike Market, By Technology, 2027–2035 ($Million)
Table 29.Europe Autonomous Bike Market, By Level Of Autonomy, 2027–2035 ($Million)
Table 30.Europe Autonomous Bike Market, By Vehicle Type, 2027–2035 ($Million)
Table 31.Germany Autonomous Bike Market, By Technology, 2027–2035 ($Million)
Table 32.Germany Autonomous Bike Market, By Level Of Autonomy, 2027–2035 ($Million)
Table 33.Germany Autonomous Bike Market, By Vehicle Type, 2027–2035 ($Million)
Table 34.France Autonomous Bike Market, By Technology, 2027–2035 ($Million)
Table 35.France Autonomous Bike Market, By Level Of Autonomy, 2027–2035 ($Million)
Table 36.France Autonomous Bike Market, By Vehicle Type, 2027–2035 ($Million)
Table 37.Uk Autonomous Bike Market, By Technology, 2027–2035 ($Million)
Table 38.Uk Autonomous Bike Market, By Level Of Autonomy, 2027–2035 ($Million)
Table 39.Uk Autonomous Bike Market, By Vehicle Type, 2027–2035 ($Million)
Table 40.Italy Autonomous Bike Market, By Technology, 2027–2035 ($Million)
Table 41.Italy Autonomous Bike Market, By Level Of Autonomy, 2027–2035 ($Million)
Table 42.Italy Autonomous Bike Market, By Vehicle Type, 2027–2035 ($Million)
Table 43.Rest Of Europe Autonomous Bike Market, By Technology, 2027–2035 ($Million)
Table 44.Rest Of Europe Autonomous Bike Market, By Level Of Autonomy, 2027–2035 ($Million)
Table 45.Rest Of Europe Autonomous Bike Market, By Vehicle Type, 2027–2035 ($Million)
Table 46.Asia-pacific Autonomous Bike Market, By Technology, 2027–2035 ($Million)
Table 47.Asia-pacific Autonomous Bike Market, By Level Of Autonomy, 2027–2035 ($Million)
Table 48.Asia-pacific Autonomous Bike Market, By Vehicle Type, 2027–2035 ($Million)
Table 49.China Autonomous Bike Market, By Technology, 2027–2035 ($Million)
Table 50.China Autonomous Bike Market, By Level Of Autonomy, 2027–2035 ($Million)
Table 51.China Autonomous Bike Market, By Vehicle Type, 2027–2035 ($Million)
Table 52.Japan Autonomous Bike Market, By Technology, 2027–2035 ($Million)
Table 53.Japan Autonomous Bike Market, By Level Of Autonomy, 2027–2035 ($Million)
Table 54.Japan Autonomous Bike Market, By Vehicle Type, 2027–2035 ($Million)
Table 55.India Autonomous Bike Market, By Technology, 2027–2035 ($Million)
Table 56.India Autonomous Bike Market, By Level Of Autonomy, 2027–2035 ($Million)
Table 57.India Autonomous Bike Market, By Vehicle Type, 2027–2035 ($Million)
Table 58.South Korea Autonomous Bike Market, By Technology, 2027–2035 ($Million)
Table 59.South Korea Autonomous Bike Market, By Level Of Autonomy, 2027–2035 ($Million)
Table 60.South Korea Autonomous Bike Market, By Vehicle Type, 2027–2035 ($Million)
Table 61.Rest Of Asia-pacific Autonomous Bike Market, By Technology, 2027–2035 ($Million)
Table 62.Rest Of Asia-pacific Autonomous Bike Market, By Level Of Autonomy, 2027–2035 ($Million)
Table 63.Rest Of Asia-pacific Autonomous Bike Market, By Vehicle Type, 2027–2035 ($Million)
Table 64.Lamea Autonomous Bike Market, By Technology, 2027–2035 ($Million)
Table 65.Lamea Autonomous Bike Market, By Level Of Autonomy, 2027–2035 ($Million)
Table 66.Lamea Autonomous Bike Market, By Vehicle Type, 2027–2035 ($Million)
Table 67.Latin America Autonomous Bike Market, By Technology, 2027–2035 ($Million)
Table 68.Latin America Autonomous Bike Market, By Level Of Autonomy, 2027–2035 ($Million)
Table 69.Latin America Autonomous Bike Market, By Vehicle Type, 2027–2035 ($Million)
Table 70.Middle East Autonomous Bike Market, By Technology, 2027–2035 ($Million)
Table 71.Middle East Autonomous Bike Market, By Level Of Autonomy, 2027–2035 ($Million)
Table 72.Middle East Autonomous Bike Market, By Vehicle Type, 2027–2035 ($Million)
Table 73.Africa Autonomous Bike Market, By Technology, 2027–2035 ($Million)
Table 74.Africa Autonomous Bike Market, By Level Of Autonomy, 2027–2035 ($Million)
Table 75.Africa Autonomous Bike Market, By Vehicle Type, 2027–2035 ($Million)
Table 76.Bmw Group: Key Executives
Table 77.Bmw Group: Company Snapshot
Table 78.Bmw Group: Operating Segments
Table 79.Bmw Group: Product Portfolio
Table 80.Bmw Group: R&D Expenditure, 2018–2020 ($Million)
Table 81.Bmw Group: Net Sales, 2018–2020 ($Million)
Table 82.Flo Mobility Private Limited: Key Executive
Table 83.Flo Mobility Private Limited: Company Snapshot
Table 84.Flo Mobility Private Limited: Product Portfolio
Table 85.Go X Apollo: Key Executives
Table 86.Go X Apollo: Company Snapshot
Table 87.Go X Apollo: Product Portfolio
Table 88.Honda Motor Co., Ltd.: Key Executives
Table 89.Honda Motor Co., Ltd.: Company Snapshot
Table 90.Honda Motor Co., Ltd.: Operating Segments
Table 91.Honda Motor Co., Ltd.: Product Portfolio
Table 92.Honda Motor Co., Ltd.: R&D Expenditure, 2018–2020 ($Million)
Table 93.Honda Motor Co., Ltd.: Net Sales, 2018–2020 ($Million)
Table 94.Iav: Key Executives
Table 95.Iav: Company Snapshot
Table 96.Iav: Product Portfolio
Table 97.Kawasaki Heavy Industries, Ltd.: Key Executives
Table 98.Kawasaki Heavy Industries, Ltd.: Company Snapshot
Table 99.Kawasaki Heavy Industries, Ltd.: Operating Segments
Table 100.Kawasaki Heavy Industries, Ltd.: Product Portfolio
Table 101.Kawasaki Heavy Industries, Ltd.: R&D Expenditure, 2018–2020 ($Million)
Table 102.Kawasaki Heavy Industries, Ltd.: Net Sales, 2018–2020 ($Million)
Table 103.Refraction Ai: Key Executives
Table 104.Refraction Ai: Company Snapshot
Table 105.Refraction Ai :Product Portfolio
Table 106.Spin: Key Executives
Table 107.Spin: Company Snapshot
Table 108.Spin: Product Portfolio
Table 109.Tortoise: Key Executives
Table 110.Tortoise: Company Snapshot
Table 111.Tortoise: Product Portfolio
Table 112.Yamaha Motor Co., Ltd.: Key Executives
Table 113.Yamaha Motor Co., Ltd.: Company Snapshot
Table 114.Yamaha Motor Co., Ltd.: Operating Segments
Table 115.Yamaha Motor Co., Ltd.: Product Portfolio
Table 116.Yamaha Motor Co., Ltd.: R&D Expenditure, 2018–2020 ($Million)
Table 117.Yamaha Motor Co., Ltd.: Net Sales, 2018–2020 ($Million)
List Of Figures
Figure 01.Key Market Segments
Figure 02.Executive Summary
Figure 03.Executive Summary
Figure 04.Top Impacting Factors
Figure 05.Top Investment Pockets
Figure 06.Top Winning Strategies, By Year, 2017–2021*
Figure 07.Top Winning Strategies, By Development, 2017–2021*
Figure 08.Top Winning Strategies, By Company, 2017–2021*
Figure 09.Low-to-high Bargaining Power Of Suppliers
Figure 10.Moderate-to-high Threat Of New Entrants
Figure 11.Low-to-high Threat Of Substitutes
Figure 12.Low-to-high Intensity Of Rivalry
Figure 13.Low-to-moderate Bargaining Power Of Buyers
Figure 14.Key Player Positioning (2020)
Figure 15.Autonomous Bike Market Share, By Technology, 2027–2035 (%)
Figure 16.Comparative Share Analysis Of Autonomous Bike Market For Gyroscope, By Country, 2027 & 2035 (%)
Figure 17.Comparative Share Analysis Of Autonomous Bike Market For Gps, By Country, 2027 & 2035 (%)
Figure 18.Comparative Share Analysis Of Autonomous Bike Market For Camera, By Country, 2027 & 2035 (%)
Figure 19.Comparative Share Analysis Of Autonomous Bike Market For Radar, By Country, 2027 & 2035 (%)
Figure 20.Comparative Share Analysis Of Autonomous Bike Market For Intelligent Speed Assistance, By Country, 2027 & 2035 (%)
Figure 21.Comparative Share Analysis Of Autonomous Bike Market For Others, By Country, 2027 & 2035 (%)
Figure 22.Autonomous Bike Market Share, By Level Of Autonomy, 2027–2035 (%)
Figure 23.Comparative Share Analysis Of Autonomous Bike Market For Semi-autonomous, By Country, 2027 & 2035 (%)
Figure 24.Comparative Share Analysis Of Autonomous Bike Market For Fully-autonomous, By Country, 2027 & 2035 (%)
Figure 25.Autonomous Bike Market Share, By Vehicle Type, 2027–2035 (%)
Figure 26.Comparative Share Analysis Of Autonomous Bike Market For Motorcycle, By Country, 2027 & 2035 (%)
Figure 27.Comparative Share Analysis Of Autonomous Bike Market For Kick-scooter, By Country, 2027 & 2035 (%)
Figure 28.Comparative Share Analysis Of Autonomous Bike Market For E-bicycle, By Country, 2027 & 2035 (%)
Figure 29.Autonomous Bike Market, By Region, 2027–2035 (%)
Figure 30.Comparative Share Analysis Of Autonomous Bike Market, By Country, 2027–2035 (%)
Figure 31.U.S. Autonomous Bike Market, 2027–2035 ($Million)
Figure 32.Canada Autonomous Bike Market, 2027–2035 ($Million)
Figure 33.Mexico Autonomous Bike Market, 2027–2035 ($Million)
Figure 34.Comparative Share Analysis Of Autonomous Bike Market, By Country, 2027–2035 (%)
Figure 35.Germany Autonomous Bike Market, 2027–2035 ($Million)
Figure 36.France Autonomous Bike Market, 2027–2035 ($Million)
Figure 37.Uk Autonomous Bike Market, 2027–2035 ($Million)
Figure 38.Italy Autonomous Bike Market, 2027–2035 ($Million)
Figure 39.Rest Of Europe Autonomous Bike Market, 2027–2035 ($Million)
Figure 40.Comparative Share Analysis Of Autonomous Bike Market, By Country, 2027–2035 (%)
Figure 41.China Autonomous Bike Market, 2027–2035 ($Million)
Figure 42.Japan Autonomous Bike Market, 2027–2035 ($Million)
Figure 43.India Autonomous Bike Market, 2027–2035 ($Million)
Figure 44.South Korea Autonomous Bike Market, 2027–2035 ($Million)
Figure 45.Rest Of Asia-pacific Autonomous Bike Market, 2027–2035 ($Million)
Figure 46.Comparative Share Analysis Of Autonomous Bike Market, By Country, 2027–2035 (%)
Figure 47.Latin America Autonomous Bike Market, 2027–2035 ($Million)
Figure 48.Middle East Autonomous Bike Market, 2027–2035 ($Million)
Figure 49.Africa Autonomous Bike Market, 2027–2035 ($Million)
Figure 50.Bmw Group: R&D Expenditure, 2018–2020 ($Million)
Figure 51.Bmw Group: Net Sales, 2018–2020 ($Million)
Figure 52.Bmw Group: Revenue Share By Segment, 2020 (%)
Figure 53.Bmw Group: Revenue Share By Region, 2020 (%)
Figure 54.Honda Motor Co., Ltd.: R&D Expenditure, 2018–2020 ($Million)
Figure 55.Honda Motor Co., Ltd.: Net Sales, 2018–2020 ($Million)
Figure 56.Honda Motor Co., Ltd.: Revenue Share By Segment, 2020 (%)
Figure 57.Honda Motor Co., Ltd.: Revenue Share By Region, 2020 (%)
Figure 58.Kawasaki Heavy Industries, Ltd.: R&D Expenditure, 2018–2020 ($Million)
Figure 59.Kawasaki Heavy Industries, Ltd.: Net Sales, 2018–2020 ($Million)
Figure 60.Kawasaki Heavy Industries, Ltd.: Revenue Share By Segment, 2020 (%)
Figure 61.Kawasaki Heavy Industries, Ltd.: Revenue Share By Region, 2020 (%)
Figure 62.Yamaha Motor Co., Ltd.: R&D Expenditure, 2018–2020 ($Million)
Figure 63.Yamaha Motor Co., Ltd.: Net Sales, 2018–2020 ($Million)
Figure 64.Yamaha Motor Co., Ltd.: Revenue Share By Segment, 2020 (%
$5769
$9995
HAVE A QUERY?
OUR CUSTOMER

SIMILAR REPORTS
Add to Cart
Add to Cart
Add to Cart
Add to Cart