
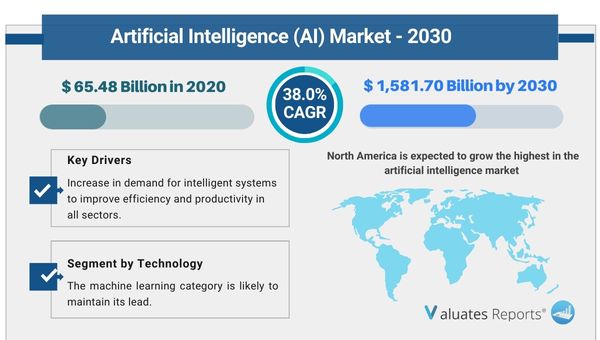
The global artificial intelligence market size was valued at USD 65.48 billion in 2020, and is projected to reach USD 1,581.70 billion by 2030, growing at a CAGR of 38.0% from 2021 to 2030.
Major factors driving the growth of artificial intelligence market are
AI systems are now able to process and analyze enormous datasets because of the availability of high-performance computers and the exponential growth in data output. AI cannot develop into a more sophisticated prediction and decision-making tool without this access to large data and processing capacity. Businesses in a variety of sectors are utilizing AI to automate jobs and procedures, which has led to notable increases in productivity. Automation powered by AI lowers operating costs, boosts output, and enables more smart resource allocation for businesses.
In sectors including marketing, entertainment, and e-commerce, artificial intelligence (AI) is driving personalized recommendations, content curation, and user experiences. Customizing goods and services to fit each customer's unique tastes and habits boosts client happiness and promotes corporate expansion. AI is having a revolutionary effect on the healthcare industry with applications like predictive analytics, medication development, and medical imaging. In the end, AI improves patient outcomes and lowers healthcare expenses by assisting medical practitioners in diagnosing patients more quickly and accurately. AI is essential to the development of autonomous systems, including industrial robots, drones, and self-driving automobiles. AI investments might rise as a result of these technologies' ability to transform industry, logistics, and transportation.
AI's capacity to evaluate market data, identify fraudulent activity, and enhance investing techniques is advantageous to the financial sector. AI is becoming more and more common in finance because of the rise of algorithmic trading systems and AI-driven robo-advisors. In customer care, the usage of AI-powered chatbots and virtual assistants is expanding. These AI programs save customer care expenses while increasing customer happiness by speeding up response times, answering questions, and offering round-the-clock assistance. Regulations and ethical issues are becoming more and more important as AI develops. In order to guarantee ethical AI development and usage, which promotes trust and responsible innovation, governments, and organizations are creating frameworks and rules.
Because machine learning is widely used in complex industrial applications, it is expected to continue to hold the top spot in the artificial intelligence market share. Conversely, as conversational AI gains traction, the NLP category will expand at the quickest rate of growth.
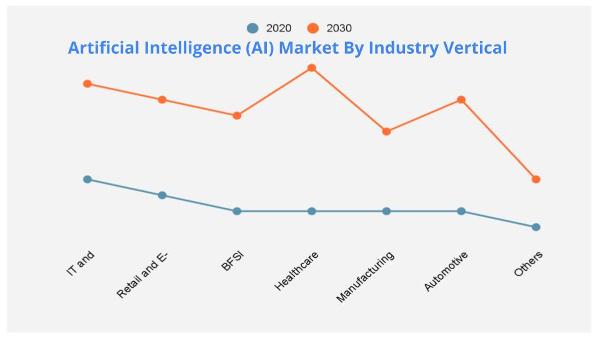
The IT and telecom sector will dominate the artificial intelligence market share based on industrial verticals because of the increasing demand for a stable communications infrastructure and the rapid digitalization of the industry. Because there are many prospects for automation in the medical field, the healthcare industry will expand the fastest.
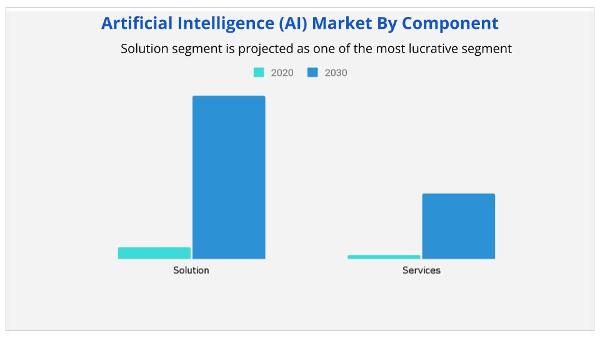
Component-based, the solutions category offers a profitable avenue for growing its market share in artificial intelligence, thanks to notable advancements in processing power and information storage capacity.
Geographically speaking, North America is anticipated to have the fastest growth in the artificial intelligence market share because of significant investments and the presence of both large and small AI firms. Because of its rapid digital growth, the Asia-Pacific region will grow at the quickest rate.
|
Report Metric |
Details |
|
Report Name |
Artificial Intelligence Market |
|
The Market size value in 2020 |
65.48 Billion USD |
|
The Revenue forecast in 2030 |
1,581.70 Billion USD |
|
Growth Rate |
CAGR of 38.0% from 2021 to 2030 |
|
Base year considered |
2021 |
|
Forecast period |
2021- 2030 |
|
Forecast units |
Value (USD) |
|
Segments covered |
Type, End-User, Offerings, and Region |
|
Report coverage |
Revenue & volume forecast, company share, competitive landscape, growth factors, and trends |
|
Geographic regions covered |
North America, Europe, Asia Pacific, Latin America, Middle East & Africa |
|
Companies covered |
Welltok, Inc., Intel Corporation, Nvidia Corporation, Google Inc., IBM Corporation, Microsoft Corporation, General Vision, Inc., Enlitic, Inc., Next IT Corporation, iCarbonX. |
Ans. The global artificial intelligence market size was valued at $65.48 billion in 2020, and is projected to reach $1,581.70 billion by 2030.
Ans. The global artificial intelligence market is expected to grow at a compound annual growth rate of 38.0% from 2021 to 2030.
Ans. The key players are Welltok, Inc., Intel Corporation, Nvidia Corporation, Google Inc., IBM Corporation, Microsoft Corporation, General Vision, Inc., Enlitic, Inc., Next IT Corporation, iCarbonX.
CHAPTER 1:INTRODUCTION
1.1.Report Description
1.2.Key Market Segments
1.3.Key Benefits
1.4.Research Methodology
1.4.1. Primary Research
1.4.2. Secondary Research
1.4.3. Analyst Tools and Models
CHAPTER 2:EXECUTIVE SUMMARY
2.1.CXO Perspective
CHAPTER 3:MARKET LANDSCAPE
3.1.Market Definition and Scope
3.2.Key Findings
3.2.1. Top Investment Pockets
3.2.2. Top Winning Strategies
3.3.Porter's Five Forces Analysis
3.3.1. Bargaining Power of Suppliers
3.3.2. Threat of New Entrants
3.3.3. Threat of Substitutes
3.3.4. Competitive Rivalry
3.3.5. Bargaining Power among Buyers
3.4.Market Share Analysis/Top Player Positioning
3.4.1. Market Share Analysis/Top Player Positioning 2020
3.5.Market Dynamics
3.5.1. Drivers
3.5.2. Restraints
3.5.3. Opportunities
3.6. COVID-19 Impact Analysis
3.7. Competitive Heat map
CHAPTER 4:ARTIFICIAL INTELLIGENCE MARKET, BY COMPONENT
4.1.Market Overview
4.1.1Market Size and Forecast, By Component
4.2. Software
4.2.1. Key Market Trends, Growth Factors and Opportunities
4.2.2. Market Size and Forecast, By Region
4.2.3. Market Share Analysis, By Country
4.3. Services
4.3.1. Key Market Trends, Growth Factors and Opportunities
4.3.2. Market Size and Forecast, By Region
4.3.3. Market Share Analysis, By Country
CHAPTER 5:ARTIFICIAL INTELLIGENCE MARKET, BY TECHNOLOGY
5.1.Market Overview
5.1.1Market Size and Forecast, By Technology
5.2. Machine Learning
5.2.1. Key Market Trends, Growth Factors and Opportunities
5.2.2. Market Size and Forecast, By Region
5.2.3. Market Share Analysis, By Country
5.3. Natural Language Processing
5.3.1. Key Market Trends, Growth Factors and Opportunities
5.3.2. Market Size and Forecast, By Region
5.3.3. Market Share Analysis, By Country
5.4. Computer Vision
5.4.1. Key Market Trends, Growth Factors and Opportunities
5.4.2. Market Size and Forecast, By Region
5.4.3. Market Share Analysis, By Country
5.5. Others
5.5.1. Key Market Trends, Growth Factors and Opportunities
5.5.2. Market Size and Forecast, By Region
5.5.3. Market Share Analysis, By Country
CHAPTER 6:ARTIFICIAL INTELLIGENCE MARKET, BY INDUSTRY VERTICAL
6.1.Market Overview
6.1.1Market Size and Forecast, By Industry Vertical
6.2. Automotive
6.2.1. Key Market Trends, Growth Factors and Opportunities
6.2.2. Market Size and Forecast, By Region
6.2.3. Market Share Analysis, By Country
6.3. Others
6.3.1. Key Market Trends, Growth Factors and Opportunities
6.3.2. Market Size and Forecast, By Region
6.3.3. Market Share Analysis, By Country
6.4. It and Telecommunication
6.4.1. Key Market Trends, Growth Factors and Opportunities
6.4.2. Market Size and Forecast, By Region
6.4.3. Market Share Analysis, By Country
6.5. Retail and E Commerce
6.5.1. Key Market Trends, Growth Factors and Opportunities
6.5.2. Market Size and Forecast, By Region
6.5.3. Market Share Analysis, By Country
6.6. BFSI
6.6.1. Key Market Trends, Growth Factors and Opportunities
6.6.2. Market Size and Forecast, By Region
6.6.3. Market Share Analysis, By Country
6.7. Healthcare
6.7.1. Key Market Trends, Growth Factors and Opportunities
6.7.2. Market Size and Forecast, By Region
6.7.3. Market Share Analysis, By Country
6.8. Manufacturing
6.8.1. Key Market Trends, Growth Factors and Opportunities
6.8.2. Market Size and Forecast, By Region
6.8.3. Market Share Analysis, By Country
CHAPTER 7:ARTIFICIAL INTELLIGENCE MARKET, BY REGION
7.1.Market Overview
7.1.1Market Size and Forecast, By Region
7.2.North America
7.2.1. Key Market Trends and Opportunities
7.2.2. Market Size and Forecast, By Component
7.2.3. Market Size and Forecast, By Technology
7.2.4. Market Size and Forecast, By Industry Vertical
7.2.5. Market Size and Forecast, By Country
7.2.6. United States Artificial Intelligence Market
7.2.6.1. Market Size and Forecast, By Component
7.2.6.2. Market Size and Forecast, By Technology
7.2.6.3. Market Size and Forecast, By Industry Vertical
7.2.7. Canada Artificial Intelligence Market
7.2.7.1. Market Size and Forecast, By Component
7.2.7.2. Market Size and Forecast, By Technology
7.2.7.3. Market Size and Forecast, By Industry Vertical
7.3.Europe
7.3.1. Key Market Trends and Opportunities
7.3.2. Market Size and Forecast, By Component
7.3.3. Market Size and Forecast, By Technology
7.3.4. Market Size and Forecast, By Industry Vertical
7.3.5. Market Size and Forecast, By Country
7.3.6. Uk Artificial Intelligence Market
7.3.6.1. Market Size and Forecast, By Component
7.3.6.2. Market Size and Forecast, By Technology
7.3.6.3. Market Size and Forecast, By Industry Vertical
7.3.7. Germany Artificial Intelligence Market
7.3.7.1. Market Size and Forecast, By Component
7.3.7.2. Market Size and Forecast, By Technology
7.3.7.3. Market Size and Forecast, By Industry Vertical
7.3.8. France Artificial Intelligence Market
7.3.8.1. Market Size and Forecast, By Component
7.3.8.2. Market Size and Forecast, By Technology
7.3.8.3. Market Size and Forecast, By Industry Vertical
7.3.9. Italy Artificial Intelligence Market
7.3.9.1. Market Size and Forecast, By Component
7.3.9.2. Market Size and Forecast, By Technology
7.3.9.3. Market Size and Forecast, By Industry Vertical
7.3.10. Spain Artificial Intelligence Market
7.3.10.1. Market Size and Forecast, By Component
7.3.10.2. Market Size and Forecast, By Technology
7.3.10.3. Market Size and Forecast, By Industry Vertical
7.3.11. Netherlands Artificial Intelligence Market
7.3.11.1. Market Size and Forecast, By Component
7.3.11.2. Market Size and Forecast, By Technology
7.3.11.3. Market Size and Forecast, By Industry Vertical
7.3.12. Rest of Europe Artificial Intelligence Market
7.3.12.1. Market Size and Forecast, By Component
7.3.12.2. Market Size and Forecast, By Technology
7.3.12.3. Market Size and Forecast, By Industry Vertical
7.4.Asia-Pacific
7.4.1. Key Market Trends and Opportunities
7.4.2. Market Size and Forecast, By Component
7.4.3. Market Size and Forecast, By Technology
7.4.4. Market Size and Forecast, By Industry Vertical
7.4.5. Market Size and Forecast, By Country
7.4.6. China Artificial Intelligence Market
7.4.6.1. Market Size and Forecast, By Component
7.4.6.2. Market Size and Forecast, By Technology
7.4.6.3. Market Size and Forecast, By Industry Vertical
7.4.7. Japan Artificial Intelligence Market
7.4.7.1. Market Size and Forecast, By Component
7.4.7.2. Market Size and Forecast, By Technology
7.4.7.3. Market Size and Forecast, By Industry Vertical
7.4.8. India Artificial Intelligence Market
7.4.8.1. Market Size and Forecast, By Component
7.4.8.2. Market Size and Forecast, By Technology
7.4.8.3. Market Size and Forecast, By Industry Vertical
7.4.9. Australia Artificial Intelligence Market
7.4.9.1. Market Size and Forecast, By Component
7.4.9.2. Market Size and Forecast, By Technology
7.4.9.3. Market Size and Forecast, By Industry Vertical
7.4.10. South Korea Artificial Intelligence Market
7.4.10.1. Market Size and Forecast, By Component
7.4.10.2. Market Size and Forecast, By Technology
7.4.10.3. Market Size and Forecast, By Industry Vertical
7.4.11. Rest of Asia-pacific Artificial Intelligence Market
7.4.11.1. Market Size and Forecast, By Component
7.4.11.2. Market Size and Forecast, By Technology
7.4.11.3. Market Size and Forecast, By Industry Vertical
7.5.LAMEA
7.5.1. Key Market Trends and Opportunities
7.5.2. Market Size and Forecast, By Component
7.5.3. Market Size and Forecast, By Technology
7.5.4. Market Size and Forecast, By Industry Vertical
7.5.5. Market Size and Forecast, By Country
7.5.6. Latin America Artificial Intelligence Market
7.5.6.1. Market Size and Forecast, By Component
7.5.6.2. Market Size and Forecast, By Technology
7.5.6.3. Market Size and Forecast, By Industry Vertical
7.5.7. Middle East Artificial Intelligence Market
7.5.7.1. Market Size and Forecast, By Component
7.5.7.2. Market Size and Forecast, By Technology
7.5.7.3. Market Size and Forecast, By Industry Vertical
7.5.8. Africa Artificial Intelligence Market
7.5.8.1. Market Size and Forecast, By Component
7.5.8.2. Market Size and Forecast, By Technology
7.5.8.3. Market Size and Forecast, By Industry Vertical
CHAPTER 8:COMPANY PROFILES
8.1. Amazon Web Services, Inc.
8.1.1.Company Overview
8.1.2.Key Executives
8.1.3.Company snapshot
8.1.4.Operating business segments
8.1.5.Product portfolio
8.1.6.Business Performance
8.1.7.Key Strategic Moves and Developments
8.2. Apple Inc.
8.2.1.Company Overview
8.2.2.Key Executives
8.2.3.Company snapshot
8.2.4.Operating business segments
8.2.5.Product portfolio
8.2.6.Business Performance
8.2.7.Key Strategic Moves and Developments
8.3. Google LLC
8.3.1.Company Overview
8.3.2.Key Executives
8.3.3.Company snapshot
8.3.4.Operating business segments
8.3.5.Product portfolio
8.3.6.Business Performance
8.3.7.Key Strategic Moves and Developments
8.4. IBM Corporation
8.4.1.Company Overview
8.4.2.Key Executives
8.4.3.Company snapshot
8.4.4.Operating business segments
8.4.5.Product portfolio
8.4.6.Business Performance
8.4.7.Key Strategic Moves and Developments
8.5. Intel Corporation
8.5.1.Company Overview
8.5.2.Key Executives
8.5.3.Company snapshot
8.5.4.Operating business segments
8.5.5.Product portfolio
8.5.6.Business Performance
8.5.7.Key Strategic Moves and Developments
8.6. Microsoft Corporation
8.6.1.Company Overview
8.6.2.Key Executives
8.6.3.Company snapshot
8.6.4.Operating business segments
8.6.5.Product portfolio
8.6.6.Business Performance
8.6.7.Key Strategic Moves and Developments
8.7. Nvidia
8.7.1.Company Overview
8.7.2.Key Executives
8.7.3.Company snapshot
8.7.4.Operating business segments
8.7.5.Product portfolio
8.7.6.Business Performance
8.7.7.Key Strategic Moves and Developments
8.8. Oracle Corporation
8.8.1.Company Overview
8.8.2.Key Executives
8.8.3.Company snapshot
8.8.4.Operating business segments
8.8.5.Product portfolio
8.8.6.Business Performance
8.8.7.Key Strategic Moves and Developments
8.9. SAP SE
8.9.1.Company Overview
8.9.2.Key Executives
8.9.3.Company snapshot
8.9.4.Operating business segments
8.9.5.Product portfolio
8.9.6.Business Performance
8.9.7.Key Strategic Moves and Developments
8.10. Siemens AG
8.10.1.Company Overview
8.10.2.Key Executives
8.10.3.Company snapshot
8.10.4.Operating business segments
8.10.5.Product portfolio
8.10.6.Business Performance
8.10.7.Key Strategic Moves and Developments
Note: *Details on financial performance and strategic moves and developments may not be captured for
unlisted companies.
*List of companies profiled in this TOC is tentative and may change after detailed analysis.
*Market size and forecast will be provided from 2020-2030, and forecast period would be 2021-2030.
*The provided information and segments are for representation purpose only. The actual information
delivered would change significantly as per findings during the course of study and upon its
completion.
LIST OF TABLES
TABLE 1.GLOBAL ARTIFICIAL INTELLIGENCE MARKET, BY COMPONENT, 2020-2030 ($MILLION)
TABLE 2.GLOBAL ARTIFICIAL INTELLIGENCE MARKET FOR SOFTWARE, BY REGION, 2020-2030 ($MILLION)
TABLE 3.GLOBAL ARTIFICIAL INTELLIGENCE MARKET FOR SERVICES, BY REGION, 2020-2030 ($MILLION)
TABLE 4.GLOBAL ARTIFICIAL INTELLIGENCE MARKET, BY TECHNOLOGY, 2020-2030 ($MILLION)
TABLE 5.GLOBAL ARTIFICIAL INTELLIGENCE MARKET FOR MACHINE LEARNING, BY REGION, 2020-2030 ($MILLION)
TABLE 6.GLOBAL ARTIFICIAL INTELLIGENCE MARKET FOR NATURAL LANGUAGE PROCESSING, BY REGION, 2020-2030 ($MILLION)
TABLE 7.GLOBAL ARTIFICIAL INTELLIGENCE MARKET FOR COMPUTER VISION, BY REGION, 2020-2030 ($MILLION)
TABLE 8.GLOBAL ARTIFICIAL INTELLIGENCE MARKET FOR OTHERS, BY REGION, 2020-2030 ($MILLION)
TABLE 9.GLOBAL ARTIFICIAL INTELLIGENCE MARKET, BY INDUSTRY VERTICAL, 2020-2030 ($MILLION)
TABLE 10.GLOBAL ARTIFICIAL INTELLIGENCE MARKET FOR AUTOMOTIVE, BY REGION, 2020-2030 ($MILLION)
TABLE 11.GLOBAL ARTIFICIAL INTELLIGENCE MARKET FOR OTHERS, BY REGION, 2020-2030 ($MILLION)
TABLE 12.GLOBAL ARTIFICIAL INTELLIGENCE MARKET FOR IT AND TELECOMMUNICATION, BY REGION, 2020-2030 ($MILLION)
TABLE 13.GLOBAL ARTIFICIAL INTELLIGENCE MARKET FOR RETAIL AND E COMMERCE, BY REGION, 2020-2030 ($MILLION)
TABLE 14.GLOBAL ARTIFICIAL INTELLIGENCE MARKET FOR BFSI, BY REGION, 2020-2030 ($MILLION)
TABLE 15.GLOBAL ARTIFICIAL INTELLIGENCE MARKET FOR HEALTHCARE, BY REGION, 2020-2030 ($MILLION)
TABLE 16.GLOBAL ARTIFICIAL INTELLIGENCE MARKET FOR MANUFACTURING, BY REGION, 2020-2030 ($MILLION)
TABLE 17.GLOBAL ARTIFICIAL INTELLIGENCE MARKET, BY REGION, 2020-2030 ($MILLION)
TABLE 18.NORTH AMERICA ARTIFICIAL INTELLIGENCE, BY Region, 2020-2030 ($MILLION)
TABLE 19.NORTH AMERICA ARTIFICIAL INTELLIGENCE, BY COMPONENT, 2020-2030 ($MILLION)
TABLE 20.NORTH AMERICA ARTIFICIAL INTELLIGENCE, BY TECHNOLOGY, 2020-2030 ($MILLION)
TABLE 21.NORTH AMERICA ARTIFICIAL INTELLIGENCE, BY INDUSTRY VERTICAL, 2020-2030 ($MILLION)
TABLE 22.UNITED STATES ARTIFICIAL INTELLIGENCE, BY COMPONENT, 2020-2030 ($MILLION)
TABLE 23.UNITED STATES ARTIFICIAL INTELLIGENCE, BY TECHNOLOGY, 2020-2030 ($MILLION)
TABLE 24.UNITED STATES ARTIFICIAL INTELLIGENCE, BY INDUSTRY VERTICAL, 2020-2030 ($MILLION)
TABLE 25.CANADA ARTIFICIAL INTELLIGENCE, BY COMPONENT, 2020-2030 ($MILLION)
TABLE 26.CANADA ARTIFICIAL INTELLIGENCE, BY TECHNOLOGY, 2020-2030 ($MILLION)
TABLE 27.CANADA ARTIFICIAL INTELLIGENCE, BY INDUSTRY VERTICAL, 2020-2030 ($MILLION)
TABLE 28.EUROPE ARTIFICIAL INTELLIGENCE, BY Region, 2020-2030 ($MILLION)
TABLE 29.EUROPE ARTIFICIAL INTELLIGENCE, BY COMPONENT, 2020-2030 ($MILLION)
TABLE 30.EUROPE ARTIFICIAL INTELLIGENCE, BY TECHNOLOGY, 2020-2030 ($MILLION)
TABLE 31.EUROPE ARTIFICIAL INTELLIGENCE, BY INDUSTRY VERTICAL, 2020-2030 ($MILLION)
TABLE 32.UK ARTIFICIAL INTELLIGENCE, BY COMPONENT, 2020-2030 ($MILLION)
TABLE 33.UK ARTIFICIAL INTELLIGENCE, BY TECHNOLOGY, 2020-2030 ($MILLION)
TABLE 34.UK ARTIFICIAL INTELLIGENCE, BY INDUSTRY VERTICAL, 2020-2030 ($MILLION)
TABLE 35.GERMANY ARTIFICIAL INTELLIGENCE, BY COMPONENT, 2020-2030 ($MILLION)
TABLE 36.GERMANY ARTIFICIAL INTELLIGENCE, BY TECHNOLOGY, 2020-2030 ($MILLION)
TABLE 37.GERMANY ARTIFICIAL INTELLIGENCE, BY INDUSTRY VERTICAL, 2020-2030 ($MILLION)
TABLE 38.FRANCE ARTIFICIAL INTELLIGENCE, BY COMPONENT, 2020-2030 ($MILLION)
TABLE 39.FRANCE ARTIFICIAL INTELLIGENCE, BY TECHNOLOGY, 2020-2030 ($MILLION)
TABLE 40.FRANCE ARTIFICIAL INTELLIGENCE, BY INDUSTRY VERTICAL, 2020-2030 ($MILLION)
TABLE 41.ITALY ARTIFICIAL INTELLIGENCE, BY COMPONENT, 2020-2030 ($MILLION)
TABLE 42.ITALY ARTIFICIAL INTELLIGENCE, BY TECHNOLOGY, 2020-2030 ($MILLION)
TABLE 43.ITALY ARTIFICIAL INTELLIGENCE, BY INDUSTRY VERTICAL, 2020-2030 ($MILLION)
TABLE 44.SPAIN ARTIFICIAL INTELLIGENCE, BY COMPONENT, 2020-2030 ($MILLION)
TABLE 45.SPAIN ARTIFICIAL INTELLIGENCE, BY TECHNOLOGY, 2020-2030 ($MILLION)
TABLE 46.SPAIN ARTIFICIAL INTELLIGENCE, BY INDUSTRY VERTICAL, 2020-2030 ($MILLION)
TABLE 47.NETHERLANDS ARTIFICIAL INTELLIGENCE, BY COMPONENT, 2020-2030 ($MILLION)
TABLE 48.NETHERLANDS ARTIFICIAL INTELLIGENCE, BY TECHNOLOGY, 2020-2030 ($MILLION)
TABLE 49.NETHERLANDS ARTIFICIAL INTELLIGENCE, BY INDUSTRY VERTICAL, 2020-2030 ($MILLION)
TABLE 50.REST OF EUROPE ARTIFICIAL INTELLIGENCE, BY COMPONENT, 2020-2030 ($MILLION)
TABLE 51.REST OF EUROPE ARTIFICIAL INTELLIGENCE, BY TECHNOLOGY, 2020-2030 ($MILLION)
TABLE 52.REST OF EUROPE ARTIFICIAL INTELLIGENCE, BY INDUSTRY VERTICAL, 2020-2030 ($MILLION)
TABLE 53.ASIA-PACIFIC ARTIFICIAL INTELLIGENCE, BY Region, 2020-2030 ($MILLION)
TABLE 54.ASIA-PACIFIC ARTIFICIAL INTELLIGENCE, BY COMPONENT, 2020-2030 ($MILLION)
TABLE 55.ASIA-PACIFIC ARTIFICIAL INTELLIGENCE, BY TECHNOLOGY, 2020-2030 ($MILLION)
TABLE 56.ASIA-PACIFIC ARTIFICIAL INTELLIGENCE, BY INDUSTRY VERTICAL, 2020-2030 ($MILLION)
TABLE 57.CHINA ARTIFICIAL INTELLIGENCE, BY COMPONENT, 2020-2030 ($MILLION)
TABLE 58.CHINA ARTIFICIAL INTELLIGENCE, BY TECHNOLOGY, 2020-2030 ($MILLION)
TABLE 59.CHINA ARTIFICIAL INTELLIGENCE, BY INDUSTRY VERTICAL, 2020-2030 ($MILLION)
TABLE 60.JAPAN ARTIFICIAL INTELLIGENCE, BY COMPONENT, 2020-2030 ($MILLION)
TABLE 61.JAPAN ARTIFICIAL INTELLIGENCE, BY TECHNOLOGY, 2020-2030 ($MILLION)
TABLE 62.JAPAN ARTIFICIAL INTELLIGENCE, BY INDUSTRY VERTICAL, 2020-2030 ($MILLION)
TABLE 63.INDIA ARTIFICIAL INTELLIGENCE, BY COMPONENT, 2020-2030 ($MILLION)
TABLE 64.INDIA ARTIFICIAL INTELLIGENCE, BY TECHNOLOGY, 2020-2030 ($MILLION)
TABLE 65.INDIA ARTIFICIAL INTELLIGENCE, BY INDUSTRY VERTICAL, 2020-2030 ($MILLION)
TABLE 66.AUSTRALIA ARTIFICIAL INTELLIGENCE, BY COMPONENT, 2020-2030 ($MILLION)
TABLE 67.AUSTRALIA ARTIFICIAL INTELLIGENCE, BY TECHNOLOGY, 2020-2030 ($MILLION)
TABLE 68.AUSTRALIA ARTIFICIAL INTELLIGENCE, BY INDUSTRY VERTICAL, 2020-2030 ($MILLION)
TABLE 69.SOUTH KOREA ARTIFICIAL INTELLIGENCE, BY COMPONENT, 2020-2030 ($MILLION)
TABLE 70.SOUTH KOREA ARTIFICIAL INTELLIGENCE, BY TECHNOLOGY, 2020-2030 ($MILLION)
TABLE 71.SOUTH KOREA ARTIFICIAL INTELLIGENCE, BY INDUSTRY VERTICAL, 2020-2030 ($MILLION)
TABLE 72.REST OF ASIA-PACIFIC ARTIFICIAL INTELLIGENCE, BY COMPONENT, 2020-2030 ($MILLION)
TABLE 73.REST OF ASIA-PACIFIC ARTIFICIAL INTELLIGENCE, BY TECHNOLOGY, 2020-2030 ($MILLION)
TABLE 74.REST OF ASIA-PACIFIC ARTIFICIAL INTELLIGENCE, BY INDUSTRY VERTICAL, 2020-2030 ($MILLION)
TABLE 75.LAMEA ARTIFICIAL INTELLIGENCE, BY Region, 2020-2030 ($MILLION)
TABLE 76.LAMEA ARTIFICIAL INTELLIGENCE, BY COMPONENT, 2020-2030 ($MILLION)
TABLE 77.LAMEA ARTIFICIAL INTELLIGENCE, BY TECHNOLOGY, 2020-2030 ($MILLION)
TABLE 78.LAMEA ARTIFICIAL INTELLIGENCE, BY INDUSTRY VERTICAL, 2020-2030 ($MILLION)
TABLE 79.LATIN AMERICA ARTIFICIAL INTELLIGENCE, BY COMPONENT, 2020-2030 ($MILLION)
TABLE 80.LATIN AMERICA ARTIFICIAL INTELLIGENCE, BY TECHNOLOGY, 2020-2030 ($MILLION)
TABLE 81.LATIN AMERICA ARTIFICIAL INTELLIGENCE, BY INDUSTRY VERTICAL, 2020-2030 ($MILLION)
TABLE 82.MIDDLE EAST ARTIFICIAL INTELLIGENCE, BY COMPONENT, 2020-2030 ($MILLION)
TABLE 83.MIDDLE EAST ARTIFICIAL INTELLIGENCE, BY TECHNOLOGY, 2020-2030 ($MILLION)
TABLE 84.MIDDLE EAST ARTIFICIAL INTELLIGENCE, BY INDUSTRY VERTICAL, 2020-2030 ($MILLION)
TABLE 85.AFRICA ARTIFICIAL INTELLIGENCE, BY COMPONENT, 2020-2030 ($MILLION)
TABLE 86.AFRICA ARTIFICIAL INTELLIGENCE, BY TECHNOLOGY, 2020-2030 ($MILLION)
TABLE 87.AFRICA ARTIFICIAL INTELLIGENCE, BY INDUSTRY VERTICAL, 2020-2030 ($MILLION)
TABLE 88.AMAZON WEB SERVICES, INC.: KEY EXECUTIVES
TABLE 89.AMAZON WEB SERVICES, INC.: COMPANY SNAPSHOT
TABLE 90.AMAZON WEB SERVICES, INC.: OPERATING SEGMENTS
TABLE 91.AMAZON WEB SERVICES, INC.: PRODUCT PORTFOLIO
TABLE 92.AMAZON WEB SERVICES, INC.: KEY STRATEGIC MOVES AND DEVELOPMENTS
TABLE 93.APPLE INC.: KEY EXECUTIVES
TABLE 94.APPLE INC.: COMPANY SNAPSHOT
TABLE 95.APPLE INC.: OPERATING SEGMENTS
TABLE 96.APPLE INC.: PRODUCT PORTFOLIO
TABLE 97.APPLE INC.: KEY STRATEGIC MOVES AND DEVELOPMENTS
TABLE 98.GOOGLE LLC: KEY EXECUTIVES
TABLE 99.GOOGLE LLC: COMPANY SNAPSHOT
TABLE 100.GOOGLE LLC: OPERATING SEGMENTS
TABLE 101.GOOGLE LLC: PRODUCT PORTFOLIO
TABLE 102.GOOGLE LLC: KEY STRATEGIC MOVES AND DEVELOPMENTS
TABLE 103.IBM CORPORATION: KEY EXECUTIVES
TABLE 104.IBM CORPORATION: COMPANY SNAPSHOT
TABLE 105.IBM CORPORATION: OPERATING SEGMENTS
TABLE 106.IBM CORPORATION: PRODUCT PORTFOLIO
TABLE 107.IBM CORPORATION: KEY STRATEGIC MOVES AND DEVELOPMENTS
TABLE 108.INTEL CORPORATION: KEY EXECUTIVES
TABLE 109.INTEL CORPORATION: COMPANY SNAPSHOT
TABLE 110.INTEL CORPORATION: OPERATING SEGMENTS
TABLE 111.INTEL CORPORATION: PRODUCT PORTFOLIO
TABLE 112.INTEL CORPORATION: KEY STRATEGIC MOVES AND DEVELOPMENTS
TABLE 113.MICROSOFT CORPORATION: KEY EXECUTIVES
TABLE 114.MICROSOFT CORPORATION: COMPANY SNAPSHOT
TABLE 115.MICROSOFT CORPORATION: OPERATING SEGMENTS
TABLE 116.MICROSOFT CORPORATION: PRODUCT PORTFOLIO
TABLE 117.MICROSOFT CORPORATION: KEY STRATEGIC MOVES AND DEVELOPMENTS
TABLE 118.NVIDIA: KEY EXECUTIVES
TABLE 119.NVIDIA: COMPANY SNAPSHOT
TABLE 120.NVIDIA: OPERATING SEGMENTS
TABLE 121.NVIDIA: PRODUCT PORTFOLIO
TABLE 122.NVIDIA: KEY STRATEGIC MOVES AND DEVELOPMENTS
TABLE 123.ORACLE CORPORATION: KEY EXECUTIVES
TABLE 124.ORACLE CORPORATION: COMPANY SNAPSHOT
TABLE 125.ORACLE CORPORATION: OPERATING SEGMENTS
TABLE 126.ORACLE CORPORATION: PRODUCT PORTFOLIO
TABLE 127.ORACLE CORPORATION: KEY STRATEGIC MOVES AND DEVELOPMENTS
TABLE 128.SAP SE: KEY EXECUTIVES
TABLE 129.SAP SE: COMPANY SNAPSHOT
TABLE 130.SAP SE: OPERATING SEGMENTS
TABLE 131.SAP SE: PRODUCT PORTFOLIO
TABLE 132.SAP SE: KEY STRATEGIC MOVES AND DEVELOPMENTS
TABLE 133.SIEMENS AG: KEY EXECUTIVES
TABLE 134.SIEMENS AG: COMPANY SNAPSHOT
TABLE 135.SIEMENS AG: OPERATING SEGMENTS
TABLE 136.SIEMENS AG: PRODUCT PORTFOLIO
TABLE 137.SIEMENS AG: KEY STRATEGIC MOVES AND DEVELOPMENTS
LIST OF FIGURES
FIGURE 1.GLOBAL ARTIFICIAL INTELLIGENCE MARKET SEGMENTATION
FIGURE 2.GLOBAL ARTIFICIAL INTELLIGENCE MARKET
FIGURE 3.SEGMENTATION ARTIFICIAL INTELLIGENCE MARKET
FIGURE 4.TOP INVESTMENT POCKET IN ARTIFICIAL INTELLIGENCE MARKET
FIGURE 5.TOP WINNING STRATEGIES, 2019-2021*
FIGURE 6.TOP WINNING STRATEGIES, BY DEVELOPMENT, 2019-2021(%)
FIGURE 7.TOP WINNING STRATEGIES, BY COMPANY, 2019-2021*
FIGURE 8.MODERATE BARGAINING POWER OF BUYERS
FIGURE 9.MODERATE BARGAINING POWER OF SUPPLIERS
FIGURE 10.MODERATE THREAT OF NEW ENTRANTS
FIGURE 11.LOW THREAT OF SUBSTITUTION
FIGURE 12.HIGH COMPETITIVE RIVALRY
FIGURE 13.TOP PLAYER POSITIONING, 2020
FIGURE 14.MARKET SHARE ANALYSIS, 2020
FIGURE 15.RESTRAINTS AND DRIVERS: ARTIFICIAL INTELLIGENCE MARKET
FIGURE 16.ARTIFICIAL INTELLIGENCE MARKET SEGMENTATION, BY COMPONENT
FIGURE 17.ARTIFICIAL INTELLIGENCE MARKET FOR SOFTWARE, BY COUNTRY, 2020-2030 ($MILLION)
FIGURE 18.ARTIFICIAL INTELLIGENCE MARKET FOR SERVICES, BY COUNTRY, 2020-2030 ($MILLION)
FIGURE 19.ARTIFICIAL INTELLIGENCE MARKET SEGMENTATION, BY TECHNOLOGY
FIGURE 20.ARTIFICIAL INTELLIGENCE MARKET FOR MACHINE LEARNING, BY COUNTRY, 2020-2030 ($MILLION)
FIGURE 21.ARTIFICIAL INTELLIGENCE MARKET FOR NATURAL LANGUAGE PROCESSING, BY COUNTRY, 2020-2030 ($MILLION)
FIGURE 22.ARTIFICIAL INTELLIGENCE MARKET FOR COMPUTER VISION, BY COUNTRY, 2020-2030 ($MILLION)
FIGURE 23.ARTIFICIAL INTELLIGENCE MARKET FOR OTHERS, BY COUNTRY, 2020-2030 ($MILLION)
FIGURE 24.ARTIFICIAL INTELLIGENCE MARKET SEGMENTATION, BY INDUSTRY VERTICAL
FIGURE 25.ARTIFICIAL INTELLIGENCE MARKET FOR AUTOMOTIVE, BY COUNTRY, 2020-2030 ($MILLION)
FIGURE 26.ARTIFICIAL INTELLIGENCE MARKET FOR OTHERS, BY COUNTRY, 2020-2030 ($MILLION)
FIGURE 27.ARTIFICIAL INTELLIGENCE MARKET FOR IT AND TELECOMMUNICATION, BY COUNTRY, 2020-2030 ($MILLION)
FIGURE 28.ARTIFICIAL INTELLIGENCE MARKET FOR RETAIL AND E COMMERCE, BY COUNTRY, 2020-2030 ($MILLION)
FIGURE 29.ARTIFICIAL INTELLIGENCE MARKET FOR BFSI, BY COUNTRY, 2020-2030 ($MILLION)
FIGURE 30.ARTIFICIAL INTELLIGENCE MARKET FOR HEALTHCARE, BY COUNTRY, 2020-2030 ($MILLION)
FIGURE 31.ARTIFICIAL INTELLIGENCE MARKET FOR MANUFACTURING, BY COUNTRY, 2020-2030 ($MILLION)
FIGURE 32.AMAZON WEB SERVICES, INC.: NET SALES, 2018-2020 ($MILLION)
FIGURE 33.AMAZON WEB SERVICES, INC.: REVENUE SHARE, BY SEGMENT, 2020 (%)
FIGURE 34.AMAZON WEB SERVICES, INC.: REVENUE SHARE, BY REGION, 2020 (%)
FIGURE 35.APPLE INC.: NET SALES, 2018-2020 ($MILLION)
FIGURE 36.APPLE INC.: REVENUE SHARE, BY SEGMENT, 2020 (%)
FIGURE 37.APPLE INC.: REVENUE SHARE, BY REGION, 2020 (%)
FIGURE 38.GOOGLE LLC: NET SALES, 2018-2020 ($MILLION)
FIGURE 39.GOOGLE LLC: REVENUE SHARE, BY SEGMENT, 2020 (%)
FIGURE 40.GOOGLE LLC: REVENUE SHARE, BY REGION, 2020 (%)
FIGURE 41.IBM CORPORATION: NET SALES, 2018-2020 ($MILLION)
FIGURE 42.IBM CORPORATION: REVENUE SHARE, BY SEGMENT, 2020 (%)
FIGURE 43.IBM CORPORATION: REVENUE SHARE, BY REGION, 2020 (%)
FIGURE 44.INTEL CORPORATION: NET SALES, 2018-2020 ($MILLION)
FIGURE 45.INTEL CORPORATION: REVENUE SHARE, BY SEGMENT, 2020 (%)
FIGURE 46.INTEL CORPORATION: REVENUE SHARE, BY REGION, 2020 (%)
FIGURE 47.MICROSOFT CORPORATION: NET SALES, 2018-2020 ($MILLION)
FIGURE 48.MICROSOFT CORPORATION: REVENUE SHARE, BY SEGMENT, 2020 (%)
FIGURE 49.MICROSOFT CORPORATION: REVENUE SHARE, BY REGION, 2020 (%)
FIGURE 50.NVIDIA: NET SALES, 2018-2020 ($MILLION)
FIGURE 51.NVIDIA: REVENUE SHARE, BY SEGMENT, 2020 (%)
FIGURE 52.NVIDIA: REVENUE SHARE, BY REGION, 2020 (%)
FIGURE 53.ORACLE CORPORATION: NET SALES, 2018-2020 ($MILLION)
FIGURE 54.ORACLE CORPORATION: REVENUE SHARE, BY SEGMENT, 2020 (%)
FIGURE 55.ORACLE CORPORATION: REVENUE SHARE, BY REGION, 2020 (%)
FIGURE 56.SAP SE: NET SALES, 2018-2020 ($MILLION)
FIGURE 57.SAP SE: REVENUE SHARE, BY SEGMENT, 2020 (%)
FIGURE 58.SAP SE: REVENUE SHARE, BY REGION, 2020 (%)
FIGURE 59.SIEMENS AG: NET SALES, 2018-2020 ($MILLION)
FIGURE 60.SIEMENS AG: REVENUE SHARE, BY SEGMENT, 2020 (%)
FIGURE 61.SIEMENS AG: REVENUE SHARE, BY REGION, 2020 (%)
$6169
$6930
$10665
HAVE A QUERY?
OUR CUSTOMER
