
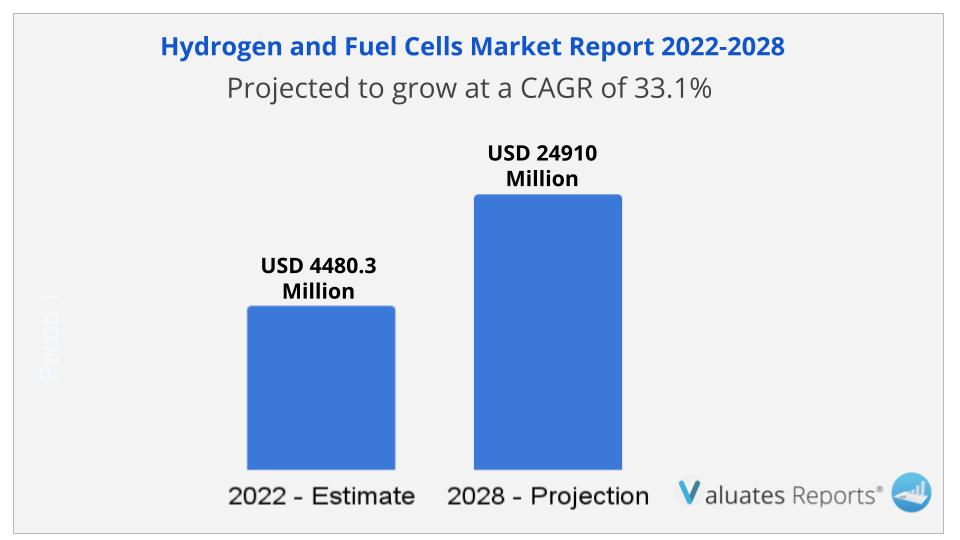
Due to the COVID-19 pandemic, the global Hydrogen and Fuel Cells market size is estimated to be worth US$ 4480.3 million in 2022 and is forecast to a readjusted size of US$ 24910 million by 2028 with a Compound Annual Growth Rate (CAGR) of 33.1% during the forecast period.
Hydrogen and Fuel Cells use hydrogen as a chemical element, and are made into batteries that store energy. The basic principle is the reverse reaction of electrolysis of water, hydrogen and oxygen were supplied to the cathode and anode, hydrogen diffusion through the cathode and the electrolyte reaction, the release of electrons through the external load to reach the anode.
Traditionally, the North American market develops significantly due to the commercialization and adoption of electric vehicles. However, Asia Pacific emerges as a growing market in terms of shipment in 2019. Growing demand for new energy vehicles and power systems in the APAC market triggers the market demand.
The hydrogen and fuel cells market, by type, is segmented into air-cooled type and transport-cooled type, and air-cooled system accounted for the largest market share in 2019.
Growing demand for clean energy generation and reliance on hydrogen and fuel cells-based public transportation systems in developed regions is driving the market growth. Moreover, advantages offered by air-cooled system, such as structure is simple, lightweight, the price is relatively cheap are likely to drive the demand for the air-cooled system during the forecast period.
Power-based electricity generation is effective in minimizing the emission of carbon dioxide or any other hazardous pollutants. Hence, hydrogen and fuel cells technology plays a vital role in dealing with environmental issues as well as encouraging the use of renewable carriers of energy. Ongoing product developments and innovation is expected to open new opportunities for emerging players.
Hydrogen and Fuel Cells market is segmented by region, by country, company, type, application and by sales channels. Players, stakeholders, and other participants in the global Hydrogen and Fuel Cells market will be able to gain the upper hand as they use the report as a powerful resource. The segmental analysis focuses on sales, revenue and forecast by region, by country, company, type, application and by sales channels for the period 2016-2027.
|
Report Metric |
Details |
|
Base Year: |
2021 |
|
Market Size in 2022: |
USD 4480.3 Million |
|
Forecast Period: |
2022 to 2028 |
|
Forecast Period 2022 to 2028 CAGR: |
33.1% |
|
2028 Value Projection: |
USD 24910 Million |
|
No. of Pages: |
127 |
|
Tables & Figures |
150 |
|
Segments covered: |
Type, Application, Region |
Ans. Market size of hydrogen and fuel cells crossed $4480.3 million in valuation in 2022 and is anticipated to record more than 33.1% CAGR over 2022-2028.
Ans. Major companies across the market are Panasonic, Plug Power, Ballard Power Systems, Nedstack, Hydrogenics, Intelligent Energy, Pearl Hydrogen, Sunrise Power, Toshiba, Toshiba, Honda, Hyundai Mobis, Toyota, Denso, Toshiba ESS, Ballard, SinoHytec, Honda, Hyundai Mobis, Toyota Denso, Elring Klinger, Bosch/Powercell, Symbio, Others, are positively contributing to the global market forecast.
Ans. North American market develops significantly due to commercialization and adoption of electric vehicles.
Ans. The forecast period in the hydrogen and fuel cells market report is from 2022-2028
Ans. The hydrogen and fuel cells market is segmented on the basis of type, application, and region.
Ans. The sample for the global hydrogen and fuel cells market report can be obtained on demand from the Valuates Reports website. Also, 24*7 chat support and direct call services are provided to procure the sample report.
Table of C
1 Study Coverage
1.1 Hydrogen and Fuel Cells Product Introduction
1.2 Market by Type
1.2.1 Global Hydrogen and Fuel Cells Market Size by Type, 2017 VS 2021 VS 2028
1.2.2 Air-Cooled
1.2.3 Water-Cooled
1.3 Market by Application
1.3.1 Global Hydrogen and Fuel Cells Market Size by Application, 2017 VS 2021 VS 2028
1.3.2 Stationary
1.3.3 Transport
1.3.4 Portable
1.4 Study Objectives
1.5 Years Considered
2 Global Hydrogen and Fuel Cells Production
2.1 Global Hydrogen and Fuel Cells Production Capacity (2017-2028)
2.2 Global Hydrogen and Fuel Cells Production by Region: 2017 VS 2021 VS 2028
2.3 Global Hydrogen and Fuel Cells Production by Region
2.3.1 Global Hydrogen and Fuel Cells Historic Production by Region (2017-2022)
2.3.2 Global Hydrogen and Fuel Cells Forecasted Production by Region (2023-2028)
2.4 North America
2.5 Europe
2.6 China
2.7 Japan
2.8 South Korea
3 Global Hydrogen and Fuel Cells Sales in Volume & Value Estimates and Forecasts
3.1 Global Hydrogen and Fuel Cells Sales Estimates and Forecasts 2017-2028
3.2 Global Hydrogen and Fuel Cells Revenue Estimates and Forecasts 2017-2028
3.3 Global Hydrogen and Fuel Cells Revenue by Region: 2017 VS 2021 VS 2028
3.4 Global Hydrogen and Fuel Cells Sales by Region
3.4.1 Global Hydrogen and Fuel Cells Sales by Region (2017-2022)
3.4.2 Global Sales Hydrogen and Fuel Cells by Region (2023-2028)
3.5 Global Hydrogen and Fuel Cells Revenue by Region
3.5.1 Global Hydrogen and Fuel Cells Revenue by Region (2017-2022)
3.5.2 Global Hydrogen and Fuel Cells Revenue by Region (2023-2028)
3.6 North America
3.7 Europe
3.8 Asia-Pacific
3.9 Latin America
3.10 Middle East & Africa
4 Competition by Manufactures
4.1 Global Hydrogen and Fuel Cells Production Capacity by Manufacturers
4.2 Global Hydrogen and Fuel Cells Sales by Manufacturers
4.2.1 Global Hydrogen and Fuel Cells Sales by Manufacturers (2017-2022)
4.2.2 Global Hydrogen and Fuel Cells Sales Market Share by Manufacturers (2017-2022)
4.2.3 Global Top 10 and Top 5 Largest Manufacturers of Hydrogen and Fuel Cells in 2021
4.3 Global Hydrogen and Fuel Cells Revenue by Manufacturers
4.3.1 Global Hydrogen and Fuel Cells Revenue by Manufacturers (2017-2022)
4.3.2 Global Hydrogen and Fuel Cells Revenue Market Share by Manufacturers (2017-2022)
4.3.3 Global Top 10 and Top 5 Companies by Hydrogen and Fuel Cells Revenue in 2021
4.4 Global Hydrogen and Fuel Cells Sales Price by Manufacturers
4.5 Analysis of Competitive Landscape
4.5.1 Manufacturers Market Concentration Ratio (CR5 and HHI)
4.5.2 Global Hydrogen and Fuel Cells Market Share by Company Type (Tier 1, Tier 2, and Tier 3)
4.5.3 Global Hydrogen and Fuel Cells Manufacturers Geographical Distribution
4.6 Mergers & Acquisitions, Expansion Plans
5 Market Size by Type
5.1 Global Hydrogen and Fuel Cells Sales by Type
5.1.1 Global Hydrogen and Fuel Cells Historical Sales by Type (2017-2022)
5.1.2 Global Hydrogen and Fuel Cells Forecasted Sales by Type (2023-2028)
5.1.3 Global Hydrogen and Fuel Cells Sales Market Share by Type (2017-2028)
5.2 Global Hydrogen and Fuel Cells Revenue by Type
5.2.1 Global Hydrogen and Fuel Cells Historical Revenue by Type (2017-2022)
5.2.2 Global Hydrogen and Fuel Cells Forecasted Revenue by Type (2023-2028)
5.2.3 Global Hydrogen and Fuel Cells Revenue Market Share by Type (2017-2028)
5.3 Global Hydrogen and Fuel Cells Price by Type
5.3.1 Global Hydrogen and Fuel Cells Price by Type (2017-2022)
5.3.2 Global Hydrogen and Fuel Cells Price Forecast by Type (2023-2028)
6 Market Size by Application
6.1 Global Hydrogen and Fuel Cells Sales by Application
6.1.1 Global Hydrogen and Fuel Cells Historical Sales by Application (2017-2022)
6.1.2 Global Hydrogen and Fuel Cells Forecasted Sales by Application (2023-2028)
6.1.3 Global Hydrogen and Fuel Cells Sales Market Share by Application (2017-2028)
6.2 Global Hydrogen and Fuel Cells Revenue by Application
6.2.1 Global Hydrogen and Fuel Cells Historical Revenue by Application (2017-2022)
6.2.2 Global Hydrogen and Fuel Cells Forecasted Revenue by Application (2023-2028)
6.2.3 Global Hydrogen and Fuel Cells Revenue Market Share by Application (2017-2028)
6.3 Global Hydrogen and Fuel Cells Price by Application
6.3.1 Global Hydrogen and Fuel Cells Price by Application (2017-2022)
6.3.2 Global Hydrogen and Fuel Cells Price Forecast by Application (2023-2028)
7 North America
7.1 North America Hydrogen and Fuel Cells Market Size by Type
7.1.1 North America Hydrogen and Fuel Cells Sales by Type (2017-2028)
7.1.2 North America Hydrogen and Fuel Cells Revenue by Type (2017-2028)
7.2 North America Hydrogen and Fuel Cells Market Size by Application
7.2.1 North America Hydrogen and Fuel Cells Sales by Application (2017-2028)
7.2.2 North America Hydrogen and Fuel Cells Revenue by Application (2017-2028)
7.3 North America Hydrogen and Fuel Cells Sales by Country
7.3.1 North America Hydrogen and Fuel Cells Sales by Country (2017-2028)
7.3.2 North America Hydrogen and Fuel Cells Revenue by Country (2017-2028)
7.3.3 U.S.
7.3.4 Canada
8 Europe
8.1 Europe Hydrogen and Fuel Cells Market Size by Type
8.1.1 Europe Hydrogen and Fuel Cells Sales by Type (2017-2028)
8.1.2 Europe Hydrogen and Fuel Cells Revenue by Type (2017-2028)
8.2 Europe Hydrogen and Fuel Cells Market Size by Application
8.2.1 Europe Hydrogen and Fuel Cells Sales by Application (2017-2028)
8.2.2 Europe Hydrogen and Fuel Cells Revenue by Application (2017-2028)
8.3 Europe Hydrogen and Fuel Cells Sales by Country
8.3.1 Europe Hydrogen and Fuel Cells Sales by Country (2017-2028)
8.3.2 Europe Hydrogen and Fuel Cells Revenue by Country (2017-2028)
8.3.3 Germany
8.3.4 France
8.3.5 U.K.
8.3.6 Italy
8.3.7 Russia
9 Asia Pacific
9.1 Asia Pacific Hydrogen and Fuel Cells Market Size by Type
9.1.1 Asia Pacific Hydrogen and Fuel Cells Sales by Type (2017-2028)
9.1.2 Asia Pacific Hydrogen and Fuel Cells Revenue by Type (2017-2028)
9.2 Asia Pacific Hydrogen and Fuel Cells Market Size by Application
9.2.1 Asia Pacific Hydrogen and Fuel Cells Sales by Application (2017-2028)
9.2.2 Asia Pacific Hydrogen and Fuel Cells Revenue by Application (2017-2028)
9.3 Asia Pacific Hydrogen and Fuel Cells Sales by Region
9.3.1 Asia Pacific Hydrogen and Fuel Cells Sales by Region (2017-2028)
9.3.2 Asia Pacific Hydrogen and Fuel Cells Revenue by Region (2017-2028)
9.3.3 China
9.3.4 Japan
9.3.5 South Korea
9.3.6 India
9.3.7 Australia
9.3.8 Taiwan
9.3.9 Indonesia
9.3.10 Thailand
9.3.11 Malaysia
9.3.12 Philippines
10 Latin America
10.1 Latin America Hydrogen and Fuel Cells Market Size by Type
10.1.1 Latin America Hydrogen and Fuel Cells Sales by Type (2017-2028)
10.1.2 Latin America Hydrogen and Fuel Cells Revenue by Type (2017-2028)
10.2 Latin America Hydrogen and Fuel Cells Market Size by Application
10.2.1 Latin America Hydrogen and Fuel Cells Sales by Application (2017-2028)
10.2.2 Latin America Hydrogen and Fuel Cells Revenue by Application (2017-2028)
10.3 Latin America Hydrogen and Fuel Cells Sales by Country
10.3.1 Latin America Hydrogen and Fuel Cells Sales by Country (2017-2028)
10.3.2 Latin America Hydrogen and Fuel Cells Revenue by Country (2017-2028)
10.3.3 Mexico
10.3.4 Brazil
10.3.5 Argentina
11 Middle East and Africa
11.1 Middle East and Africa Hydrogen and Fuel Cells Market Size by Type
11.1.1 Middle East and Africa Hydrogen and Fuel Cells Sales by Type (2017-2028)
11.1.2 Middle East and Africa Hydrogen and Fuel Cells Revenue by Type (2017-2028)
11.2 Middle East and Africa Hydrogen and Fuel Cells Market Size by Application
11.2.1 Middle East and Africa Hydrogen and Fuel Cells Sales by Application (2017-2028)
11.2.2 Middle East and Africa Hydrogen and Fuel Cells Revenue by Application (2017-2028)
11.3 Middle East and Africa Hydrogen and Fuel Cells Sales by Country
11.3.1 Middle East and Africa Hydrogen and Fuel Cells Sales by Country (2017-2028)
11.3.2 Middle East and Africa Hydrogen and Fuel Cells Revenue by Country (2017-2028)
11.3.3 Turkey
11.3.4 Saudi Arabia
11.3.5 U.A.E
12 Corporate Profiles
12.1 Panasonic
12.1.1 Panasonic Corporation Information
12.1.2 Panasonic Overview
12.1.3 Panasonic Hydrogen and Fuel Cells Sales, Price, Revenue and Gross Margin (2017-2022)
12.1.4 Panasonic Hydrogen and Fuel Cells Product Model Numbers, Pictures, Descriptions and Specifications
12.1.5 Panasonic Recent Developments
12.2 Plug Power
12.2.1 Plug Power Corporation Information
12.2.2 Plug Power Overview
12.2.3 Plug Power Hydrogen and Fuel Cells Sales, Price, Revenue and Gross Margin (2017-2022)
12.2.4 Plug Power Hydrogen and Fuel Cells Product Model Numbers, Pictures, Descriptions and Specifications
12.2.5 Plug Power Recent Developments
12.3 Toshiba ESS
12.3.1 Toshiba ESS Corporation Information
12.3.2 Toshiba ESS Overview
12.3.3 Toshiba ESS Hydrogen and Fuel Cells Sales, Price, Revenue and Gross Margin (2017-2022)
12.3.4 Toshiba ESS Hydrogen and Fuel Cells Product Model Numbers, Pictures, Descriptions and Specifications
12.3.5 Toshiba ESS Recent Developments
12.4 Ballard
12.4.1 Ballard Corporation Information
12.4.2 Ballard Overview
12.4.3 Ballard Hydrogen and Fuel Cells Sales, Price, Revenue and Gross Margin (2017-2022)
12.4.4 Ballard Hydrogen and Fuel Cells Product Model Numbers, Pictures, Descriptions and Specifications
12.4.5 Ballard Recent Developments
12.5 SinoHytec
12.5.1 SinoHytec Corporation Information
12.5.2 SinoHytec Overview
12.5.3 SinoHytec Hydrogen and Fuel Cells Sales, Price, Revenue and Gross Margin (2017-2022)
12.5.4 SinoHytec Hydrogen and Fuel Cells Product Model Numbers, Pictures, Descriptions and Specifications
12.5.5 SinoHytec Recent Developments
12.6 Hydrogenics
12.6.1 Hydrogenics Corporation Information
12.6.2 Hydrogenics Overview
12.6.3 Hydrogenics Hydrogen and Fuel Cells Sales, Price, Revenue and Gross Margin (2017-2022)
12.6.4 Hydrogenics Hydrogen and Fuel Cells Product Model Numbers, Pictures, Descriptions and Specifications
12.6.5 Hydrogenics Recent Developments
12.7 Honda
12.7.1 Honda Corporation Information
12.7.2 Honda Overview
12.7.3 Honda Hydrogen and Fuel Cells Sales, Price, Revenue and Gross Margin (2017-2022)
12.7.4 Honda Hydrogen and Fuel Cells Product Model Numbers, Pictures, Descriptions and Specifications
12.7.5 Honda Recent Developments
12.8 Hyundai Mobis
12.8.1 Hyundai Mobis Corporation Information
12.8.2 Hyundai Mobis Overview
12.8.3 Hyundai Mobis Hydrogen and Fuel Cells Sales, Price, Revenue and Gross Margin (2017-2022)
12.8.4 Hyundai Mobis Hydrogen and Fuel Cells Product Model Numbers, Pictures, Descriptions and Specifications
12.8.5 Hyundai Mobis Recent Developments
12.9 Toyota Denso
12.9.1 Toyota Denso Corporation Information
12.9.2 Toyota Denso Overview
12.9.3 Toyota Denso Hydrogen and Fuel Cells Sales, Price, Revenue and Gross Margin (2017-2022)
12.9.4 Toyota Denso Hydrogen and Fuel Cells Product Model Numbers, Pictures, Descriptions and Specifications
12.9.5 Toyota Denso Recent Developments
12.10 Elring Klinger
12.10.1 Elring Klinger Corporation Information
12.10.2 Elring Klinger Overview
12.10.3 Elring Klinger Hydrogen and Fuel Cells Sales, Price, Revenue and Gross Margin (2017-2022)
12.10.4 Elring Klinger Hydrogen and Fuel Cells Product Model Numbers, Pictures, Descriptions and Specifications
12.10.5 Elring Klinger Recent Developments
12.11 Bosch/Powercell
12.11.1 Bosch/Powercell Corporation Information
12.11.2 Bosch/Powercell Overview
12.11.3 Bosch/Powercell Hydrogen and Fuel Cells Sales, Price, Revenue and Gross Margin (2017-2022)
12.11.4 Bosch/Powercell Hydrogen and Fuel Cells Product Model Numbers, Pictures, Descriptions and Specifications
12.11.5 Bosch/Powercell Recent Developments
12.12 Symbio
12.12.1 Symbio Corporation Information
12.12.2 Symbio Overview
12.12.3 Symbio Hydrogen and Fuel Cells Sales, Price, Revenue and Gross Margin (2017-2022)
12.12.4 Symbio Hydrogen and Fuel Cells Product Model Numbers, Pictures, Descriptions and Specifications
12.12.5 Symbio Recent Developments
13 Industry Chain and Sales Channels Analysis
13.1 Hydrogen and Fuel Cells Industry Chain Analysis
13.2 Hydrogen and Fuel Cells Key Raw Materials
13.2.1 Key Raw Materials
13.2.2 Raw Materials Key Suppliers
13.3 Hydrogen and Fuel Cells Production Mode & Process
13.4 Hydrogen and Fuel Cells Sales and Marketing
13.4.1 Hydrogen and Fuel Cells Sales Channels
13.4.2 Hydrogen and Fuel Cells Distributors
13.5 Hydrogen and Fuel Cells Customers
14 Market Drivers, Opportunities, Challenges and Risks Factors Analysis
14.1 Hydrogen and Fuel Cells Industry Trends
14.2 Hydrogen and Fuel Cells Market Drivers
14.3 Hydrogen and Fuel Cells Market Challenges
14.4 Hydrogen and Fuel Cells Market Restraints
15 Key Finding in The Global Hydrogen and Fuel Cells Study
16 Appendix
16.1 Research Methodology
16.1.1 Methodology/Research Approach
16.1.2 Data Source
16.2 Author Details
16.3 Disclaimer
Table 1. Global Hydrogen and Fuel Cells Market Size Growth Rate by Type, 2017 VS 2021 VS 2028 (US$ Million)
Table 2. Major Manufacturers of Air-Cooled
Table 3. Major Manufacturers of Water-Cooled
Table 4. Global Hydrogen and Fuel Cells Market Size Growth Rate by Application, 2017 VS 2021 2028 (US$ Million)
Table 5. Global Hydrogen and Fuel Cells Production by Region: 2017 VS 2021 VS 2028 (MW)
Table 6. Global Hydrogen and Fuel Cells Production by Region (2017-2022) & (MW)
Table 7. Global Hydrogen and Fuel Cells Production Market Share by Region (2017-2022)
Table 8. Global Hydrogen and Fuel Cells Production by Region (2023-2028) & (MW)
Table 9. Global Hydrogen and Fuel Cells Production Market Share by Region (2023-2028)
Table 10. Global Hydrogen and Fuel Cells Revenue by Region: 2017 VS 2021 VS 2028 (US$ Million)
Table 11. Global Hydrogen and Fuel Cells Sales by Region (2017-2022) & (MW)
Table 12. Global Hydrogen and Fuel Cells Sales Market Share by Region (2017-2022)
Table 13. Global Hydrogen and Fuel Cells Sales by Region (2023-2028) & (MW)
Table 14. Global Hydrogen and Fuel Cells Sales Market Share by Region (2023-2028)
Table 15. Global Hydrogen and Fuel Cells Revenue by Region (2017-2022) & (US$ Million)
Table 16. Global Hydrogen and Fuel Cells Revenue Market Share by Region (2017-2022)
Table 17. Global Hydrogen and Fuel Cells Revenue by Region (2023-2028) & (US$ Million)
Table 18. Global Hydrogen and Fuel Cells Revenue Market Share by Region (2023-2028)
Table 19. Global Hydrogen and Fuel Cells Production Capacity by Manufacturers (2017-2022) & (MW)
Table 20. Global Hydrogen and Fuel Cells Capacity Market Share by Manufacturers (2017-2022)
Table 21. Global Hydrogen and Fuel Cells Sales by Manufacturers (2017-2022) & (MW)
Table 22. Global Hydrogen and Fuel Cells Sales Market Share by Manufacturers (2017-2022)
Table 23. Global Hydrogen and Fuel Cells Revenue by Manufacturers (2017-2022) & (US$ Million)
Table 24. Global Hydrogen and Fuel Cells Revenue Share by Manufacturers (2017-2022)
Table 25. Hydrogen and Fuel Cells Price by Manufacturers 2017-2022 (USD/KW)
Table 26. Global Hydrogen and Fuel Cells Manufacturers Market Concentration Ratio (CR5 and HHI)
Table 27. Global Hydrogen and Fuel Cells by Company Type (Tier 1, Tier 2, and Tier 3) & (based on the Revenue in Hydrogen and Fuel Cells as of 2021)
Table 28. Hydrogen and Fuel Cells Manufacturing Base Distribution and Headquarters
Table 29. Manufacturers Hydrogen and Fuel Cells Product Offered
Table 30. Date of Manufacturers Enter into Hydrogen and Fuel Cells Market
Table 31. Mergers & Acquisitions, Expansion Plans
Table 32. Global Hydrogen and Fuel Cells Sales by Type (2017-2022) & (MW)
Table 33. Global Hydrogen and Fuel Cells Sales by Type (2023-2028) & (MW)
Table 34. Global Hydrogen and Fuel Cells Sales Share by Type (2017-2022)
Table 35. Global Hydrogen and Fuel Cells Sales Share by Type (2023-2028)
Table 36. Global Hydrogen and Fuel Cells Revenue by Type (2017-2022) & (US$ Million)
Table 37. Global Hydrogen and Fuel Cells Revenue by Type (2023-2028) & (US$ Million)
Table 38. Global Hydrogen and Fuel Cells Revenue Share by Type (2017-2022)
Table 39. Global Hydrogen and Fuel Cells Revenue Share by Type (2023-2028)
Table 40. Hydrogen and Fuel Cells Price by Type (2017-2022) & (USD/KW)
Table 41. Global Hydrogen and Fuel Cells Price Forecast by Type (2023-2028) & (USD/KW)
Table 42. Global Hydrogen and Fuel Cells Sales by Application (2017-2022) & (MW)
Table 43. Global Hydrogen and Fuel Cells Sales by Application (2023-2028) & (MW)
Table 44. Global Hydrogen and Fuel Cells Sales Share by Application (2017-2022)
Table 45. Global Hydrogen and Fuel Cells Sales Share by Application (2023-2028)
Table 46. Global Hydrogen and Fuel Cells Revenue by Application (2017-2022) & (US$ Million)
Table 47. Global Hydrogen and Fuel Cells Revenue by Application (2023-2028) & (US$ Million)
Table 48. Global Hydrogen and Fuel Cells Revenue Share by Application (2017-2022)
Table 49. Global Hydrogen and Fuel Cells Revenue Share by Application (2023-2028)
Table 50. Hydrogen and Fuel Cells Price by Application (2017-2022) & (USD/KW)
Table 51. Global Hydrogen and Fuel Cells Price Forecast by Application (2023-2028) & (USD/KW)
Table 52. North America Hydrogen and Fuel Cells Sales by Type (2017-2022) & (MW)
Table 53. North America Hydrogen and Fuel Cells Sales by Type (2023-2028) & (MW)
Table 54. North America Hydrogen and Fuel Cells Revenue by Type (2017-2022) & (US$ Million)
Table 55. North America Hydrogen and Fuel Cells Revenue by Type (2023-2028) & (US$ Million)
Table 56. North America Hydrogen and Fuel Cells Sales by Application (2017-2022) & (MW)
Table 57. North America Hydrogen and Fuel Cells Sales by Application (2023-2028) & (MW)
Table 58. North America Hydrogen and Fuel Cells Revenue by Application (2017-2022) & (US$ Million)
Table 59. North America Hydrogen and Fuel Cells Revenue by Application (2023-2028) & (US$ Million)
Table 60. North America Hydrogen and Fuel Cells Sales by Country (2017-2022) & (MW)
Table 61. North America Hydrogen and Fuel Cells Sales by Country (2023-2028) & (MW)
Table 62. North America Hydrogen and Fuel Cells Revenue by Country (2017-2022) & (US$ Million)
Table 63. North America Hydrogen and Fuel Cells Revenue by Country (2023-2028) & (US$ Million)
Table 64. Europe Hydrogen and Fuel Cells Sales by Type (2017-2022) & (MW)
Table 65. Europe Hydrogen and Fuel Cells Sales by Type (2023-2028) & (MW)
Table 66. Europe Hydrogen and Fuel Cells Revenue by Type (2017-2022) & (US$ Million)
Table 67. Europe Hydrogen and Fuel Cells Revenue by Type (2023-2028) & (US$ Million)
Table 68. Europe Hydrogen and Fuel Cells Sales by Application (2017-2022) & (MW)
Table 69. Europe Hydrogen and Fuel Cells Sales by Application (2023-2028) & (MW)
Table 70. Europe Hydrogen and Fuel Cells Revenue by Application (2017-2022) & (US$ Million)
Table 71. Europe Hydrogen and Fuel Cells Revenue by Application (2023-2028) & (US$ Million)
Table 72. Europe Hydrogen and Fuel Cells Sales by Country (2017-2022) & (MW)
Table 73. Europe Hydrogen and Fuel Cells Sales by Country (2023-2028) & (MW)
Table 74. Europe Hydrogen and Fuel Cells Revenue by Country (2017-2022) & (US$ Million)
Table 75. Europe Hydrogen and Fuel Cells Revenue by Country (2023-2028) & (US$ Million)
Table 76. Asia Pacific Hydrogen and Fuel Cells Sales by Type (2017-2022) & (MW)
Table 77. Asia Pacific Hydrogen and Fuel Cells Sales by Type (2023-2028) & (MW)
Table 78. Asia Pacific Hydrogen and Fuel Cells Revenue by Type (2017-2022) & (US$ Million)
Table 79. Asia Pacific Hydrogen and Fuel Cells Revenue by Type (2023-2028) & (US$ Million)
Table 80. Asia Pacific Hydrogen and Fuel Cells Sales by Application (2017-2022) & (MW)
Table 81. Asia Pacific Hydrogen and Fuel Cells Sales by Application (2023-2028) & (MW)
Table 82. Asia Pacific Hydrogen and Fuel Cells Revenue by Application (2017-2022) & (US$ Million)
Table 83. Asia Pacific Hydrogen and Fuel Cells Revenue by Application (2023-2028) & (US$ Million)
Table 84. Asia Pacific Hydrogen and Fuel Cells Sales by Region (2017-2022) & (MW)
Table 85. Asia Pacific Hydrogen and Fuel Cells Sales by Region (2023-2028) & (MW)
Table 86. Asia Pacific Hydrogen and Fuel Cells Revenue by Region (2017-2022) & (US$ Million)
Table 87. Asia Pacific Hydrogen and Fuel Cells Revenue by Region (2023-2028) & (US$ Million)
Table 88. Latin America Hydrogen and Fuel Cells Sales by Type (2017-2022) & (MW)
Table 89. Latin America Hydrogen and Fuel Cells Sales by Type (2023-2028) & (MW)
Table 90. Latin America Hydrogen and Fuel Cells Revenue by Type (2017-2022) & (US$ Million)
Table 91. Latin America Hydrogen and Fuel Cells Revenue by Type (2023-2028) & (US$ Million)
Table 92. Latin America Hydrogen and Fuel Cells Sales by Application (2017-2022) & (MW)
Table 93. Latin America Hydrogen and Fuel Cells Sales by Application (2023-2028) & (MW)
Table 94. Latin America Hydrogen and Fuel Cells Revenue by Application (2017-2022) & (US$ Million)
Table 95. Latin America Hydrogen and Fuel Cells Revenue by Application (2023-2028) & (US$ Million)
Table 96. Latin America Hydrogen and Fuel Cells Sales by Country (2017-2022) & (MW)
Table 97. Latin America Hydrogen and Fuel Cells Sales by Country (2023-2028) & (MW)
Table 98. Latin America Hydrogen and Fuel Cells Revenue by Country (2017-2022) & (US$ Million)
Table 99. Latin America Hydrogen and Fuel Cells Revenue by Country (2023-2028) & (US$ Million)
Table 100. Middle East and Africa Hydrogen and Fuel Cells Sales by Type (2017-2022) & (MW)
Table 101. Middle East and Africa Hydrogen and Fuel Cells Sales by Type (2023-2028) & (MW)
Table 102. Middle East and Africa Hydrogen and Fuel Cells Revenue by Type (2017-2022) & (US$ Million)
Table 103. Middle East and Africa Hydrogen and Fuel Cells Revenue by Type (2023-2028) & (US$ Million)
Table 104. Middle East and Africa Hydrogen and Fuel Cells Sales by Application (2017-2022) & (MW)
Table 105. Middle East and Africa Hydrogen and Fuel Cells Sales by Application (2023-2028) & (MW)
Table 106. Middle East and Africa Hydrogen and Fuel Cells Revenue by Application (2017-2022) & (US$ Million)
Table 107. Middle East and Africa Hydrogen and Fuel Cells Revenue by Application (2023-2028) & (US$ Million)
Table 108. Middle East and Africa Hydrogen and Fuel Cells Sales by Country (2017-2022) & (MW)
Table 109. Middle East and Africa Hydrogen and Fuel Cells Sales by Country (2023-2028) & (MW)
Table 110. Middle East and Africa Hydrogen and Fuel Cells Revenue by Country (2017-2022) & (US$ Million)
Table 111. Middle East and Africa Hydrogen and Fuel Cells Revenue by Country (2023-2028) & (US$ Million)
Table 112. Panasonic Corporation Information
Table 113. Panasonic Description and Major Businesses
Table 114. Panasonic Hydrogen and Fuel Cells Sales (MW), Revenue (US$ Million), Price (USD/KW) and Gross Margin (2017-2022)
Table 115. Panasonic Hydrogen and Fuel Cells Product Model Numbers, Pictures, Descriptions and Specifications
Table 116. Panasonic Recent Development
Table 117. Plug Power Corporation Information
Table 118. Plug Power Description and Major Businesses
Table 119. Plug Power Hydrogen and Fuel Cells Sales (MW), Revenue (US$ Million), Price (USD/KW) and Gross Margin (2017-2022)
Table 120. Plug Power Hydrogen and Fuel Cells Product Model Numbers, Pictures, Descriptions and Specifications
Table 121. Plug Power Recent Development
Table 122. Toshiba ESS Corporation Information
Table 123. Toshiba ESS Description and Major Businesses
Table 124. Toshiba ESS Hydrogen and Fuel Cells Sales (MW), Revenue (US$ Million), Price (USD/KW) and Gross Margin (2017-2022)
Table 125. Toshiba ESS Hydrogen and Fuel Cells Product Model Numbers, Pictures, Descriptions and Specifications
Table 126. Toshiba ESS Recent Development
Table 127. Ballard Corporation Information
Table 128. Ballard Description and Major Businesses
Table 129. Ballard Hydrogen and Fuel Cells Sales (MW), Revenue (US$ Million), Price (USD/KW) and Gross Margin (2017-2022)
Table 130. Ballard Hydrogen and Fuel Cells Product Model Numbers, Pictures, Descriptions and Specifications
Table 131. Ballard Recent Development
Table 132. SinoHytec Corporation Information
Table 133. SinoHytec Description and Major Businesses
Table 134. SinoHytec Hydrogen and Fuel Cells Sales (MW), Revenue (US$ Million), Price (USD/KW) and Gross Margin (2017-2022)
Table 135. SinoHytec Hydrogen and Fuel Cells Product Model Numbers, Pictures, Descriptions and Specifications
Table 136. SinoHytec Recent Development
Table 137. Hydrogenics Corporation Information
Table 138. Hydrogenics Description and Major Businesses
Table 139. Hydrogenics Hydrogen and Fuel Cells Sales (MW), Revenue (US$ Million), Price (USD/KW) and Gross Margin (2017-2022)
Table 140. Hydrogenics Hydrogen and Fuel Cells Product Model Numbers, Pictures, Descriptions and Specifications
Table 141. Hydrogenics Recent Development
Table 142. Honda Corporation Information
Table 143. Honda Description and Major Businesses
Table 144. Honda Hydrogen and Fuel Cells Sales (MW), Revenue (US$ Million), Price (USD/KW) and Gross Margin (2017-2022)
Table 145. Honda Hydrogen and Fuel Cells Product Model Numbers, Pictures, Descriptions and Specifications
Table 146. Honda Recent Development
Table 147. Hyundai Mobis Corporation Information
Table 148. Hyundai Mobis Description and Major Businesses
Table 149. Hyundai Mobis Hydrogen and Fuel Cells Sales (MW), Revenue (US$ Million), Price (USD/KW) and Gross Margin (2017-2022)
Table 150. Hyundai Mobis Hydrogen and Fuel Cells Product Model Numbers, Pictures, Descriptions and Specifications
Table 151. Hyundai Mobis Recent Development
Table 152. Toyota Denso Corporation Information
Table 153. Toyota Denso Description and Major Businesses
Table 154. Toyota Denso Hydrogen and Fuel Cells Sales (MW), Revenue (US$ Million), Price (USD/KW) and Gross Margin (2017-2022)
Table 155. Toyota Denso Hydrogen and Fuel Cells Product Model Numbers, Pictures, Descriptions and Specifications
Table 156. Toyota Denso Recent Development
Table 157. Elring Klinger Corporation Information
Table 158. Elring Klinger Description and Major Businesses
Table 159. Elring Klinger Hydrogen and Fuel Cells Sales (MW), Revenue (US$ Million), Price (USD/KW) and Gross Margin (2017-2022)
Table 160. Elring Klinger Hydrogen and Fuel Cells Product Model Numbers, Pictures, Descriptions and Specifications
Table 161. Elring Klinger Recent Development
Table 162. Bosch/Powercell Corporation Information
Table 163. Bosch/Powercell Description and Major Businesses
Table 164. Bosch/Powercell Hydrogen and Fuel Cells Sales (MW), Revenue (US$ Million), Price (USD/KW) and Gross Margin (2017-2022)
Table 165. Bosch/Powercell Hydrogen and Fuel Cells Product Model Numbers, Pictures, Descriptions and Specifications
Table 166. Bosch/Powercell Recent Development
Table 167. Symbio Corporation Information
Table 168. Symbio Description and Major Businesses
Table 169. Symbio Hydrogen and Fuel Cells Sales (MW), Revenue (US$ Million), Price (USD/KW) and Gross Margin (2017-2022)
Table 170. Symbio Hydrogen and Fuel Cells Product Model Numbers, Pictures, Descriptions and Specifications
Table 171. Symbio Recent Development
Table 172. Key Raw Materials Lists
Table 173. Raw Materials Key Suppliers Lists
Table 174. Hydrogen and Fuel Cells Distributors List
Table 175. Hydrogen and Fuel Cells Customers List
Table 176. Hydrogen and Fuel Cells Market Trends
Table 177. Hydrogen and Fuel Cells Market Drivers
Table 178. Hydrogen and Fuel Cells Market Challenges
Table 179. Hydrogen and Fuel Cells Market Restraints
Table 180. Research Programs/Design for This Report
Table 181. Key Data Information from Secondary Sources
Table 182. Key Data Information from Primary Sources
List of Figures
Figure 1. Hydrogen and Fuel Cells Product Picture
Figure 2. Global Hydrogen and Fuel Cells Market Share by Type in 2021 & 2028
Figure 3. Air-Cooled Product Picture
Figure 4. Water-Cooled Product Picture
Figure 5. Global Hydrogen and Fuel Cells Market Share by Application in 2021 & 2028
Figure 6. Stationary
Figure 7. Transport
Figure 8. Portable
Figure 9. Hydrogen and Fuel Cells Report Years Considered
Figure 10. Global Hydrogen and Fuel Cells Capacity, Production and Utilization (2017-2028) & (MW)
Figure 11. Global Hydrogen and Fuel Cells Production Market Share by Region in Percentage: 2021 Versus 2028
Figure 12. Global Hydrogen and Fuel Cells Production Market Share by Region (2017-2022)
Figure 13. Global Hydrogen and Fuel Cells Production Market Share by Region (2023-2028)
Figure 14. Hydrogen and Fuel Cells Production Growth Rate in North America (2017-2028) & (MW)
Figure 15. Hydrogen and Fuel Cells Production Growth Rate in Europe (2017-2028) & (MW)
Figure 16. Hydrogen and Fuel Cells Production Growth Rate in China (2017-2028) & (MW)
Figure 17. Hydrogen and Fuel Cells Production Growth Rate in Japan (2017-2028) & (MW)
Figure 18. Hydrogen and Fuel Cells Production Growth Rate in South Korea (2017-2028) & (MW)
Figure 19. Global Hydrogen and Fuel Cells Sales 2017-2028 (MW)
Figure 20. Global Hydrogen and Fuel Cells Revenue, (US$ Million), 2017 VS 2021 VS 2028
Figure 21. Global Hydrogen and Fuel Cells Revenue 2017-2028 (US$ Million)
Figure 22. Global Hydrogen and Fuel Cells Revenue Market Share by Region in Percentage: 2021 Versus 2028
Figure 23. Global Hydrogen and Fuel Cells Sales Market Share by Region (2017-2022)
Figure 24. Global Hydrogen and Fuel Cells Sales Market Share by Region (2023-2028)
Figure 25. North America Hydrogen and Fuel Cells Sales YoY (2017-2028) & (MW)
Figure 26. North America Hydrogen and Fuel Cells Revenue YoY (2017-2028) & (US$ Million)
Figure 27. Europe Hydrogen and Fuel Cells Sales YoY (2017-2028) & (MW)
Figure 28. Europe Hydrogen and Fuel Cells Revenue YoY (2017-2028) & (US$ Million)
Figure 29. Asia-Pacific Hydrogen and Fuel Cells Sales YoY (2017-2028) & (MW)
Figure 30. Asia-Pacific Hydrogen and Fuel Cells Revenue YoY (2017-2028) & (US$ Million)
Figure 31. Latin America Hydrogen and Fuel Cells Sales YoY (2017-2028) & (MW)
Figure 32. Latin America Hydrogen and Fuel Cells Revenue YoY (2017-2028) & (US$ Million)
Figure 33. Middle East & Africa Hydrogen and Fuel Cells Sales YoY (2017-2028) & (MW)
Figure 34. Middle East & Africa Hydrogen and Fuel Cells Revenue YoY (2017-2028) & (US$ Million)
Figure 35. The Hydrogen and Fuel Cells Market Share of Top 10 and Top 5 Largest Manufacturers Around the World in 2021
Figure 36. The Top 5 and 10 Largest Manufacturers of Hydrogen and Fuel Cells in the World: Market Share by Hydrogen and Fuel Cells Revenue in 2021
Figure 37. Hydrogen and Fuel Cells Market Share by Company Type (Tier 1, Tier 2, and Tier 3): 2017 VS 2021
Figure 38. Global Hydrogen and Fuel Cells Sales Market Share by Type (2017-2028)
Figure 39. Global Hydrogen and Fuel Cells Revenue Market Share by Type (2017-2028)
Figure 40. Global Hydrogen and Fuel Cells Sales Market Share by Application (2017-2028)
Figure 41. Global Hydrogen and Fuel Cells Revenue Market Share by Application (2017-2028)
Figure 42. North America Hydrogen and Fuel Cells Sales Market Share by Type (2017-2028)
Figure 43. North America Hydrogen and Fuel Cells Revenue Market Share by Type (2017-2028)
Figure 44. North America Hydrogen and Fuel Cells Sales Market Share by Application (2017-2028)
Figure 45. North America Hydrogen and Fuel Cells Revenue Market Share by Application (2017-2028)
Figure 46. North America Hydrogen and Fuel Cells Sales Share by Country (2017-2028)
Figure 47. North America Hydrogen and Fuel Cells Revenue Share by Country (2017-2028)
Figure 48. U.S. Hydrogen and Fuel Cells Revenue (2017-2028) & (US$ Million)
Figure 49. Canada Hydrogen and Fuel Cells Revenue (2017-2028) & (US$ Million)
Figure 50. Europe Hydrogen and Fuel Cells Sales Market Share by Type (2017-2028)
Figure 51. Europe Hydrogen and Fuel Cells Revenue Market Share by Type (2017-2028)
Figure 52. Europe Hydrogen and Fuel Cells Sales Market Share by Application (2017-2028)
Figure 53. Europe Hydrogen and Fuel Cells Revenue Market Share by Application (2017-2028)
Figure 54. Europe Hydrogen and Fuel Cells Sales Share by Country (2017-2028)
Figure 55. Europe Hydrogen and Fuel Cells Revenue Share by Country (2017-2028)
Figure 56. Germany Hydrogen and Fuel Cells Revenue (2017-2028) & (US$ Million)
Figure 57. France Hydrogen and Fuel Cells Revenue (2017-2028) & (US$ Million)
Figure 58. U.K. Hydrogen and Fuel Cells Revenue (2017-2028) & (US$ Million)
Figure 59. Italy Hydrogen and Fuel Cells Revenue (2017-2028) & (US$ Million)
Figure 60. Russia Hydrogen and Fuel Cells Revenue (2017-2028) & (US$ Million)
Figure 61. Asia Pacific Hydrogen and Fuel Cells Sales Market Share by Type (2017-2028)
Figure 62. Asia Pacific Hydrogen and Fuel Cells Revenue Market Share by Type (2017-2028)
Figure 63. Asia Pacific Hydrogen and Fuel Cells Sales Market Share by Application (2017-2028)
Figure 64. Asia Pacific Hydrogen and Fuel Cells Revenue Market Share by Application (2017-2028)
Figure 65. Asia Pacific Hydrogen and Fuel Cells Sales Share by Region (2017-2028)
Figure 66. Asia Pacific Hydrogen and Fuel Cells Revenue Share by Region (2017-2028)
Figure 67. China Hydrogen and Fuel Cells Revenue (2017-2028) & (US$ Million)
Figure 68. Japan Hydrogen and Fuel Cells Revenue (2017-2028) & (US$ Million)
Figure 69. South Korea Hydrogen and Fuel Cells Revenue (2017-2028) & (US$ Million)
Figure 70. India Hydrogen and Fuel Cells Revenue (2017-2028) & (US$ Million)
Figure 71. Australia Hydrogen and Fuel Cells Revenue (2017-2028) & (US$ Million)
Figure 72. Taiwan Hydrogen and Fuel Cells Revenue (2017-2028) & (US$ Million)
Figure 73. Indonesia Hydrogen and Fuel Cells Revenue (2017-2028) & (US$ Million)
Figure 74. Thailand Hydrogen and Fuel Cells Revenue (2017-2028) & (US$ Million)
Figure 75. Malaysia Hydrogen and Fuel Cells Revenue (2017-2028) & (US$ Million)
Figure 76. Philippines Hydrogen and Fuel Cells Revenue (2017-2028) & (US$ Million)
Figure 77. Latin America Hydrogen and Fuel Cells Sales Market Share by Type (2017-2028)
Figure 78. Latin America Hydrogen and Fuel Cells Revenue Market Share by Type (2017-2028)
Figure 79. Latin America Hydrogen and Fuel Cells Sales Market Share by Application (2017-2028)
Figure 80. Latin America Hydrogen and Fuel Cells Revenue Market Share by Application (2017-2028)
Figure 81. Latin America Hydrogen and Fuel Cells Sales Share by Country (2017-2028)
Figure 82. Latin America Hydrogen and Fuel Cells Revenue Share by Country (2017-2028)
Figure 83. Mexico Hydrogen and Fuel Cells Revenue (2017-2028) & (US$ Million)
Figure 84. Brazil Hydrogen and Fuel Cells Revenue (2017-2028) & (US$ Million)
Figure 85. Argentina Hydrogen and Fuel Cells Revenue (2017-2028) & (US$ Million)
Figure 86. Middle East and Africa Hydrogen and Fuel Cells Sales Market Share by Type (2017-2028)
Figure 87. Middle East and Africa Hydrogen and Fuel Cells Revenue Market Share by Type (2017-2028)
Figure 88. Middle East and Africa Hydrogen and Fuel Cells Sales Market Share by Application (2017-2028)
Figure 89. Middle East and Africa Hydrogen and Fuel Cells Revenue Market Share by Application (2017-2028)
Figure 90. Middle East and Africa Hydrogen and Fuel Cells Sales Share by Country (2017-2028)
Figure 91. Middle East and Africa Hydrogen and Fuel Cells Revenue Share by Country (2017-2028)
Figure 92. Turkey Hydrogen and Fuel Cells Revenue (2017-2028) & (US$ Million)
Figure 93. Saudi Arabia Hydrogen and Fuel Cells Revenue (2017-2028) & (US$ Million)
Figure 94. U.A.E Hydrogen and Fuel Cells Revenue (2017-2028) & (US$ Million)
Figure 95. Hydrogen and Fuel Cells Value Chain
Figure 96. Hydrogen and Fuel Cells Production Process
Figure 97. Channels of Distribution
Figure 98. Distributors Profiles
Figure 99. Bottom-up and Top-down Approaches for This Report
Figure 100. Data Triangulation
Figure 101. Key Executives Interviewed
$5900
$8850
$11800
