
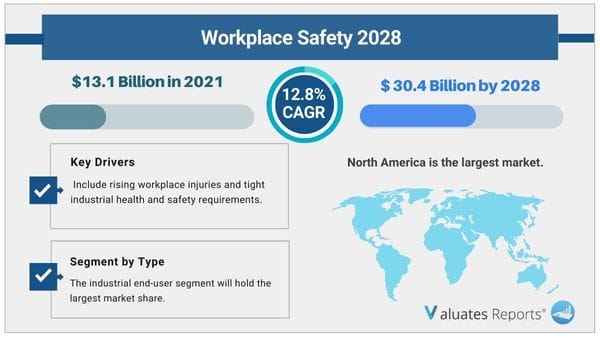
The global Workplace Safety market size is projected to reach 30.4 Billion USD by 2028, from 13.1 Billion USD in 2021, at a CAGR of 12.8% during 2022-2028.
Rising workplace injuries and stringent industrial health and safety regulations are some of the factors affecting the Workplace Safety market's rise.
As long as enterprises can utilize software and services for environmental, health, and safety management of their generated rubbish, the market will grow. In addition, it is projected that the market for environmental health and safety would expand as a result of the success and abundance of mobile applications focused on these issues.
Using effective safety management software, managers can create customized checklists. Workers can exert themselves fully and courageously when there are the proper signs, safety railing, three-point handrail, and anti-slip flooring, for example. When field agent has confidence in their car, they will leave the job site as soon as they can and without hesitation. Such minute things can significantly affect confidence levels and give off a positive aura.
Workplace safety systems are designed to protect against a variety of ergonomic, chemical, physical, and biological risks. Therefore, as concerns about occupational safety grow, so does the need for workplace safety solutions. The growing demand for dependable safety solutions to safeguard assets and personal security is fueling the significant expansion of the workplace safety market.
The existence of strict rules and regulations relating to the protection of the environment and occupational health and safety has led to an increase in the demand for environmental health & safety services that help in monitoring various services such as water conservation, waste management, employee safety, monitoring, emission control, and many others.
Additionally, the compulsory use of industrial safety solutions in workplaces is one of the main reasons the workplace safety industry is growing. Initiatives taken by various governmental and regulatory bodies, such as the National Institute for Occupational Safety and Health (NIOSH) and the Occupational Safety and Health Administration, are expected to hasten the adoption of workplace safety solutions (OSHA).
Workplace Safety market growth is mostly attributed to the usage of safety data as a predictive tool for risk management and the growing incorporation of big data into safety solutions. Because of the impressive growth that the surveillance industry is going through, especially in Europe and North America, the requirement for workplace safety solutions is anticipated to grow during the projected period. A number of businesses have started deploying real-time location monitoring systems (RTLMS), environmental health and safety systems (EHS), and monitoring and surveillance solutions to safeguard their assets as the market for workplace safety has expanded. Because of the industrial internet of things, there is significant growth potential in the Workplace Safety market for industrial safety solutions (IIoT).
North America would be the most profitable region overall during the projection period. North America is predicted to command the largest market share in the workplace safety sector. It is one of the most developed areas in terms of infrastructure and security technology usage. A number of sectors in the area are increasingly using cloud computing, which has boosted the demand for cloud-based workplace safety solutions.
Depending on the application, the industrial end-user category is likely to hold the biggest market share during the predicted years. The industrial sector includes mining, construction, oil and gas, transportation, pharmaceuticals, semiconductor, and energy and electricity. It also includes aerospace and defense.
|
Report Metric |
Details |
|
Report Name |
Workplace Safety Market |
|
The market size in 2021 |
USD 13.1 Billion |
|
The revenue forecast in 2028 |
USD 30.4 Billion |
|
Growth Rate |
Compound Annual Growth Rate (CAGR) of 12.8% from 2022 to 2028 |
|
Market size available for years |
2022-2028 |
|
Forecast units |
Value (USD) |
|
Segments covered |
By Type, Application, and Region |
|
Report coverage |
Revenue & volume forecast, company share, competitive landscape, growth factors, and trends |
|
Geographic regions covered |
North America, Europe, Asia Pacific, Latin America, Middle East & Africa |
Ans. The global Workplace Safety market size is projected to reach 30.4 Billion USD by 2028, from 13.1 Billion USD in 2021, at a CAGR of 12.8% during 2022-2028.
Ans. The global Workplace Safety market is expected to grow at a compound annual growth rate of 12.8% from 2022 to 2028.
Ans. IBM, Honeywell, 3M, Hexagon, Appian, Bosch, Cority, Enablon, Intelex Technologies, Damotech.
Ans. Yes, ChapterWise report available for the Workplace Safety Market.
$3350
$5025
$6700
HAVE A QUERY?
OUR CUSTOMER

SIMILAR REPORTS