
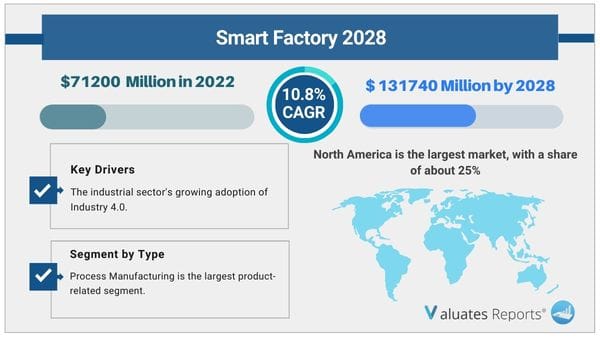
Considering the economic change due to COVID-19 and Russia-Ukraine War Influence, the global Smart Factory market is projected to reach US$ 131740 million by 2028 from an estimated US$ 71200 million in 2022, at a CAGR of 10.8% during 2023 and 2028. The industrial sector's increasing adoption of Industry 4.0 is what is driving the market for smart factories. A faster pace of technological advancement and digital trends, such as 5G and industrial IoT, is predicted to hasten the global development of smart factories.
The Smart Factory market is anticipated to rise as Industry 4.0 adoption increases. Manufacturers are integrating cutting-edge technology into their manufacturing processes, including the Internet of Things (IoT), cloud computing, analytics, artificial intelligence (AI), and machine learning. In these "smart factories," which gather and analyze data to aid in decision-making, advanced sensors, embedded software, and robotics are all present. Even more, value can be derived from previously dispersed information when operational data from ERP, supply chain, customer service, and other corporate systems is connected with data from production processes. IoT-enabled smart factories produce more products of a higher caliber. By replacing manual inspection business models with visual insights enabled by AI, manufacturing errors are reduced and money and time are saved.
During the COVID-19 outbreak, every segment and component of the smart factory market was affected or shut down. During the initial global closure, supply chains and operational logistics were abruptly impacted. As the demand for non-essential items decreased, the market started to focus more on creating the goods needed to survive the epidemic. However, due to the need for businesses to deliver goods and services quickly and safely during the outbreak, the market for smart factories grew. Demand, together with government financial and technical assistance, contributed to the market's expansion throughout this momentous event.
The market for smart factories is anticipated to continue expanding due to the automotive industry. With electric vehicles increasingly taking center stage instead of internal combustion engines, the automobile industry has been going through some substantial changes. Automakers are investing in the development of smart manufacturing and automation to reduce operating costs and increase productivity.
The biggest market is North America, with a market share of around 25%, followed by China and Europe, both of which have a market share of about 45%. The adoption of smart factories in the North American region is being fueled by the existence of large organizations as well as the rapid development of cloud manufacturing technology and smart manufacturing solutions.
Process Manufacturing is the largest product-related segment, accounting for over 45% of the market.
In terms of application, transportation and autos, chemicals and materials, food and beverage, etc. are all ranked after oil and gas in that order.
| Report Metric | Details |
| Report Name | Smart Factory Market |
| The market size in 2022 | USD 71200 Million |
| The revenue forecast in 2028 | USD 131740 Million |
| Growth Rate | Compound Annual Growth Rate (CAGR) of 10.8% from 2023 to 2028 |
| Market size available for years | 2023-2028 |
| Forecast units | Value (USD) |
| Segments covered | By Type, Application & Regions |
| Report coverage | Revenue & volume forecast, company share, competitive landscape, growth factors, and trends |
| Geographic regions covered | North America, Europe, Asia Pacific, Latin America, Middle East & Africa |
Ans. Smart Factory market is projected to reach US$ 131740 million by 2028 from an estimated US$ 71200 million in 2022.
Ans. Smart Factory market is expected to grow at a compound annual growth rate of 10.8% from 2023 to 2028.
Ans. Global Smart Factory key players include Siemens AG, ABB Ltd., Yokogawa Electric Corp., General Electric Company, Honeywell International, Inc., etc. Global top five manufacturers hold a share nearly 25%.
Ans. Yes, ChapterWise report available for the Smart Factory market.
List of Tables
Table 1. Global Smart Factory Market Size Growth Rate by Type (US$ Million): 2017 VS 2021 VS 2028
Table 2. Major Manufacturers of Process Manufacturing
Table 3. Major Manufacturers of Discrete Manufacturing
Table 4. Major Manufacturers of Others
Table 5. Global Smart Factory Market Size Growth by Application (US$ Million): 2017 VS 2021 VS 2028
Table 6. Global Smart Factory Market Size by Region (US$ Million): 2021 VS 2022 VS 2028
Table 7. Global Smart Factory Sales by Region (2017-2022) & (Unit System)
Table 8. Global Smart Factory Sales Forecast by Region (2023-2028) & (Unit System)
Table 9. Global Smart Factory Revenue by Region (2017-2022) & (US$ Million)
Table 10. Global Smart Factory Revenue Forecast by Region (2023-2028) & (US$ Million)
Table 11. Global Smart Factory Sales by Manufacturer (2017-2022) & (Unit System)
Table 12. Global Smart Factory Sales Share by Manufacturer (2017-2022)
Table 13. Smart Factory Revenue by Manufacturer (2017-2022) & (US$ Million)
Table 14. Smart Factory Revenue Share by Manufacturer (2017-2022)
Table 15. Key Manufacturers Smart Factory Price (2017-2022) & (M USD/System)
Table 16. Ranking of Global Top Smart Factory Manufacturers by Revenue (US$ Million) in 2021
Table 17. Global Smart Factory Manufacturers Market Concentration Ratio (CR5 and HHI) & (2017-2022)
Table 18. Global Smart Factory by Company Type (Tier 1, Tier 2 and Tier 3) & (based on the Revenue in Smart Factory as of 2021)
Table 19. Smart Factory Manufacturers Manufacturing Base Distribution and Headquarters
Table 20. Manufacturers Smart Factory Product Type
Table 21. Date of International Manufacturers Enter into Smart Factory Market
Table 22. Manufacturers Mergers & Acquisitions, Expansion Plans
Table 23. Siemens AG Corporation Information
Table 24. Siemens AG Description and Business Overview
Table 25. Siemens AG Smart Factory Sales (Unit System), Revenue (US$ Million), Price (M USD/System) and Gross Margin (2017-2022)
Table 26. Siemens AG Smart Factory Product
Table 27. Siemens AG Smart Factory Sales Proportion of Smart Factory by Product in 2021
Table 28. Siemens AG Smart Factory Sales Proportion of Smart Factory by Application in 2021
Table 29. Siemens AG Smart Factory Sales Proportion of Smart Factory by Geographic Area in 2021
Table 30. Siemens AG Recent Development
Table 31. ABB Ltd. Corporation Information
Table 32. ABB Ltd. Description and Business Overview
Table 33. ABB Ltd. Smart Factory Sales (Unit System), Revenue (US$ Million), Price (M USD/System) and Gross Margin (2017-2022)
Table 34. ABB Ltd. Smart Factory Product
Table 35. ABB Ltd. Smart Factory Sales Proportion of Smart Factory by Product in 2021
Table 36. ABB Ltd. Smart Factory Sales Proportion of Smart Factory by Application in 2021
Table 37. ABB Ltd. Smart Factory Sales Proportion of Smart Factory by Geographic Area in 2021
Table 38. ABB Ltd. Recent Development
Table 39. Honeywell International, Inc. Corporation Information
Table 40. Honeywell International, Inc. Description and Business Overview
Table 41. Honeywell International, Inc. Smart Factory Sales (Unit System), Revenue (US$ Million), Price (M USD/System) and Gross Margin (2017-2022)
Table 42. Honeywell International, Inc. Smart Factory Product
Table 43. Honeywell International, Inc. Smart Factory Sales Proportion of Smart Factory by Product in 2021
Table 44. Honeywell International, Inc. Smart Factory Sales Proportion of Smart Factory by Application in 2021
Table 45. Honeywell International, Inc. Smart Factory Sales Proportion of Smart Factory by Geographic Area in 2021
Table 46. Honeywell International, Inc. Recent Development
Table 47. Yokogawa Electric Corp. Corporation Information
Table 48. Yokogawa Electric Corp. Description and Business Overview
Table 49. Yokogawa Electric Corp. Smart Factory Sales (Unit System), Revenue (US$ Million), Price (M USD/System) and Gross Margin (2017-2022)
Table 50. Yokogawa Electric Corp. Smart Factory Product
Table 51. Yokogawa Electric Corp. Smart Factory Sales Proportion of Smart Factory by Product in 2021
Table 52. Yokogawa Electric Corp. Smart Factory Sales Proportion of Smart Factory by Application in 2021
Table 53. Yokogawa Electric Corp. Smart Factory Sales Proportion of Smart Factory by Geographic Area in 2021
Table 54. Yokogawa Electric Corp. Recent Development
Table 55. General Electric Company Corporation Information
Table 56. General Electric Company Description and Business Overview
Table 57. General Electric Company Smart Factory Sales (Unit System), Revenue (US$ Million), Price (M USD/System) and Gross Margin (2017-2022)
Table 58. General Electric Company Smart Factory Product
Table 59. General Electric Company Smart Factory Sales Proportion of Smart Factory by Product in 2021
Table 60. General Electric Company Smart Factory Sales Proportion of Smart Factory by Application in 2021
Table 61. General Electric Company Smart Factory Sales Proportion of Smart Factory by Geographic Area in 2021
Table 62. General Electric Company Recent Development
Table 63. Emerson Electric Company Corporation Information
Table 64. Emerson Electric Company Description and Business Overview
Table 65. Emerson Electric Company Smart Factory Sales (Unit System), Revenue (US$ Million), Price (M USD/System) and Gross Margin (2017-2022)
Table 66. Emerson Electric Company Smart Factory Product
Table 67. Emerson Electric Company Smart Factory Sales Proportion of Smart Factory by Product in 2021
Table 68. Emerson Electric Company Smart Factory Sales Proportion of Smart Factory by Application in 2021
Table 69. Emerson Electric Company Smart Factory Sales Proportion of Smart Factory by Geographic Area in 2021
Table 70. Schnieder Electric Corporation Information
Table 71. Schnieder Electric Description and Business Overview
Table 72. Schnieder Electric Smart Factory Sales (Unit System), Revenue (US$ Million), Price (M USD/System) and Gross Margin (2017-2022)
Table 73. Schnieder Electric Smart Factory Product
Table 74. Schnieder Electric Smart Factory Sales Proportion of Smart Factory by Product in 2021
Table 75. Schnieder Electric Smart Factory Sales Proportion of Smart Factory by Application in 2021
Table 76. Schnieder Electric Smart Factory Sales Proportion of Smart Factory by Geographic Area in 2021
Table 77. Atos SE Corporation Information
Table 78. Atos SE Description and Business Overview
Table 79. Atos SE Smart Factory Sales (Unit System), Revenue (US$ Million), Price (M USD/System) and Gross Margin (2017-2022)
Table 80. Atos SE Smart Factory Product
Table 81. Atos SE Smart Factory Sales Proportion of Smart Factory by Product in 2021
Table 82. Atos SE Smart Factory Sales Proportion of Smart Factory by Application in 2021
Table 83. Atos SE Smart Factory Sales Proportion of Smart Factory by Geographic Area in 2021
Table 84. Rockwell Automation Inc. Corporation Information
Table 85. Rockwell Automation Inc. Description and Business Overview
Table 86. Rockwell Automation Inc. Smart Factory Sales (Unit System), Revenue (US$ Million), Price (M USD/System) and Gross Margin (2017-2022)
Table 87. Rockwell Automation Inc. Smart Factory Product
Table 88. Rockwell Automation Inc. Smart Factory Sales Proportion of Smart Factory by Product in 2021
Table 89. Rockwell Automation Inc. Smart Factory Sales Proportion of Smart Factory by Application in 2021
Table 90. Rockwell Automation Inc. Smart Factory Sales Proportion of Smart Factory by Geographic Area in 2021
Table 91. Robert Bosch GmbH Corporation Information
Table 92. Robert Bosch GmbH Description and Business Overview
Table 93. Robert Bosch GmbH Smart Factory Sales (Unit System), Revenue (US$ Million), Price (M USD/System) and Gross Margin (2017-2022)
Table 94. Robert Bosch GmbH Smart Factory Product
Table 95. Robert Bosch GmbH Smart Factory Sales Proportion of Smart Factory by Product in 2021
Table 96. Robert Bosch GmbH Smart Factory Sales Proportion of Smart Factory by Application in 2021
Table 97. Robert Bosch GmbH Smart Factory Sales Proportion of Smart Factory by Geographic Area in 2021
Table 98. Global Smart Factory Sales by Type (2017-2022) & (Unit System)
Table 99. Global Smart Factory Sales Forecast by Type (2023-2028) & (Unit System)
Table 100. Global Smart Factory Revenue by Type (2017-2022) & (US$ Million)
Table 101. Global Smart Factory Revenue Forecast by Type (2023-2028) & (US$ Million)
Table 102. Global Smart Factory Sales by Application (2017-2022) & (Unit System)
Table 103. Global Smart Factory Sales Forecast by Application (2023-2028) & (Unit System)
Table 104. Global Smart Factory Revenue by Application (2017-2022) & (US$ Million)
Table 105. Global Smart Factory Revenue Forecast by Application (2023-2028) & (US$ Million)
Table 106. North America Smart Factory Sales by Country (2017-2022) & (Unit System)
Table 107. North America Smart Factory Sales by Country (2023-2028) & (Unit System)
Table 108. North America Smart Factory Revenue by Country (2017-2022) & (US$ Million)
Table 109. North America Smart Factory Revenue by Country (2023-2028) & (US$ Million)
Table 110. North America Smart Factory Sales by Type (2017-2022) & (Unit System)
Table 111. North America Smart Factory Sales by Application (2017-2022) & (Unit System)
Table 112. Asia-Pacific Smart Factory Sales by Region (2017-2022) & (Unit System)
Table 113. Asia-Pacific Smart Factory Sales by Region (2023-2028) & (Unit System)
Table 114. Asia-Pacific Smart Factory Revenue by Region (2017-2028) & (US$ Million)
Table 115. Asia-Pacific Smart Factory Revenue by Region (2023-2028) & (US$ Million)
Table 116. Asia-Pacific Smart Factory Sales by Type (2017-2022) & (Unit System)
Table 117. Asia-Pacific Smart Factory Sales by Application (2017-2022) & (Unit System)
Table 118. Europe Smart Factory Sales by Country (2017-2022) & (Unit System)
Table 119. Europe Smart Factory Sales by Country (2023-2028) & (Unit System)
Table 120. Europe Smart Factory Revenue by Country (2017-2022) & (US$ Million)
Table 121. Europe Smart Factory Revenue by Country (2023-2028) & (US$ Million)
Table 122. Europe Smart Factory Sales by Type (2017-2022) & (Unit System)
Table 123. Europe Smart Factory Sales by Application (2017-2022) & (Unit System)
Table 124. Latin America Smart Factory Sales by Country (2017-2022) & (Unit System)
Table 125. Latin America Smart Factory Sales by Country (2023-2028) & (Unit System)
Table 126. Latin America Smart Factory Revenue by Country (2017-2022) & (US$ Million)
Table 127. Latin America Smart Factory Revenue by Country (2023-2028) & (US$ Million)
Table 128. Latin America Smart Factory Sales by Type (2017-2022) & (Unit System)
Table 129. Latin America Smart Factory Sales by Application (2017-2022) & (Unit System)
Table 130. Middle East and Africa Smart Factory Sales by Country (2017-2022) & (Unit System)
Table 131. Middle East and Africa Smart Factory Sales by Country (2023-2028) & (Unit System)
Table 132. Middle East and Africa Smart Factory Revenue by Country (2017-2022) & (US$ Million)
Table 133. Middle East and Africa Smart Factory Revenue by Country (2023-2028) & (US$ Million)
Table 134. Middle East and Africa Smart Factory Sales by Type (2017-2022) & (Unit System)
Table 135. Middle East and Africa Smart Factory Sales by Application (2017-2022) & (Unit System)
Table 136. Smart Factory Key Raw Materials, Industry Status and Trend
Table 137. Smart Factory Key Raw Materials and Upstream Suppliers
Table 138. Smart Factory Clients Status and Trend
Table 139. Smart Factory Typical Clients
Table 140. Smart Factory Distributors
Table 141. Smart Factory Market Trends
Table 142. Smart Factory Market Drivers
Table 143. Smart Factory Market Challenges
Table 144. Smart Factory Market Restraints
Table 145. Research Programs/Design for This Report
Table 146. Key Data Information from Secondary Sources
Table 147. Key Data Information from Primary Sources
List of Figures
Figure 1. Smart Factory Product Picture
Figure 2. Global Smart Factory Sales Market Share by Type in 2021 & 2028
Figure 3. Process Manufacturing Product Picture
Figure 4. Discrete Manufacturing Product Picture
Figure 5. Others Product Picture
Figure 6. Global Smart Factory Sales Market Share by Application in 2021 & 2028
Figure 7. Automobile and transportation Examples
Figure 8. Food and beverage Examples
Figure 9. Electrical and electronics Examples
Figure 10. Chemical and material Examples
Figure 11. Oil and Gas Examples
Figure 12. Others Examples
Figure 13. Smart Factory Report Years Considered
Figure 14. Global Smart Factory Market Size, (US$ Million), 2017 VS 2021 VS 2028
Figure 15. Global Smart Factory Market Size 2017-2028 (US$ Million)
Figure 16. Global Smart Factory Sales 2017-2028 (Unit System)
Figure 17. Global Smart Factory Market Size Market Share by Region: 2022 Versus 2028
Figure 18. Global Smart Factory Sales Market Share Forecast by Region (2017-2028)
Figure 19. Global Smart Factory Revenue Market Share by Region (2017-2028)
Figure 20. Global Smart Factory Sales Share by Manufacturer in 2021
Figure 21. Smart Factory Market Share by Company Type (Tier 1, Tier 2 and Tier 3): 2017 VS 2021
Figure 22. Global Smart Factory Sales Market Share Forecast by Type (2017-2028)
Figure 23. Global Smart Factory Revenue Market Share Forecast by Type (2017-2028)
Figure 24. Smart Factory Average Selling Price (ASP) by Type (2017-2022) & (M USD/System)
Figure 25. Global Smart Factory Sales Market Share Forecast by Application (2017-2028)
Figure 26. Global Smart Factory Revenue Market Share Forecast by Application (2017-2028)
Figure 27. Smart Factory Average Selling Price (ASP) by Application (2017-2022) & (M USD/System)
Figure 28. North America Smart Factory Revenue 2017-2028 (US$ Million)
Figure 29. North America Smart Factory Sales Market Share by Type (2017-2022)
Figure 30. North America Smart Factory Sales Market Share by Application (2017-2022)
Figure 31. Asia-Pacific Smart Factory Revenue 2017-2028 (US$ Million)
Figure 32. Asia-Pacific Smart Factory Sales Market Share by Region (2017-2028)
Figure 33. Asia-Pacific Smart Factory Revenue Market Share by Region (2017-2028)
Figure 34. Asia-Pacific Smart Factory Sales Market Share by Type (2017-2022)
Figure 35. Asia-Pacific Smart Factory Sales Market Share by Application (2017-2022)
Figure 36. Europe Smart Factory Revenue Growth Rate 2017-2028 (US$ Million)
Figure 37. Europe Smart Factory Sales Market Share by Country (2017-2028)
Figure 38. Europe Smart Factory Revenue Market Share by Country (2017-2028)
Figure 39. Europe Smart Factory Sales Market Share by Type (2017-2022)
Figure 40. Europe Smart Factory Sales Market Share by Application (2017-2022)
Figure 41. Latin America Smart Factory Revenue Growth Rate 2017-2028 (US$ Million)
Figure 42. Latin America Smart Factory Sales Market Share by Country (2017-2028)
Figure 43. Latin America Smart Factory Revenue Market Share by Country (2017-2022)
Figure 44. Latin America Smart Factory Sales Market Share by Type (2017-2022)
Figure 45. Latin America Smart Factory Sales Market Share by Application (2017-2022)
Figure 46. Middle East and Africa Smart Factory Revenue Growth Rate 2017-2028 (US$ Million)
Figure 47. Middle East and Africa Smart Factory Sales Market Share by Country (2017-2028)
Figure 48. Middle East and Africa Smart Factory Revenue Market Share by Country (2017-2028)
Figure 49. Middle East and Africa Smart Factory Sales Market Share by Type (2017-2022)
Figure 50. Middle East and Africa Smart Factory Sales Market Share by Application (2017-2022)
Figure 51. Smart Factory Supply Chain (Upstream and Downstream Market)
Figure 52. Global Production Market Share of Smart Factory Raw Materials by Region in 2021
Figure 53. Smart Factory Distribution Channels
Figure 54. Global Smart Factory Percentage 2017-2028: Indirect Sales VS Direct Sales
Figure 55. Global Smart Factory Percentage 2017-2028: Online Sales VS Offline Sales
Figure 56. Bottom-up and Top-down Approaches for This Report
Figure 57. Data Triangulation
$5900
$11800
HAVE A QUERY?
OUR CUSTOMER

SIMILAR REPORTS